

Abstract
Background:
Diabetes mellitus drains a significant percent of the health budget by cost toward direct diabetes care and diabetes-related disabilities.
Objectives:
The aim of the study is to assess the annual costs incurred by patients with type 2 diabetes mellitus.
Methodology:
This cross-sectional study was undertaken among 153 diabetic people in an urban underprivileged area of Bengaluru from January 2013 to January 2014. This was a cost of illness study done from the patient's perspective using a structured interview schedule.
Results:
A diabetic person in an urban underprivileged community in Bengaluru spends 11,489.38 ± 28,341.77 annually for diabetic care. Direct and indirect costs accounted for 95% and 5% of costs. Majority were spent on admission (45.1%), followed by drugs (21.8%), investigations (5.6%), and consultations (4.5%). Nonmedical costs such as food and transport accounted for 18% of the costs. About 50% of them had delayed treatment due to financial constraints. Nearly 25% of patient's income and 10.7% of the family income were spent for diabetic care. Higher education, income, duration of disease, hospital admission, type of treatment, and place of treatment were found to be associated with costs.
Conclusion:
Estimates of cost will help conceptualize strategies to deal with the situation at local, regional, and national level.
Keywords: Cost of illness, diabetes mellitus, underprivileged area
INTRODUCTION
Diabetes mellitus is one of the most common noncommunicable diseases and the seventh leading cause of death globally.[1,2] India had the largest number of diabetic patients after China with a prevalence of 8.8%.[3] The prevalence ranges from 2.4% (rural) to 11.6% (urban) in South India.[4,5,6,7]
As per the WHO estimates, diabetes drains a significant percent of the health budget by cost toward diabetic care.[8] The long-term complications occurring during the most productive years pose an economic and social burden both at the individual and national level. Very little is known about the economic impact of diabetes in the developing world where predicted prevalence are highest.[8]
Economic evaluation is used as a generic term for a range of techniques that may be used to assemble evidence on the expected costs and consequences of different procedures or programs. It can be carried out from the perspective of the patient, provider, policy-maker, or society in general. Cost of illness study is a type of partial economic evaluation which identifies and measures all the costs of a particular disease.[9,10,11]
In developing countries like India, which lack a comprehensive health-care system and uniform documentation of medical details, data on the expenditure on diabetes care are limited.[12] So far, very few community studies have been done in urban underprivileged areas to assess the costs of diabetic care.[12,13,14]
Objectives
The main objectives of the present study were as follow:
To assess the annual direct and indirect costs toward care for diabetes incurred by patients with known Type 2 diabetes mellitus in an urban underprivileged area of Bengaluru
To study the factors associated with the cost of care.
METHODOLOGY
A cross-sectional study was undertaken in an urban underprivileged area of Bengaluru from January 2013 to January 2014. It was a cost of illness study done from the patient's perspective. A door-to-door survey was conducted [Figure 1]. All adults diagnosed with Type 2 diabetes mellitus ≥1 year were included. Persons with cognitive impairment and/or moribund persons who were unable to answer and in the absence of a reliable caregiver were excluded. Based on a study done in rural Bengaluru by Shilpa et al. (unpublished data) in 2011, the mean annual cost incurred by a diabetic person was Rs. 8358 ± 8475. Considering this and applying a relative precision of 20% at 95% confidence interval and a nonresponse rate of 20%, the minimum sample size for the present study was calculated to be 120. However, all the 153 individuals residing in the defined geographic area who met the inclusion criteria and consented were included. A structured interview schedule (three parts – sociodemographic profile, details regarding diabetes mellitus, and costs) was developed, which was later translated into the local language with back translation done to ensure quality. Content validation of the tool was done before deployment in the field by having it reviewed by a panel of experts including a health economist. A pilot study was done in an adjacent underprivileged area and required changes (questions related to capital costs of the glucometer, projected utility of the instrument, and methods to alleviate immediate financial crisis for the care of diabetes) were made after the pilot study.
Figure 1.

Details of the door-to-door survey
Direct medical – Medical care including drugs, consultation, laboratory investigations, and hospitalization.
Direct nonmedical – Expenses incurred for food and travel for the diabetic care and food modifications as advised by the doctor as a part of nonpharmacological management.
Indirect – Lost income (patient and caregiver) for care.
Source of information
The patient, family members, or caregiver of the patient, and the information was cross-checked by inspecting the medicines, insulin bottles, and syringes. To check the validity of the costs reported, patients were asked to produce the bills.
Estimation of costs
Drug costs – Annual drug costs were estimated by multiplying the monthly drug cost by 12
Consultation costs – Information was collected about cost per visit separately to private and public health centers and multiplied by the number of visits
Investigation costs – Expenses for investigations were multiplied by the stated frequency to estimate annual costs. For the patients who did self-monitoring of blood sugars, separate costs were estimated for the strips and lancets used. The cost of glucometer for 1 year was estimated by dividing the capital cost of the equipment by projected utility of the instrument as mentioned by the manufacturer
Hospitalization costs – The estimates of the cost of hospitalization were based on the frequency of hospital admissions and hospital costs per event
Travel costs – Patients were asked regarding the average travel costs per follow-up visit in the recent past and multiplied by the number of total visits in the year
Food costs – The patient was specifically asked whether food was taken outside for all the visits. For food taken outside, costs incurred during the last visit were multiplied by the number of visits. Special food prepared only for the diabetic patient at home was asked for and the cost of the food items per month was calculated and was later multiplied by 12.
Direct nonmedical costs – Direct nonmedical costs were difficult to estimate as it was not possible to check for the validity of the information given by the participants.
Indirect costs – Indirect costs included person-days and income lost for participants and caregivers. It was estimated for those who were gainfully employed only. Monetary value was calculated by multiplying a number of person-days lost with reported daily income (monthly income divided by 30) using the human capital method.
All these costs were added up to estimate the average annual costs using bottom-to-top approach.
Analysis
The data collected were entered in the Microsoft Excel and analyzed using Statistical Package for the Social Sciences (SPSS) version 16.0, (IBM). Direct and indirect costs were expressed using mean and standard deviation, median and interquartile range. Mann–Whitney U-test, Kruskal–Wallis tests, and Spearman correlation coefficient were used as appropriate.
RESULTS
A total of 153 people were studied. Among them, 34.6% (53) were males, 30% were widow (er) s, 35.9% (55) were uneducated, 71.9 % (110) belonged to lower and middle socioeconomic class, and 48.4% (74) were gainfully employed/pensioners. The mean age was 53.90 ± 11.64 years. The mean income (patients) was 5559.46 ± 3793.30 and the total family income/month was Rs. 10,196.73 ± 6623.58. Majority, 91 (59.4%), were dependent on others financially (fully or partially). Very few, 10 (6.5%), had some kind of medical insurance.
The prevalence of self-reported diabetes was 9.02% details in Table 1. Majority, 96 (62.7%), had their last visit for diabetes care in the past 1 month. Among them, 121 (79.1%) got investigations done at the hospital visited for consultation, whereas some 28 (18.3%) had at private laboratories. Few 6 (3%) used a glucometer at home. Nearly 67% (103) reported at least one complication and 50% reported at least one co-morbidity. A total of 19 people were hospitalized and only one event per person with a mean stay of 8 ± 4 days was reported.
Table 1.
Distribution of the respondents based on details of diabetes mellitus (n=153)
| Variables | n (%), 95% CI |
|---|---|
| Duration of disease (years) | |
| ≤5 | 92 (60.1), 52.1-68 |
| >5 | 61 (39.9), 31.9-47.8 |
| Type of treatment | |
| Only OHA | 126 (82.4), 76.2-88.5 |
| Insulin±OHA | 12 (7.8), 3.4-12.1 |
| Not on pharmacological treatment | 15 (9.8), 4.9-14.6 |
| Nonpharmacological treatment | |
| Diet restriction | 92 (60.1), 52.1-68.1 |
| Both diet restriction and exercise | 10 (6.5), 2.5-10.4 |
| No diet restriction/exercise | 51 (33), 25.3-40.6 |
| Status of hospitalization | |
| Hospitalization present | 19 (12.4), 7.1-17.7 |
| Hospitalization absent | 134 (87.6), 82.2-92.9 |
| OPD visits for the care of diabetes mellitus | |
| ≤10 | 92 (60.1), 52.1-68 |
| 11-20 | 54 (35.3), 27.6-43 |
| >20 | 7 (4.6), 1.2-7.8 |
| Place of treatment | |
| Public sector | 15 (9.8), 5-14.6 |
| Private sector | 126 (82.4), 76.2-88.5 |
| Both private and public sector | 12 (7.8), 3.5-12.1 |
OHA: Oral hypoglycemic agents, OPD: Outpatient department, CI: Confidence interval
A diabetic person in an urban underprivileged community in Bengaluru spends 11, 489.38 ± 28,341.77 annually for diabetic care. The mean direct costs and indirect costs were 10,892.87 ± 26,498.82 and 596.51 ± 3,418.55, respectively. The mean total cost among hospitalized patients was 54,467 ± 66,304.87 and among nonhospitalized was 5395.50 ± 4661.40. Among the nonhospitalized patients, the major proportion was the drug costs (40%), followed by food costs (32%), consultation/investigation costs (19.8%), travel (4.7%), and indirect costs (3.5%) [details of expenditure in Tables 2, 3, and Figure 2]. The proportion of income spent for care by the patient and family was 22.3% and 10.7%, respectively. Among participants who did not have an income, it was 7.7%. Seventy-five (49%) had delayed treatment due to financial constraints. Methods adopted to overcome immediate financial needs were borrowing 55 (35.9%), pawning 4 (26%), selling assets 1 (0.7%), and bank loans 1 (0.7%).
Table 2.
Details regarding expenditure on diabetes care
| Type of costs | Costs (n=153) Mean±SD Median (IQR) |
|---|---|
| Total costs | 11,489.38±28,341.77* |
| 4872 (2320, 9058)** | |
| Direct costs | 10,892.87±26,498.82* |
| 4648 (2273, 9058)** | |
| Direct medical | 8830.99±26,303.72* |
| 3024 (1126, 5716)** | |
| Drugs costs | 2508.08±3179.90* |
| 1565 (312, 3600)** | |
| Consultation costs | 509.96±609.45* |
| 300 (100, 660)** | |
| Investigation costs | 637.18±884.54* |
| 330 (120, 850)** | |
| Admission costs | 5175.76±24666.37* |
| 0 (0, 0)** | |
| Direct nonmedical | 2061±3211.97* |
| 600 (12, 2620)** | |
| Transport | 265.90±634.77* |
| 0 (0, 300)** | |
| Food | 1795.98±3050.24* |
| 160 (0, 2400)** | |
| Indirect costs | 596.51±3418.55* |
| 0 (0, 0)** |
*Mean and SD, **Median and IQR. IQR: Interquartile range, SD: Standard deviation
Table 3.
Comparison of costs for diabetes care based on status of hospitalization
| Type of cost | Non Hosp Mean±SD | Non Hosp Median(IQR) | Hosp Mean±SD | Hosp Median(IQR) |
|---|---|---|---|---|
| Total costs | 5395.50±4661.40 | 4000 (2173.75, 7210.50) | 54,467±66,304.87 | 32,164.32 (10,229.57, 56,887.28) |
| Direct costs | 5207.70±4548.70 | 3790 (2050.62, 6966) | 50,988.31±61,960.75 | 29,764.32 (10,229.57, 50,887.28) |
| Direct medical | 3224.17±3140.80 | 2610 (969, 4438.50) | 48,373.83±62,331.14 | 23,043.36 (5720, 46,837.28) |
| Drugs costs | 2155.04±2689.97 | 1518 (219.75, 2985.30) | 4997.94±4944.81 | 4860 (828, 8113.92) |
| Consultation costs | 492.42±595.43 | 300 (100, 600) | 633.68±705.97 | 300 (200, 1100) |
| Investigation costs | 576.71±833.84 | 300 (100, 720) | 1063.68±1118.23 | 720 (250, 1200) |
| Admission costs | - | - | 41,678.53±59,430.20 | 18,000 (5000, 40,000) |
| Direct nonmedical | 1983.52±3221.37 | 530 (0, 2420) | 2614.47±3174.11 | 1200 (240, 3600) |
| Transport | 252.51±629.82 | 0 (0, 246) | 360.26±678.81 | 150 (0, 360) |
| Food | 1731±3041.96 | 90 (0, 2400) | 2254.21±3152.91 | 1200 (0, 3000) |
| Indirect costs | 187.80±633.31 | 0 (0, 0) | 3478.96±9257.90 | 0 (0, 2400) |
IQR: Interquartile range, SD: Standard deviation
Figure 2.
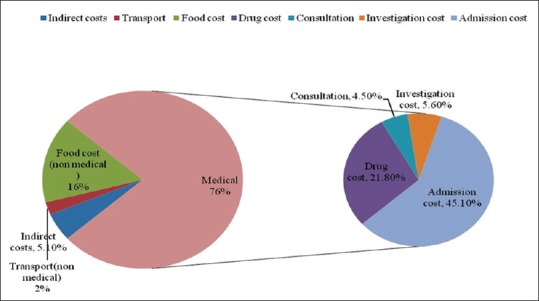
Break up of total costs among all patients (n = 153)
Factors associated with total costs were hospitalization status, type of treatment, tertiary care, income (ρ = 0.171; P = 0.034), and a past history of myocardial infarction (MI) [Table 4].
Table 4.
Comparison of median total cost between groups
| Categories | Total costs | P | |
|---|---|---|---|
| Median (Rs) | IQR | ||
| Admission | |||
| Yes | 32,164.32 | 10,229.57, 56,887.2 | <0.001 |
| No | 4000 | 2173.7, 7210.5 | |
| Type of treatment | |||
| Not on drugs | 2490 | 720, 7540 | <0.001 |
| Only OHA | 4481.3 | 2320, 7849.5 | |
| Insulin±OHA | 18,306.9 | 7859.3, 44,442.3 | |
| Tertiary care | |||
| Yes | 7949 | 3517.5, 20,401.4 | <0.001 |
| No | 3780 | 2190, 6912 | |
| History of MI | |||
| Yes | 46,593 | 6063, 185,244 | 0.002 |
| No | 4297 | 2312, 8340 | |
OHA: Oral hypoglycemic agents, IQR: Interquartile range
Subanalysis was done to find out factors associated with each component of costs. The drug costs were associated with the hospitalization, past history of MI, longer duration of disease, and place of treatment (private > public). The investigation costs were associated to the higher educational status of the patient, financial constraints, and the type of treatment received (insulin therapy > oral hypoglycemic agents [OHA]). Costs spent on food were associated with patient's income. Factors such as place of treatment (public > private), hospitalization, and tertiary care were associated with travel costs.
No significant associations with factors such as age, gender, marital status, type of family, religion, medical insurance, complications other than MI, comorbidities, and personal habits.
DISCUSSION
This study describes the annual costs of care for patients diagnosed with diabetes in an urban slum area. Among the population studied, majority belonged to low socioeconomic and educational status. This result is supported by other studies done in underprivileged areas of Karnataka.[15,16,17,18,19] The prevalence of self-reported type 2 diabetes mellitus was 9.02% which was similar in other studies[7,12,13,20,21] The study had only looked at known cases and an active survey in this area would yield higher prevalence rates. The prevalence of self-reported complications and comorbidities was comparable with Bengaluru urban district study (BUD).[13]
A similar study done to assess the economic burden among diabetes has shown that the average cost was Rs. 6782, which is less compared to our study.[13] Another hospital-based study done in India showed that the median expenditure was Rs. 10,000 (urban) and Rs. 6260 (rural) annually.[12] The costs were high compared to our study (median cost was Rs. 4872) may be because the study was done among hospitalized patients. The median costs among hospitalized patients in our study were estimated to be higher. As majority were not gainfully employed, indirect costs were lower compared to another similar study done in India.[14] Major proportion was spent on admission and drugs. Consultation and investigations costs accounted for 10.1% of costs. This proportion is higher in the BUD study as patients were selected from the hospital and later interviewed in the community. In contrast, this study had selected patients by doing a house-to-house survey.
Indirect costs were higher among hospitalized patients (6.3%), and this may be due to the loss of wages due to hospitalization. Significant association was found between the higher family income and the hospitalization status. Similar observations were made in other studies done in India.[13,22] The costs went up if the patients had a history of MI due to the requirement of hospitalization.[12,13] In addition to the above, direct medical costs among nonhospitalized patients were found to be associated with utilization of private health centers. On further detailed analysis, it was found that this is due to significant difference in the consultation and drug costs between public and private health centers. Another interesting finding was association between financial constraints and investigation costs. The diabetic people who had delayed treatment due to financial constraints had spent less on investigations compared to others. This difference could be because patients are cutting down on investigations rather than compromising on purchasing drugs or consultation.
People using insulin therapy along with OHAs were spending much higher on investigations, probably due to more number of investigations assuming that their glycemic control is less compared to others. People with higher duration of disease had spent more on drugs, probably due to same reasons. The better-educated people were spending more on investigations, mostly due to better awareness regarding the importance of diabetic care.
Compared to the people who approached private clinics, transport costs were high among those who went to public health centers. This may be due to the easy accessibility of small private clinics in the study area. Dietary modifications as a part of the nonpharmacological management were not followed due to unaffordability. The only factor that was associated with food costs was the patient's income. No literature was available to compare the above factors associated with each and every component of the total costs.
Even in an urban slum area, patients are nearly spending one-fourth of their income and ≥10% of their family income for diabetic care. However, other community-based studies did not capture information regarding financial difficulties due to diabetes.
Strengths and limitations
This study is one among the few community-based studies that have looked into the cost of care and probably this is the only study and first of its kind, which has done a house-to-house survey to identify diabetic patients in the study area. To the best extent possible the details of every cost involved and its related factors from the patient's perspective were studied. Our study had few limitations. The study could not capture all the indirect costs involved. The information that was collected was mainly self-reported as some of the records in the form of bills were discarded. The sample size for our study was calculated to estimate the primary objective of the finding, the cost of diabetic care, and was inadequate to make meaningful associations across the groups in order to study the factors associated with costs.
CONCLUSION
The cost of care among persons with Type 2 Diabetes Mellitus was found to be high in an urban underprivileged area of Bengaluru. Nearly one fourth of the income of the patient was spent for diabetic care. Primary and secondary care interventions can delay or arrest the development of complications and will help to reduce the costs associated with care. More research in the field of health care costs will help to conceptualize cost effective strategies at local, regional and national level.
Financial support and sponsorship
Nil.
Conflicts of interest
There are no conflicts of interest.
Acknowledgment
The authors would like to acknowledge the Indian Council of Medical Research for providing financial assistance as student's grant for this project.
REFERENCES
- 1.American Diabetic Association. Diagnosis and classification of diabetes mellitus. [Last accessed on 2014 May 01];Diabet Care. 2008 31:55–66. Available from: http://www.care.diabetesjournals.org/content/31/Supplement_1/S55.full . [Google Scholar]
- 2.World Health Organization. The Top Ten Causes of Death. Face Sheet. World Health Organization. 2014. [Last accessed on 2014 May 22]. Available from: http://www.who.int/mediacentre/factsheets/fs310/en/
- 3.India – International Diabetic Federation. [Last accessed on 2018 May 19]. Available from: http://www.idf.org/
- 4.Ramachandran A, Jali MV, Mohan V, Snehalatha C, Viswanathan M. High prevalence of diabetes in an urban population in South India. BMJ. 1988;297:587–90. doi: 10.1136/bmj.297.6648.587. [DOI] [PMC free article] [PubMed] [Google Scholar]
- 5.Ramachandran A, Snehalatha C, Dharmaraj D, Viswanathan M. Prevalence of glucose intolerance in Asian Indians. Urban-rural difference and significance of upper body adiposity. Diabetes Care. 1992;15:1348–55. doi: 10.2337/diacare.15.10.1348. [DOI] [PubMed] [Google Scholar]
- 6.Ramaiya KL, Kodali VR, Alberti KG. Epidemiology of diabetes in Asians of the Indian subcontinent. Diabetes Metab Rev. 1990;6:125–46. doi: 10.1002/dmr.5610060302. [DOI] [PubMed] [Google Scholar]
- 7.Ramachandran A, Snehalatha C, Latha E, Vijay V, Viswanathan M. Rising prevalence of NIDDM in an urban population in India. Diabetologia. 1997;40:232–7. doi: 10.1007/s001250050668. [DOI] [PubMed] [Google Scholar]
- 8.Mohan V, Madan Z, Jha R, Deepa R, Pradeepa R. Diabetes – Social and economic perspectives in the new millennium – Review. Int J Diabetes Dev Ctries. 2004;24:29–35. [Google Scholar]
- 9.Robinson R. Economic evaluation and health care. What does it mean? BMJ. 1993;307:670–3. doi: 10.1136/bmj.307.6905.670. [DOI] [PMC free article] [PubMed] [Google Scholar]
- 10.Drummond MF. To understand an economic evaluation – Part A. Can Med Assoc J. 1984;130:1428–34. [PMC free article] [PubMed] [Google Scholar]
- 11.Byford S, Torgerson DJ, Raftery J. Economic note: Cost of illness studies. BMJ. 2000;320:1335. doi: 10.1136/bmj.320.7245.1335. [DOI] [PMC free article] [PubMed] [Google Scholar]
- 12.Ramachandran A, Ramachandran S, Snehalatha C, Augustine C, Murugesan N, Viswanathan V, et al. Increasing expenditure on health care incurred by diabetic subjects in a developing country: A study from India. Diabetes Care. 2007;30:252–6. doi: 10.2337/dc06-0144. [DOI] [PubMed] [Google Scholar]
- 13.Rayappa PH, Raju KN, Kapur A, Bjork S, Sylvist C, Dilipkumar KM. Economic costs of diabetes care. The Bangalore urban district diabetes study. [Last accessed on 2012 Aug 25];Int Diabetes Dev Ctries. 1999 19:87–96. Available from: http://www.diabetes.org.in/journal/1999_july-sept/article1.pdf . [Google Scholar]
- 14.Kapur A, Björk S, Nair J, Kelkar S, Ramachandran A. Cost of diabetes in India. Diabetes Voice. 2004;49:18–21. [Google Scholar]
- 15.Rao CR, Kamath VG, Shetty A, Kamath A. A study on the prevalence of type 2 diabetes in coastal Karnataka. Int J Diabetes Dev Ctries. 2010;30:80–5. doi: 10.4103/0973-3930.62597. [DOI] [PMC free article] [PubMed] [Google Scholar]
- 16.Muninarayana C, Balachandra G, Hiremath SG, Iyengar K, Anil NS. Prevalence and awareness regarding diabetes mellitus in rural Tamaka, Kolar. Int J Diabetes Dev Ctries. 2010;30:18–21. doi: 10.4103/0973-3930.60005. [DOI] [PMC free article] [PubMed] [Google Scholar]
- 17.Karnataka Population Census. [Last accessed on 2014 Aug 14]. Available from: http://www.census2011.co.in/census/state/karnataka.html .
- 18.Ramesh Masthi NR, Gangaboraiah, Kulkarni P. An exploratory study on socio economic status scales in a rural and urban setting. J Family Med Prim Care. 2013;2:69–73. doi: 10.4103/2249-4863.109952. [DOI] [PMC free article] [PubMed] [Google Scholar]
- 19.Dudala SR, Arlappa N. An updated Prasad's socioeconomic status classification for 2013. Int J Res Dev Health. 2013;1:26–9. [Google Scholar]
- 20.Ramachandran A, Snehalatha C, Kapur A, Vijay V, Mohan V, Das AK, et al. High prevalence of diabetes and impaired glucose tolerance in India: National urban diabetes survey. Diabetologia. 2001;44:1094–101. doi: 10.1007/s001250100627. [DOI] [PubMed] [Google Scholar]
- 21.Ramachandran A, Snehalatha C, Baskar AD, Mary S, Kumar CK, Selvam S, et al. Temporal changes in prevalence of diabetes and impaired glucose tolerance associated with lifestyle transition occurring in the rural population in India. Diabetologia. 2004;47:860–5. doi: 10.1007/s00125-004-1387-6. [DOI] [PubMed] [Google Scholar]
- 22.Kapur A. Economic analysis of diabetes care. Indian J Med Res. 2007;125:473–82. [PubMed] [Google Scholar]