

Abstract
Since antiquity, humans have used body fluids like saliva, urine and sweat to diagnosis diseases. The amount, color and smell of body fluids are still used in many traditional medical practices to evaluate an illness and make a diagnosis. The development and application of analytical methods for the detailed analysis of body fluids has led to the discovery of numerous disease biomarkers. Recently, mass spectrometry (MS), nuclear magnetic resonance spectroscopy (NMR), and multivariate statistical techniques have been incorporated into a multidisciplinary approach to profile changes in small molecules associated with the onset and progression of human diseases. The goal of these efforts is to identify metabolites that are uniquely correlated with a specific human disease in order to accurately diagnose and treat the malady. In this review we will discuss recent developments in sample preparation, experimental techniques, the identification and quantification of metabolites, and the chemometric tools used to search for biomarkers of human diseases using NMR.
Keywords: Metabolomics, biomarkers, NMR, Multivariate Statistics
INTRODUCTION
Anthropological and folk medical practices have revealed that humans have used body fluids for the diagnosis of disease since antiquity.[1] Hippocrates’s theory of disease postulates an imbalance between the four humors of the body: phlegm, blood, black bile and yellow bile.[2] Thus, early medical treatments and diagnosis were based on attempts to understand these humors. Before the 18th century, chemistry was not involved in supporting a physician’s decision or providing a rationalization in a disease diagnoses. Instead, medics of the era used their senses to analyze urine and other biofluids.[3] Examining body fluids by color, taste, amount, and smell were accepted practices for diagnosing diseases and treating patients in folk, ancient and medieval medicine.[1, 4] But in the 16th and 17th century, there were reported successes with precipitating proteins from urine using vinegar and heat treatments. Similarly, in the late 18th century, the chemical analysis of urine was able to disentangle the mystery between the sweetness of urine and a diabetic patient.[5] By the 19th century, chemistry was a vital element in both understanding human physiology and diagnosing diseases.[6] The concept of searching for chemicals to understand human diseases has been enhanced by technology advancements for the analysis of hundreds of metabolites from small quantities of body fluids.[7]
Metabolites are end products of gene expression, and are a direct result of enzymatic and protein activity. Thus, metabolites are more proximal to a phenotype or disease than either genetic or proteomics information.[8, 9] Genetics provides a fingerprint of hereditary information, where many diseases are associated with genetic defects. But not all human diseases are a result of an inherited genetic disorder or mutations at the gene level.[10] Importantly, the presence of a genetic mutation does not necessitate the development of the associated disease or predict all possible occurrences of the disease. For example, only five percent of breast cancer patients carry the BRCA mutation, where carrying a harmful BRCA1 or BRCA2 mutation results in a five-fold increase in the likelihood of developing breast cancer.[11] Other genetic modifiers and environmental factors also contribute to the progression of the disease.[12] Clearly, the disconnect between carrying a harmful BRCA mutation and definitively developing breast cancer significantly complicates decisions regarding preventative treatment.[13, 14] Essentially, the presence of a genetic mutation does not necessarily lead to a change in the biological activity of the gene product. As an alternative and complementary approach, proteomics studies the functional and structural elements of gene products, mainly the expression of proteins and enzymes.[15, 16] The up- or down-regulation of proteins has been correlated with the development or progression of a disease.[17] Similarly, posttranslational modifications of proteins have also been shown to be associated with different diseases.[18–20] Unlike genomics, only a small-fraction of the proteome is observed. But similar to genomics, a modulation in a protein’s expression or modification does not necessarily correlate with a perturbation in its biological activity. Furthermore, it is challenging to identify the specific protein(s) that are responsible for the disease state. It is difficult to distinguish between biologically relevant proteins and proteins indirectly affected through a complex biological network. For example, hundreds of proteins have been identified in proteomic studies of pancreatic cell lines.[21–25] Clearly, all those proteins are not relevant to cancer. Also, there are serious concerns with mistaken protein identification and inconsistencies between proteomics studies.[26, 27]
Metabolomics is the measurement and analysis of metabolites, such as amino acids, carbohydrates and lipids, from biofluids, plants and cellular extracts.[28, 29] The underlying premise for the field of metabolomics was first described by Pauling in his 1971 publication using gas chromatography to analyze urine and breath metabolites.[30] Metabolic samples have been obtained from a diversity of organisms under various environmental conditions that includes drug treatments and diseases. Correspondingly, studying metabolic profiles of living cells has wide applications in many scientific disciplines and systems biology.[31–34] Metabolomics has been used to understand the pathology of disease,[35] to diagnose disease,[36] to monitor diet,[37] and to investigate host vector relationship.[38] The unique value of metabolomics to drug discovery and disease diagnoses is based on the fact that changes in the metabolome are a direct outcome from perturbations in cellular activity.
Mass spectrometry (MS)[39] and nuclear magnetic resonance spectroscopy (NMR)[28] are the primary analytical techniques used in metabolomics. The two techniques have inherently distinct capabilities and limitations, making them ideally complementary.[40, 41] MS is significantly more sensitive than NMR and covers a wider diversity of the metabolome. But, because of the limited molecular-weight dispersion of metabolites, MS requires chromatographic separations that may bias any analysis. Also, there is a significant uncertainty in a specific metabolite’s ability to generate a detectable molecular ion peak by MS. This also makes quantitation by MS challenging. Conversely, NMR requires minimal sample handling, allows for easy quantitative analysis of metabolite concentrations, and provides redundant means of metabolite identification. Most metabolites have multiple characteristic NMR resonances and coupling patterns, where peak intensity is directly proportional to concentration. Fundamentally, MS and NMR provide a distinct spectral analysis of the same sample. The complementary nature of MS and NMR has been demonstrated by a number of metabolomic studies using both techniques.[42–46]
The growing interest in NMR based metabolomics was initiated by Nicolson’s extensive drug activity and toxicity research using NMR analysis of body fluids.[47, 48] NMR metabolomics is currently being used to search for disease biomarkers for infectious diseases like tuberculosis,[49] malaria,[50] and pneumonia;[51] and for cancer,[52] Parkinson disease,[53] neurological disorders;[54] and numerous other human diseases. NMR metabolomics is being used to understand the underlying causes of these diseases, and to identify chemical markers to quickly and readily diagnose the disease. This review will discuss recent developments in sample preparation, experimental techniques, the identification and quantification of metabolites, and the chemometric tools used to search for biomarkers of human disease using NMR.
NMR metabolomics sample preparation
NMR metabolomics has been used to study a variety of different types of biofluids that include plasma,[55] serum,[56] cerebrospinal fluid,[57] pus,[58] saliva,[59] feces,[60] cervicovaginal secretions,[61] and urine.[62] NMR has also been used to analyze intact tissue samples.[63–66] One of the major advantages of NMR as a tool for metabolomics is its simplicity in sample preparation. Typically, a minimum of 0.1 to 0.5 mL of the biofluid is required to prepare an NMR sample. The most common protocol for preparing an NMR sample from biofluids is to simply add an aliquot of a deuterated buffer to adjust the sample to a common pH value (Table 1).[67] NMR chemical shifts are sensitive to both pH and temperature changes, which would result in a systematic bias in the data analysis if different samples had different pH values. The deuterated buffer also provides a necessary lock signal.
Table 1:
Biofluid Sample Preparationa
| Biofluid | Required sample handling |
|---|---|
| Urine | Add deuterated phosphate buffer to 0.2–0.4 mL urine |
| Blood/plasma/serum | Add deuterium oxide (to lock) Add acetonitrile (for protein precipitation) Add methanol/chloroform extraction (for lipid extraction) |
| Cerebrospinal fluid | Add deuterium oxide to 0.5 mL of CSF |
| Expressed prostatic secretions | Add deuterium oxide to 0.03 – 0.10 mL of EPS |
| Bile | Add deuterium methanol to 0.5 mL of bile |
| Bronchoalveolar lavage fluid | Add deuterium oxide to 0.5 mL of BALF |
| Tissue | Add 0.01 mL of deuterium oxide to 3–10 g of tissue in MAS rotor Add perchloric acid extraction on 20–200 g frozen tissue Add methanol/chloroform extraction to 20–200 g frozen tissue |
Adapted from Spratlin et al. (2009)
Storage and handling of biofluid samples affect metabolite stability. Correspondingly, storing urine samples at −80°C has been shown to maximize metabolite stability.[68, 69] A diurnal variation has been observed for both urine and plasma metabolites.[70–72] Preferably, urine samples are collected in the morning (8-hour samples).[73] The urine is typically more concentrated and contains more metabolites due to the length of time in the bladder. Urine samples are also collected midstream to avoid cellular and microbe contaminants. Preservatives such as NaN3 and NaF are commonly added to urine samples to prevent bacterial growth.[74–76] The filtration or centrifugation of urine samples is also recommended to prevent bacterial growth.[68] Similarly, plasma samples are preserved by the addition of EDTA or heparin as anti-coagulants.[77] The addition of preservatives can also be applied to metabolomic samples collected from infected tissues. The stability of the biofluid sample and, correspondingly, the quality and value of the NMR spectrum would be detrimentally affected by bacterial growth, especially during long data acquisition times. The bacteria would generate extracellular secretions and utilize available metabolites, changing the state of the sample as a function of time. Blood, serum, and plasma samples contain proteins, in addition to the small molecular-weight metabolites. The proteins need to be removed prior to analysis, which is typically done by the addition of a precipitant or an extractant, such as methanol or acetonitrile, followed by exchange back into an aqueous buffer. Additionally, chemical reactions such as redox reactions and enzymatic degradations are source of metabolite instability in biological samples. Additionally, some metabolites are simply not stable.[78, 79] Short sample preparation times and long term storage at −80°C are recommended to maximize the stability of samples for metabolomics study. [80] Another concern is the external influence on the metabolome due to differences in diet. Correspondingly, diet-standardization, fasting or time of sample collection may minimize variability between subjects due to diet differences.[81, 82] Internal NMR standards, such as 11.1 μM of 3-(trimethylsilyl)propionic acid-2,2,3,3-d4 (TMSP-d4), are routinely added to metabolomic samples to provide for both a chemical shift and concentration reference.[83] The TMSP methyl NMR resonance is referenced to 0.00 ppm and its relative peak integration is set to 9-times the TMSP concentration, since the NMR peak corresponds to 3 methyl groups or a total of 9 hydrogen nuclei.
The goal of applying NMR metabolomics to the analysis of biofluids is to identify potential biomarkers – metabolites correlated with a specific disease. Importantly, a reliable comparative analysis between biofluid samples requires consistency in sample preparation. The observed differences should be biologically relevant as opposed to an artifact or bias from handling the samples. In the case of biofluids, a significant challenge is maintaining a consistency in the source of the biological samples. For patient and animal studies, it is critical to have a similar diet, to be exposed to a common environment, to maintain similar physical activities, and to select participants with comparable medical histories. Numerous factors, such as age, sex, ethnicity, preexisting health conditions, and lifestyle may perturb the metabolome and complicate the identification of biomarkers. For example, a biomarker observed to be correlated with a neurological disease may result from an associated inflammatory response.[84]
NMR metabolomics experiments
One dimensional 1H NMR methods.
One-dimensional (1D) 1H NMR experiments are routinely used for metabolite biomarker research (Figure 1).[85] These experiments are generally fast, robust, easy to implement, and ideally suited for high-throughput screening.[86] The information obtained from 1D 1H NMR experiments is used for metabolite identification and for the evaluation of global alterations in metabolites between different groups or classes.[87, 88] 1D 1H NMR experiments provide a global snap-shot of the state of the metabolome, but only the most abundant metabolites are observed (> 1 to 10 μM). Also, metabolite identification is challenging because of the low chemical shift dispersion and high peak overlap. Biofluids are complex heterogeneous mixtures that contain hundreds of metabolites resulting in an NMR spectrum that is very crowded and suffers from extensive peak overlap, making it difficult to differentiate between multiple peaks. But importantly, the NMR spectrum is also used for quantitative analysis of metabolites by comparing the integral of metabolite peaks with the integral from the internal standard (TMSP).[89]
Figure 1.
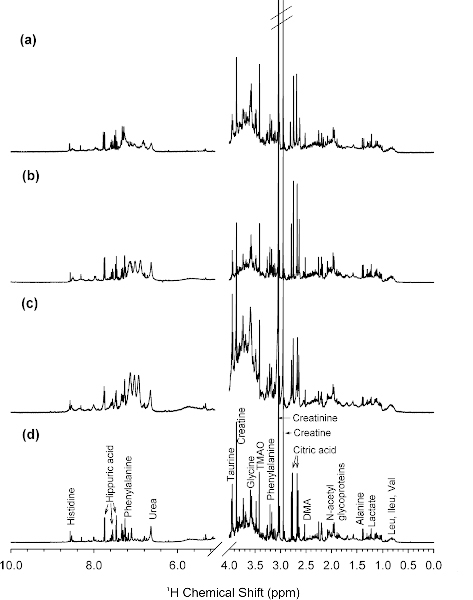
1H NMR spectra of a representative baseline urine sample acquired at (a) 250, (b) 400, (c) 500, and (d) 800 MHz. Key: DMA, dimethylamine, Leu, leucine; Ileu, Isoleucine; Val, valine; TMAO, trimethylamine-N-oxide. (Reprinted with permission from reference,[94] Copyright 2007 by American Chemical Society)
The Madison Metabolomics Consortium Database,[90] the BioMagResBank,[91] and the Human Metabolome Database (HMDB)[92] are routinely used to assign metabolites to NMR spectra. The databases contain experimental NMR spectra for hundreds of known metabolites and provide simple user interfaces to match experimental chemical shifts from biofluids data against the spectral database.[93] Typically, 1H and 13C chemical shift tolerances of 0.05 ppm and 0.50 ppm, respectively, are used to identify a match between the experimental and database chemical shifts. Simply, a list of NMR chemical shifts is uploaded to HMDB (http://www.hmdb.ca/), which provides a list of potential metabolites with the number of matching NMR resonances. Generally, each metabolite chemical structure contains multiple hydrogen atoms resulting in multiple NMR resonances. Ideally, each NMR resonance for a metabolite should be present in the experimental spectrum. In practice, only a subset of the NMR resonances is observed because of severe peak overlap and low resolution. Thus, the confidence level in a correct metabolite assignment is dependent on the number of matching NMR resonances.
The resolution and sensitivity of the 1D 1H NMR spectrum improves as a function of magnetic field strength. Thus, the quality of NMR metabolomics experiments has benefitted from the availability of 800 to 950 MHz NMR spectrometers (Figure 1).[94] In addition to the use of high-field NMR instruments, the application of spectral simplification techniques has resulted in improved NMR spectra with better peak separation.[95] Metabolites have relatively long T2 relaxation times and correspondingly narrow line-widths. Conversely, proteins and other biomolecules have relatively broad peaks and short T2s. This significant difference in relaxation times provides an opportunity to manipulate the NMR spectrum to select for small molecular-weight metabolites against a background of protein NMR signals. NMR pulse sequences have been implemented that filter the spectrum based on T2 relaxation times.[96] Diaz et al. (2011) used NMR to search for metabolic biomarkers from urine and plasma that are associated with prenatal disorders (Figure 2).[97] An improved separation in metabolite signals from the protein background was achieved by using a T2 edited experiment. This is accomplished by simply incorporating a Carr-Purcell or Carr-Purcell-Meiboom-Gill (CPMG) sequence into a standard 1D pulse sequence. During this additional [τ−180°-τ]n cycle, NMR peak intensities are decaying proportional to their T2 relaxation times. The pulse sequence is simply tuned to the minimal number of cycles (n) required to allow the protein NMR resonances to decay to zero with a minimal impact on the intensity of the metabolite signals. Figure 2 illustrates the metabolites obscured by the protein background using a standard 1D 1H pulse sequence. These metabolites are clearly visible in the T2 edited NMR spectra. The accompanying diffusion edited spectrum has the reverse effect compared to the T2 edited spectrum; it filters out molecules with rapid diffusion rates. Correspondingly, the diffusion edited spectra attenuated the NMR resonances from the small molecular weight metabolites and emphasizes the protein background peaks.
Figure 2.
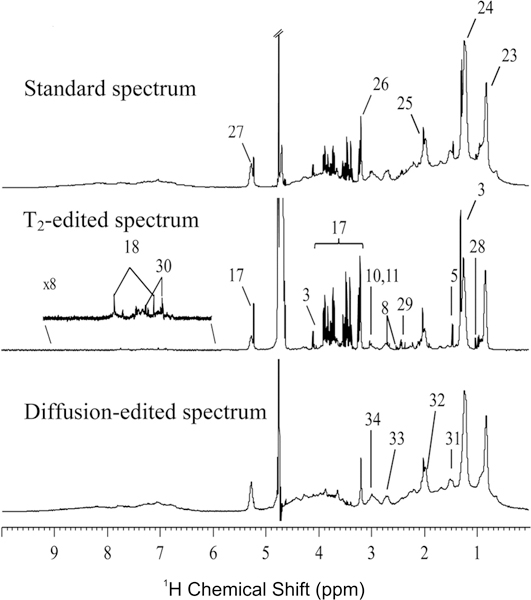
1H NMR spectra (500 MHz) recorded for 2nd trimester urine and plasma of a healthy pregnant woman: blood plasma, standard 1D (top), T2-edited (middle) and diffusion-edited (bottom) spectrum. Legend: (1) β-hydroxybutyrate, (2) 3-aminoisobutyrate, (3) lactate, (4) threonine, (5) alanine, (6) γ-aminobutyrate (GABA), (7) succinate, (8) citrate, (9) dimethylamine, (10) creatine, (11) creatinine, (12) trimethylamine N-oxide (TMAO), (13) betaine, (14) glycine, (15) guadinoacetate, (16) trigonelline, (17) glucose, (18) histidine, (19) phenylacetylglycine, (20) hippurate, (21) formate, (22) N-methyl-nicotinamide, (23) lipid CH3, (24) lipid (CH2)n, (25), glycoproteins (26) choline, (27) lipid CH=CH, (28) valine, (29) glutamine, (30) tyrosine, (31) lipid CH2CH2CO, (32) lipid CH2CH=CH, (33) lipid CH=CHCH2CH=CH, (34) albumin lysyl εCH2. (Reprinted with permission from reference,[97] Copyright 2011 by American Chemical Society).
Two dimension NMR methods.
1D 1H NMR spectra obtained from biofluids are very crowded with extensive spectral overlap. As a result, it is often difficult to unambiguously assign NMR resonances to a specific metabolite. Instead, it is common to identify multiple metabolites that are consistent with a given NMR peak. Two dimensional (2D) NMR experiments overcome this problem by significantly increasing the resolution and dispersing the peaks into two-dimensions (Figure 3).[98, 99] 2D 1H-1H-TOCSY (TOtal Correlation SpectroscopY) and 2D 1H-13C HSQC (Heteronuclear Single-Quantum Correlation) are the two most commonly used 2D NMR methods in metabolomics. The 2D 1H-13C HSQC experiment correlates the 1H and 13C chemical shifts for each C-H pair in a given structure. Similarly, the 2D 1H-1H-TOCSY experiment correlates the entire network of J-coupled hydrogen nuclei in a metabolite. For example, the CαH 1H chemical shift for valine will be correlated with the 1H chemical shifts for CβH, and the two CγH3 methyls. The dramatic improvement in peak separation along with the direct correlation of pairs of 1H or 1H-13C chemical shifts significantly increases the confidence in a correct metabolite assignment. However, 2D NMR experiments require significantly longer acquisitions times, upwards of hours per experiment, compared to < 10 minutes per 1D 1H NMR experiment.[100–102] Also, the 2D 1H −13C HSQC spectrum cannot be used for absolute quantitation of metabolite concentrations, but only for relative changes. This limitation arises because peak intensities are not only proportional to concentration, but are also modulated by J-coupling, T1 and T2 relaxation, imperfect pulse lengths, and recovery delays. It is impractical to correct for these parameters, since they vary between molecules and also atom type. Recently, a number of methods have been proposed to modify standard 2D HSQC pulse sequences to enable quantitative analysis of metabolite concentrations.[103–108] Hu et al. (2011) proposed the use of a time zero 2D 1H −13C HSQC experiment (Figure 4) to measure metabolite concentrations.[109] The time zero HSQC spectrum is back extrapolated from a series of HSQC spectra collected with incremental repetition times, the time between the first 1H excitation pulse and the beginning of data acquisition. Essentially, the HSQC spectrum is collected with either one, two or three copies of the standard core HSQC pulse sequence. Peak intensity decreases proportional to the repetition time (Figure 4b). At time zero, metabolite concentrations are proportional to peak intensities since peak attenuation due to J-coupling, relaxation, etc. are time-dependent and have been effectively removed.
Figure 3.
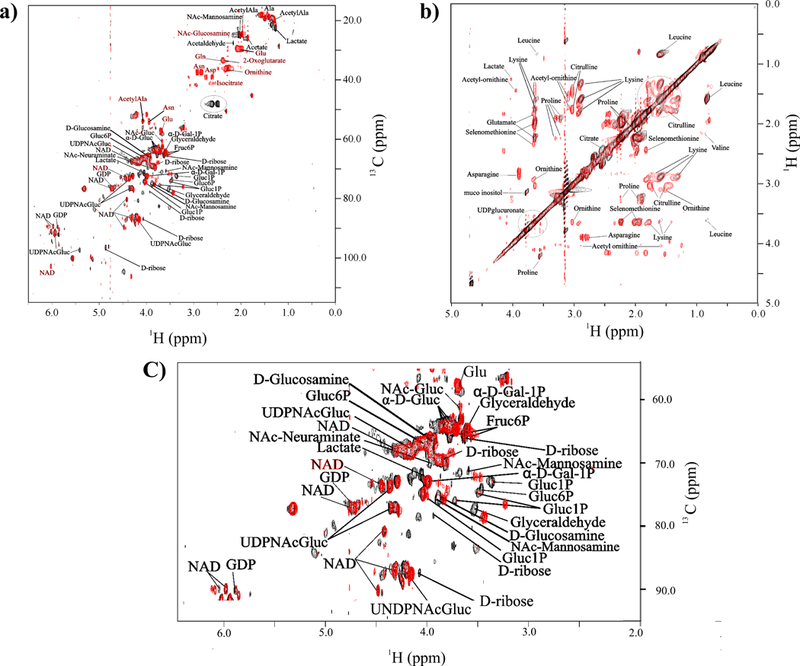
Overlay of (a) 2D 1H-13C HSQC spectra and (b) 2D 1H-1H TOCSY spectra comparing wild-type S. epidermidis strain 1457 (red) and aconitase mutant strain 1457-acnA::tetM (black) grown for 6 h in standard tryptic soy broth media augmented with 0.25% 13C-glucose. NMR resonances corresponding to specific metabolites are labeled, where citrate is circled. (c) Expanded view of the crowded region of the 2D 1H-13C HSQC spectra in (a). (Reprinted with permission from reference,[120] Copyright 2011 by American Chemical Society).
Figure 4.
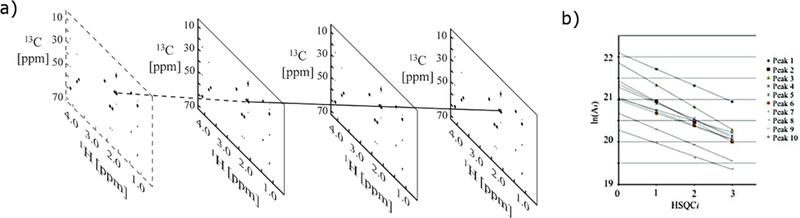
(a) Shown are examples of HSQC1, HSQC2, and HSQC3 spectra following Fourier transformation to yield frequency domain spectra. Peak intensities in the virtual HSQC0 spectrum (bordered by the dashed line) are derived from linear ln extrapolation of the peak intensities of the corresponding peaks in the HSQC1, HSQC2, and HSQC3 spectra. (b) Extrapolation of the 500 MHz 2D HSQCi (i = 1, 2, 3) peak intensities from integrated peak volumes (Ai) to yield A0 values. (Reprinted with permission from reference,[109] Copyright 2011 by American Chemical Society).
Chemometrics for biomarker identification
Multivariate statistical methods are integral to the analysis of NMR metabolomics data.[110] Multivariate statistics provide a clear interpretation of the global alteration in the metabolome resulting from disease, environmental stress, nutrition, or toxins. The analysis is not limited to a few metabolites or specific metabolic pathways, but captures the overall impact on the system from the external factors. A 1D 1H NMR spectrum is a complex multivariable data set consisting of upwards of 32K of chemical shifts and intensities. Multivariate statistical techniques reduce the complexity of the NMR data set and present the information in a simple and easily interpreted format. Typically, the NMR spectrum is reduced to a single data point in a scores plot. Both 1D and 2D NMR spectra have been analyzed using multivariate statistical techniques.[111] Multivariate statistical methods are categorized as either supervised or unsupervised. Supervised methods introduce sample classes, while unsupervised methods are based strictly on inherent variations in the data. Principal component analysis (PCA) is a widely-used unsupervised method for the analysis of NMR metabolomics data.[112] More recently, Orthogonal Partial Least Square Discriminant Analysis (OPLS-DA), a supervised method, has been growing in popularity as an approach to interpret NMR spectra for biomarker identification.[113]
Data pre-processing is a vital step in the NMR metabolomics protocol. Pre-processing of the NMR spectrum includes data reduction (binning),[114, 115] scaling,[116] and the exclusion of noise[117] and solvent regions known to bias the analysis. After phase correction to produce pure absorption line shapes and baseline correction of the 1D 1H NMR spectrum, the NMR spectrum is divided into uniform bins with a chemical shift range of 0.01 to 0.04 ppm[114] or by using intelligent bucketing (ACD Labs, Toronto, Canada) that uses variable bin sizes to avoid the splitting of peaks between bins.[115] The numerical value within each bin is the integral of the corresponding spectral region. NMR spectra are binned in order to minimize effects from minor and random differences in chemical shifts, phasing, peak shape, baseline, etc. that are inevitable when dealing with replicate biological samples. Similarly, there is a significant and inherent variability in the quality and signal-to-noise of NMR spectra obtained from a collection of biological samples, such as biofluids. It is simply impossible and unreasonable to expect uniformity in biofluid samples obtained from multiple patients, animals or tissues. As a consequence, the NMR spectra needs to be normalized to eliminate or minimize variability in signal-to-noise due to overall volume or concentration differences between each sample.
Triba et al. (2010) used the total sum of the bins for each spectrum as a scaling factor.[118] Simply, the value of each individual bin was divided by the sum of all the bins. This takes into account that variations in the spectral intensity due to different number of cells per sample. Pareto and autoscaling methods are alternative approaches to normalizing NMR spectra to variations in signal intensity.[119] For autoscaling, the NMR bins are mean centered and normalized by the standard deviation of the bins (eqn. 1)
| (1) |
where is the mean of the NMR integrals, σ is the standard deviation of the NMR integrals, and is the integral associated with bin i. In Pareto scaling, each bin is still mean centered, but normalization is accomplished through the square-root of the standard deviation.
| (2) |
It is important to note, that each approach to data pre-treatment can significantly impact the analysis by emphasizing different aspects of the NMR metabolomics data.
After pre-treatment, the table of NMR integrals (bins) is then subjected to multivariate statistical analysis. PCA is the most common multivariate statistical approach currently applied to NMR metabolomics data. PCA is an unbiased approach and, correspondingly, the information obtained from PCA is a direct result of any correlated structure to the data. PCA projects the multivariable NMR data into simple visual format. The table of NMR integrals is transformed into scores and loadings plots.[112] The PCA scores plot summarizes global similarities and differences between the NMR spectra, where each NMR spectrum is reduced to a single point. The coordinate axis in a PCA scores plot corresponds to the principal components (PC1, PC2, etc.), which represents the best-fit of each NMR spectrum to a series of orthogonal vectors (, , etc.) The first vector corresponds to the largest variation in the NMR data set, where each successive vector is in the direction of the next largest variation in the data set. Thus, the PCA scores plot captures the major differences between the NMR spectra resulting from changes in the metabolome. Correspondingly, NMR spectra will cluster in the PCA scores plot based on their relative differences or similarities, which is based on metabolite compositions and concentrations. The PCA loadings plot determines the relative contribution of each NMR bin (chemical shift, metabolite) to the principal components. In essence, the PCA loadings plot identifies the metabolites that primarily contribute to the class separation in the PCA scores plot (Figure 5b).
Figure 5.
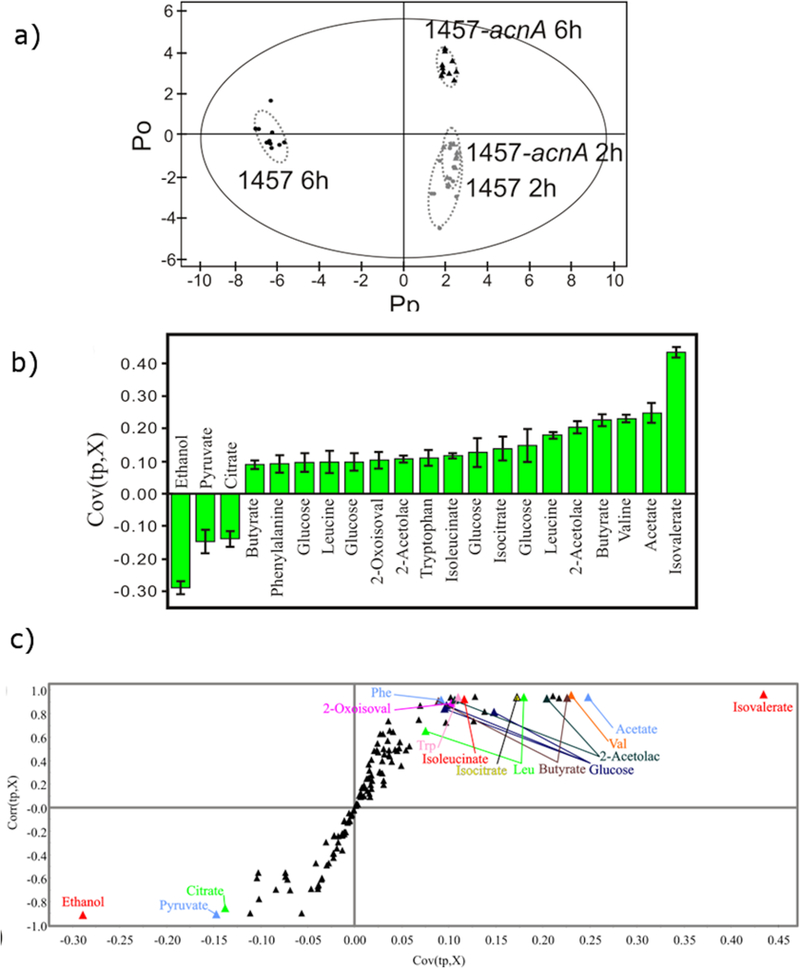
(a) 2D OPLS-DA scores plot comparing 2 h growth of wild-type S. epidermidis 1457 ( ), 2 h growth of aconitase mutant strain 1457-acnA::tetM (
 ), 6 h growth of wild-type S. epidermidis 1457 (
 ), and 6 h growth of aconitase mutant strain 1457-acnA::tetM (
 ). The ellipses correspond to the 95% confidence limits from a normal distribution for each cluster. For the OPLS-DA scores plot, the 6 h growth of wild-type S. epidermidis 1457 () was designated the control class and the remainder of the cells were designated as treated. The OPLS-DA used 1 predictive component and 3 orthogonal components to yield a R2X of 0.788, R2Y of 0.992 and Q2 of 0.992. (b) OPLS-DA S-plot comparing the mutant strain 1457-acnA::tetM grown for 2 hours and 6 hours. The two conditions are shown to be separated along the PC2 axis in (a). The metabolites identified are associated with variations in the utilization of glucose for cell growth. (c) OPLS-DA loading plot comparing the mutant strain 1457-acnA::tetM grown for 2 hours and 6 hours. Negative values indicate a decrease in peak intensity when comparing the wild type to the mutant, while positive values indicate an increase in peak intensity. (Reprinted with permission from reference,[120] Copyright 2011 by American Chemical Society).
The identification of metabolite biomarkers is dependent on determining the latent variables responsible for class separation (e.g., healthy vs. disease). PCA identifies the largest variations in the NMR data, but the latent variables (fundamental relationship) responsible for the class separation many not be in the direction of the largest variation.[113] Instead, OPLS-DA is preferred for identifying metabolite biomarkers (Figure 5a).[120] OPLS-DA is a regression model that reflects the correlation between multivariate data and dependent variables with class information. In OPLS-DA, a single component is used as a predictor for the class, where the other components are variations orthogonal to the predictive component.[121] In other words, the predictive component describes the between class separation and the orthogonal components describe the within class separation. OPLS-DA emphasizes between class separations and reduces within class separation. As a result, an OPLS-DA scores plot will have tighter clusters with a larger separation relative to PCA. PCA data can be simply changed to OPLS-DA by including a value that discriminates between the classes as a Y direction vector.[122] Typically, a two-class system is used where one data set is designated the control (Y = 0) and the remaining data sets are designated as treated (Y = 1). For PCA and OPLS-DA, the quality of the model is assessed by the measure of goodness of fit (R2) and quality assessment score (Q2).[123] A good model has R2 values ≥ 0.5 (range of 0 to 1) and is conceptually similar to simple linear regressions. An ideal value for Q2 is one, where a typical value for a biological model is ≥ 0.4. OPLS-DA is a supervised method and the model needs to be validated since over-fitting the data is a common concern. The leave-one-out technique is commonly used to validate OPLS-DA models, where a sub-set of the NMR spectra are left out to calculate a model that is then used to predict the left out data.[124] The predicted data is compared to the original data, where Q2 determines the consistency between the two data sets and the reliability of the model.
Similar to a loadings plot, an S-plot can also be generated from the OPLS-DA model (Figure 5c). The S-plots identifies the NMR bins (chemical shifts, metabolites) that are correlated (X ≥ 0.10 and Y ≥ 0.8) or anti-correlated (X ≤ −0.10 and Y ≤ −0.80) with the class separation in the OPLS-DA scores plot (Figure 5a). The S-plot X and Y coordinates represents the correlation and reliability, respectively, of the NMR bins with the OPLS-DA model. NMR bins with the highest correlation and reliability fall in both extremes of the S-plot. These metabolites correspond to potential biomarkers.
Interpretation of PCA and OPLS-DA score plots are generally based on a visual inspection of the relative separation of class clusters. Assigning a statistical significance to this clustering pattern is fundamental to inferring an accurate biological relevance. Werth et al. (2010) introduced a new method to analyze PCA and OPLS-DA scores plots based on metabolic tree diagrams with associated bootstrap[125] numbers to quantify the statistical significance of the observed class clustering.[126] The technique is particularly valuable for the accurate analysis of complex datasets that contain multiple classes, where it may be very difficult to see distinct clustering patterns. Simply, the coordinates for the center of each cluster are used to measure a Euclidean distance between each pair of clusters to generate a standard distance matrix. The distance matrix is then used to create a tree diagram using a phylogenetic program such as PHYLIP (http://www.phylip.com).[127] The cluster centers are re-determined by randomly leaving out class members, resulting in a new distance matrix and tree diagram. The process is typically repeated 100 times, where a consensus tree is determined from the 100 individual trees. The bootstrap value is simply the number of times a node in the consensus tree was observed in the set of 100 tree diagrams, where bootstrap numbers less than 50 indicate a statistically insignificant node. Additionally, T2 hoteling is used to identify the 95% confidence interval for each cluster, which adds an additional quantitative approach to distinguish between class clusters. An OPLS-DA scores plot shown in Figure 6 contains ellipses that represent the 95% confidence interval that helps identify the major drug classes.[128, 129] The associated metabolomic tree diagram provides a detailed analysis of the antibiotic activity of fifteen drugs against TB. Specifically, the OPLS-DA scores plot and tree diagram indicate the drugs cluster based on their in vivo mechanism of action.[129]
Figure 6.
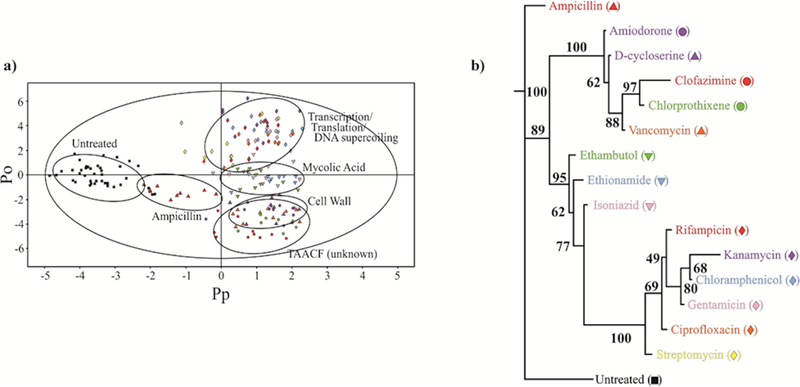
(a) 2D OPLS-DA scores plot demonstrating the clustering pattern for 12 antibiotics with known biological targets and three compounds of unknown in vivo activity: untreated M. smegmatis cells (black square), chloramphenicol (blue diamond), ciprofloxacin (orange diamond), gentamicin (pink diamond), kanamycin (lavender diamond), rifampicin (red diamond), streptomycin (yellow diamond), ethambutol (green down triangle), ethionamide (blue down triangle), isoniazid (pink down triangle), ampicillin (red up triangle), D-cycloserine (purple up triangle), vancomycin (orange up triangle), amiodorone (purple circle), chlorprothixene (green circle), and clofazimine (red circle) treated M. smegmatis cells. The ellipses correspond to the 95% confidence limits from a normal distribution for each cluster. The untreated M. smegmatis cells (black square) was designated the control class, and the remainder of the cells were designated as treated. The OPLS-DA used one predictive component and six orthogonal components to yield a R2X of 0.715, R2Y of 0.803, and Q2 of 0.671. (b) Metabolomics tree diagram determined from the OPLS-DA scores plot. The coloring scheme for each compound in the tree diagram correlates with the data point colors in the OPLS-DA scores plot. The bootstrap numbers for each node are indicated on the tree diagram. (Reprinted with permission from reference,[129] Copyright 2011 by American Chemical Society).
Recent applications of NMR for biomarker identification.
Lung cancer has a low 5-year survival rate of only 15% in the US and 10% in Europe. Early diagnosis is a key factor to increase patient survival, but, unfortunately, current diagnostic methods are inadequate. Carrola et al. (2010) utilized NMR metabolomics to analyze urine samples collected from lung cancer patients and healthy individuals. A 600 μL NMR sample was prepared by adding 60 μL of 1.5 M phosphate buffer (KH2PO4) that contains 0.1% TMSP-d4 to a 540 μL urine sample to obtain a uniform pH of 7.00 ± 0.02. The resulting 1D 1H NMR spectra indicated a distinct metabolic difference between lung cancer patients and healthy individuals (Figure 7). The application of PCA, PLS, and OPLS-DA multivariate statistical analysis resulted in an increasing separation between the two classes (Figure 8). A clear separation was only obtained using OPLS-DA. The impact of age, gender and smoking on the 2D scores clustering pattern was also examined. Interestingly, none of these factors were shown to have a significant impact on the analysis. The corresponding OPLS-DA loading plot was used to identify metabolites responsible for class separation. As a result, hippurate, trigonelline, β-hydroxyisovalerate, α-hydroxyisobutyrate, N-acetylglutamine, and creatinine were shown to have a statistically significant (P-value < 0.01) difference between healthy individuals and lung cancer patients.[130] NMR metabolomics has also been extensively used to study the pathology of cancer cell lines to investigate system-wide process such as transformation, progression, proliferation and metastasis.[131] This effort may lead to the identification of new biomarkers and therapies. For example, MacKinnon et al. (2012) describes the metabolomic analysis of an androgen-dependent prostate cancer cell line (LnCAP) using NMR and mass spectrometry.[132] Upon treating LnCAP cells with methyltrienolone (an androgen receptor agonist), a metabolic signature characteristic of aggressive prostate cancer was observed. Specifically, a decrease in myo-inositol, altered glutathione levels, perturbation in amino-acid levels, a decreased level of methionine, a high level of phosphocholine, and an increase in the phosphocholine/glycerophosphocholine ratio were all observed. These potential biomarkers could be used to guide clinical treatments and avoid premature termination of androgen ablation therapy that may lead to the unfortunate induction of an aggressive and incurable form of prostate cancer.
Figure 7.
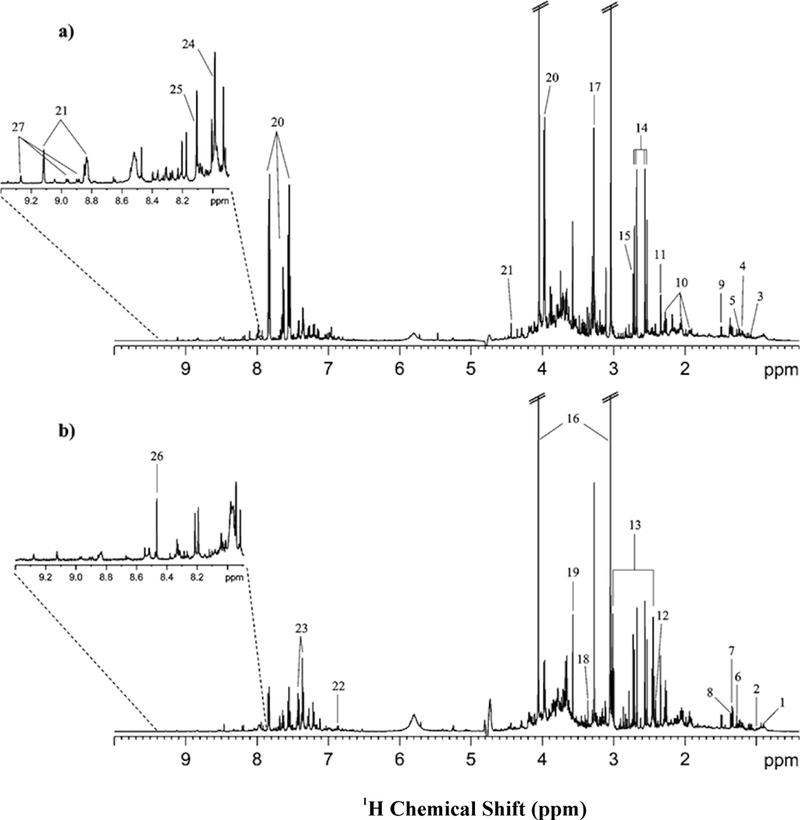
The 500 MHz 1H NMR spectra of urine from (a) a healthy (control) subject, and (b) a lung cancer patient. Signal assignment: 1, α-hydroxybutyrate; 2, valine; 3, isobutyrate; 4, β-aminoisobutyrate; 5, methyl-β-hydroxybutyrate; 6, β-hydroxyisovalerate; 7, lactic acid and threonine; 8, α-hydroxyisobutyrate; 9, alanine; 10, N-acetylglutamine; 11, pyruvate; 12, succinate; 13, α-ketoglutarate; 14, citrate; 15, dimethylamine; 16, creatinine; 17, trimethylamine-N-oxide and betaine; 18, scyllo-inositol; 19, glycine; 20, hippurate; 21, trigonelline; 22, p-hydroxyphenylacetate; 23, phenylacetylglycine; 24, histidine; 25, 3-methylhistidine; 26, formate; 27, trigonellinamide. Reprinted with permission from reference,[130] (Copyright 2011 by American Chemical Society)
Figure 8.
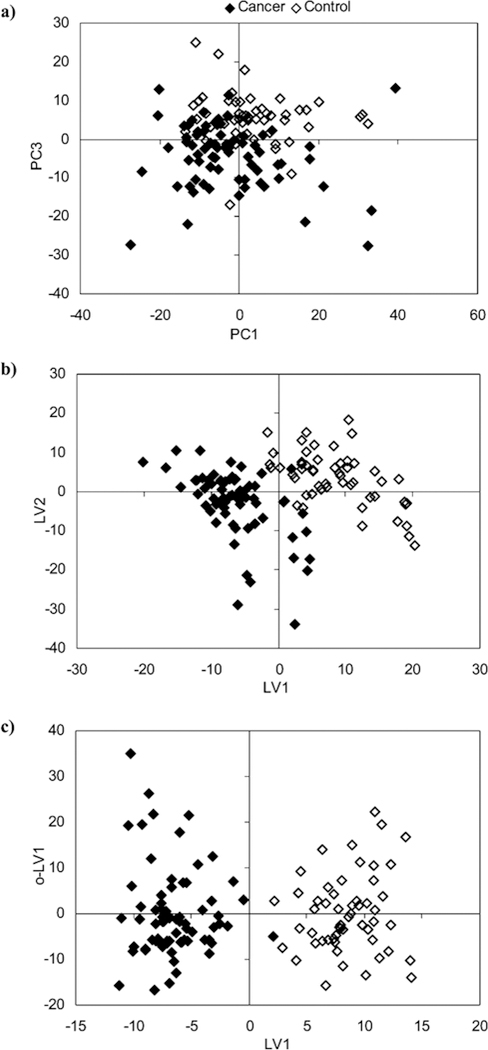
Scores scatter plots (a) PC1 vs PC3, (b) LV1 vs LV2, (c) LV1 vs o-LV1 resulting from applying, respectively, PCA, PLS-DA, and OPLS-DA to the 1H NMR spectra of urine (δ0.40 to 10.0, excluding 4.55−6.05) from healthy controls (open symbols) and lung cancer patients (full symbols). Reprinted with permission from reference,[130] (Copyright 2011 by American Chemical Society)
Cardio vascular diseases (CVD) are one of the leading causes of death in the US and the rest of the developed world. Predicting the risk of cardio vascular diseases is an important element of a preventive medical strategy. Bernini et al. (2011) conducted an NMR based metabolomics study to identify biomarkers associated with CVD risk in healthy individuals. After a rigorous analysis of 864 plasma samples, a similar CVD risk assessment was obtained relative to traditional clinical methods. In effect, changes in the metabolome, as determined by NMR, correlated with standard CVD risk factors such as high cholesterol, triglycerides, LDL and HDL. In fact, new metabolite markers, such as 3-hydroxybutyrate, α-ketoglutarate, threonine, and dimethylglycine, were identified in addition to these commonly known risk markers for CVD. The NMR samples were prepared by simply mixing 300 μL of sodium phosphate buffer with 300 μL of a plasma sample. Standard 1D 1H NMR spectra, CPMG diffusion edited spectra and 1D-NOESY spectra were collected for each plasma sample. The primary goal of this diverse set of NMR experiments was to obtain an accurate analysis of known CVD risk factor metabolites to establish a reliable correlation between standard clinical analysis and the NMR results. Furthermore, the statistical analysis was focused on identifying a small set of metabolites that are highly reliable (P-value ≤ 0.0001) predictors of CVD risk. This extensive statistical approach enabled the authors to present a CVD risk model based on differently activated metabolic pathways (Figure 9).[133] The high risk and low risk pathways are interconnected, where the metabolome of a low risk individual is shifted toward HDL, α-ketoglutarate, dimethylglycine, and 3-hydroxybutyrate. Conversely, the metabolic pathways for the high-risk individual are shifted toward LDL, threonine and acetoacetate.
Figure 9.
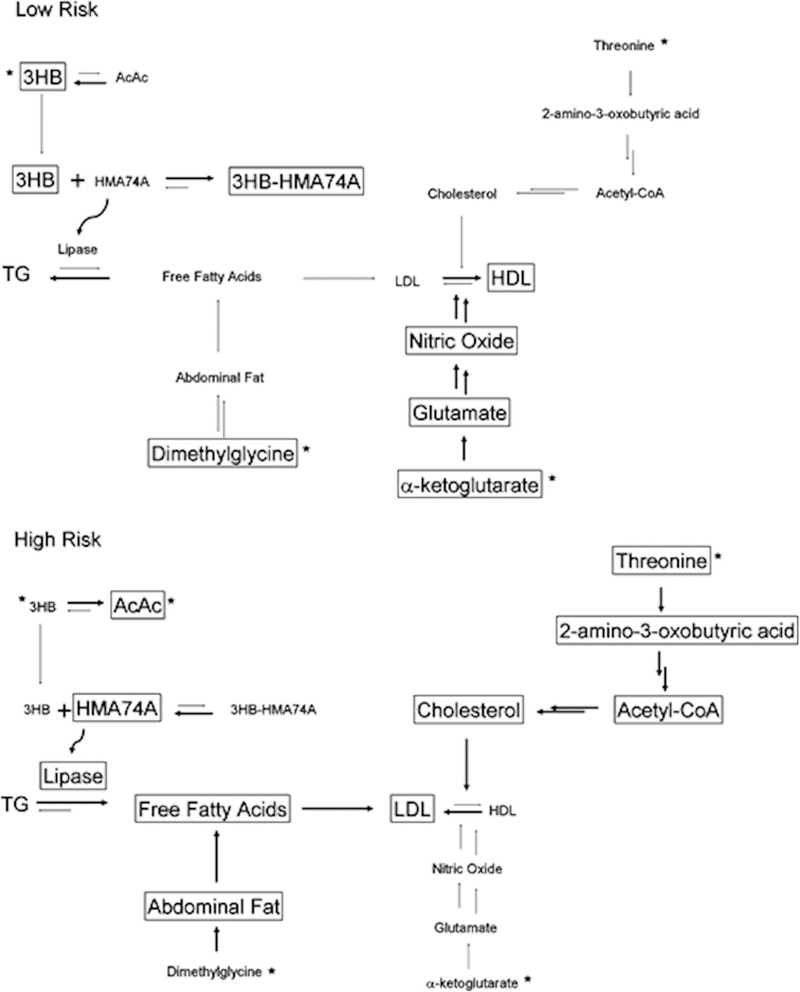
Metabolic fingerprint in low and high risk subjects (metabolites whose amount differs significantly between the low- and high-risk subjects are marked with an asterisk). Reprinted with permission from reference,[133] (Copyright 2011 by American Chemical Society)
Another unique application of NMR metabolomics is demonstrated by Heinzmann et al. (2010).[134] Urine samples collected from eight individuals were analyzed using 1D 1H NMR to identify metabolites associated with nutrition. Analysis of the resulting NMR spectra identified proline betaine as a urine biomarker for citrus fruit consumption (Figure 10). Numerous fruits and fruit juices were similarly analyzed by NMR to quantify the amount of proline betaine in order to establish citrus juice as the potential source of proline betaine in the urine samples. Only citrus juices were shown to contain a significant quantity of proline betaine, with orange juice showing the highest concentration of the metabolite. To further validate proline betaine as a biomarker of citrus fruit consumption, 1D 1H NMR was used to study the kinetics of the urinary excretion of proline betaine after consuming orange juice (Figure 10). Urine was collected from six individuals before (−26 to 0 hrs) and after (+2 to +24 hrs) drinking 250 mL of orange juice. The isolated proline betaine methylene singlet at δ 3.11 was used to monitor the metabolite’s urine concentration as a function of time. The NMR spectrum clearly shows the presence of the metabolite in urine 2 hrs after consuming orange juice. Additionally, integration of the δ 3.106 – 3.116 spectral region revealed that proline betaine remains in the urine more than 24 hrs after consuming orange juice. After validating the utility of using NMR to monitor proline betaine as a biomarker for citrus fruit consumption, 1D 1H NMR spectra were collected from the INTERMAP UK urine collection (n > 1000) to classify participants as citrus or non-citrus consumers. INTERMAP is a large-scale epidemiologic study to determine dietary factors associated with high blood pressure. Citric consumers were shown to have healthier diets, and correspondingly to be in better health (lower BMI and blood pressure), and to also be better educated.
Figure 10.
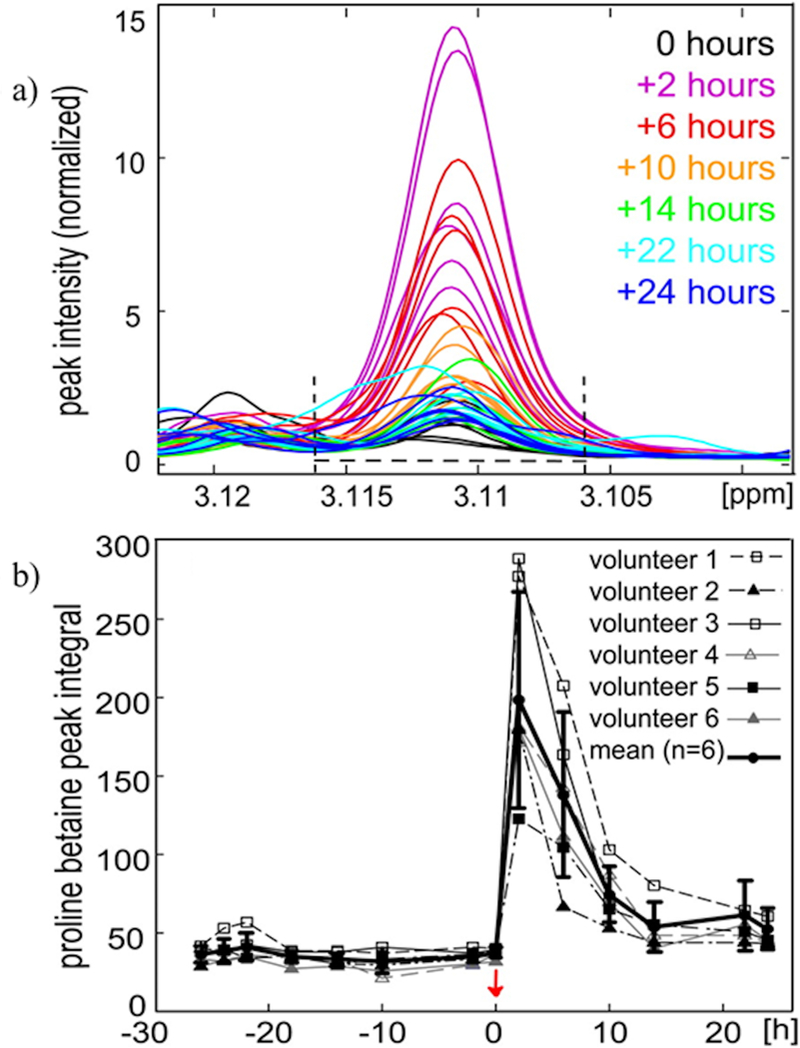
Urinary excretion kinetics of proline betaine after orange juice consumption (n = 6). (a) Proline betaine singlet at δ 3.11 was integrated over the spectral region δ 3.106–3.116 as shown, where the peak overlap is minimal. (b) Mean and SD proline betaine integral (solid bold line) and the proline betaine integral for each of the 6 volunteers plotted over time. The red arrow indicates the time of orange juice consumption. ppm, parts per million. Reprinted with permission from reference,[134] (Copyright 2011 by American Society for Nutrition)
CONCLUSION
NMR metabolomics continues to make significant contributions to the identification of biomarkers to aid in the diagnosis and treatment of various human diseases. NMR has assisted in identifying biomarkers for various types of cancers, neurological diseases, genetic disorders, and infectious diseases, among others. The appeal of NMR metabolomics is the simplicity in sample preparation and its robust, versatile, and easy application. Global metabolomic changes can be quickly obtained with relatively routine one-dimensional 1H NMR experiments. Specific metabolites correlated with a disease and potential biomarkers can be identified by two dimensional NMR experiments in combination with chemometrics techniques that include S plots and loading plots. Furthermore, including statistical analysis, such as tree diagrams, bootstrap numbers and T2 hoteling provides an important level of confidence to the biological interpretation of NMR metabolomics data.
ACKNOWLEGMENTS
This manuscript was supported in part by the NIH National Center for Research Resources (P20 RR-17675.
REFERENCES
- [1].Freeman BC, Third-World Folk Beliefs and Practices: Haitian Medical Anthropology. La Presse Evangélique, Port-au-Prince, 2007. [Google Scholar]
- [2].Falagas ME Science in Greece: from the age of Hippocrates to the age of the genome. FASEB J, 2006, 20, (12), 1946–1950. [DOI] [PubMed] [Google Scholar]
- [3].White WI A New Look at the Role of Urinalysis in the History of Diagnostic Medicine. Chlinical Chemistry, 1991, 37, (1), 119–125. [PubMed] [Google Scholar]
- [4].Lindon J. K. N.a. J. C. Metabonomics. Nature: Systems Biology, 2008, 455, (23), 1045–1056. [DOI] [PubMed] [Google Scholar]
- [5].Eknoyan G; Nagy J A history of diabetes mellitus or how a disease of the kidneys evolved into a kidney disease. Adv. Chronic Kidney D, 2005, 12, (2), 223–229. [DOI] [PubMed] [Google Scholar]
- [6].Durner J Clin. Chem.: Challenges for Anal. Chem. and the Nanosciences from Medicine. Angew. Chem., Int. Ed, 2009, 49, (6), 1026–1051. [DOI] [PubMed] [Google Scholar]
- [7].Robinson B; Pauling L Techniques of Orthomolecular Diagnosis. Clin. Chem, 1974, 20, (8), 961 −965. [PubMed] [Google Scholar]
- [8].Messerli G; Partovi Nia V.; Trevisan M; Kolbe A; Schauer N; Geigenberger P; Chen J; Davison AC; Fernie AR; Zeeman SC Rapid Classification of Phenotypic Mutants of Arabidopsis via Metabolite Fingerprinting. Plant Physiol, 2007, 143, (4), 1484–1492. [DOI] [PMC free article] [PubMed] [Google Scholar]
- [9].Fiehn O Metabolomics – the link between genotypes and phenotypes. Plant Mol. Biol. 2002, 48, (1–2), 155–171 [PubMed] [Google Scholar]
- [10].Badano JL; Katsanis N Beyond Mendel: an evolving view of human genetic disease transmission. Nat. Rev. Genet, 2002, 3, (10), 779–789. [DOI] [PubMed] [Google Scholar]
- [11].Rebbeck TR; Domchek SM Variation in breast cancer risk in BRCA1 and BRCA2 mutation carriers. Breast Cancer Res, 2008, 10, (108), ePub. [DOI] [PMC free article] [PubMed] [Google Scholar]
- [12].Mavaddat N; Antoniou AC; Easton DF; Garcia-Closas M Genetic susceptibility to breast cancer. Mol. Oncol, 2010, 4, (3), 174–191. [DOI] [PMC free article] [PubMed] [Google Scholar]
- [13].Nathanson KL; Domchek SM Therapeutic approaches for women predisposed to breast cancer. Annu. Rev. Med, 2011, 62, 295–306. [DOI] [PubMed] [Google Scholar]
- [14].Howard AF; Balneaves LG; Bottorff JL; Rodney P Preserving the self: the process of decision making about hereditary breast cancer and ovarian cancer risk reduction. Qual Health Res, 2011, 21, (4), 502–519. [DOI] [PMC free article] [PubMed] [Google Scholar]
- [15].Alberio T; Fasano M Proteomics in Parkinson’s disease: An unbiased approach towards peripheral biomarkers and new therapies. J. Biotechnol, 2011, 156, (4), 325–337. [DOI] [PubMed] [Google Scholar]
- [16].Denman B; Goodman SR Emerging and neglected tropical diseases: translational application of proteomics. Exp. Biol. Med, 2011, 236, (8), 972–976. [DOI] [PubMed] [Google Scholar]
- [17].Hanash S Progress in mining the human proteome for disease applications. OMICS, 2011, 15, (3), 133–139. [DOI] [PMC free article] [PubMed] [Google Scholar]
- [18].Wang J-Z; Grundke-Iqbal I; Iqbal K Glycosylation of microtubule-associated protein tau: An abnormal posttranslational modification in Alzheimer’s disease. Nature, 1996, 2, (8), 871–875. [DOI] [PubMed] [Google Scholar]
- [19].Vucic D; Dixit VM; Wertz IE Ubiquitylation in apoptosis: a post-translational modification at the edge of life and death. Nat. Rev. Mol. Cell Biol, 2011, 12, (7), 439–452. [DOI] [PubMed] [Google Scholar]
- [20].Ehrnhoefer DE; Sutton L; Hayden MR Small Changes, Big Impact: Posttranslational Modifications and Function of Huntingtin in Huntington Disease. The Neuroscientist, 2011, 17, (5), 475–492. [DOI] [PMC free article] [PubMed] [Google Scholar]
- [21].Yamada M; Fujii K; Koyama K; Hirohashi S; Kondo T The proteomic profile of pancreatic cancer cell lines corresponding to carcinogenesis and metastasis. J. Proteomics Bioinf, 2009, 2, (1), 001–018. [Google Scholar]
- [22].Shen J; Person MD; Zhu J; Abbruzzese JL; Li D Protein Expression Profiles in Pancreatic Adenocarcinoma Compared with Normal Pancreatic Tissue and Tissue Affected by Pancreatitis as Detected by Two-Dimensional Gel Electrophoresis and Mass Spectrometry. Cancer Res, 2004, 64, (24), 9018–9026. [DOI] [PubMed] [Google Scholar]
- [23].Chen R; Yi EC; Donohoe S; Pan S; Eng J; Cooke K; Crispin DA; Lane Z; Goodlett DR; Bronner MP; Aebersold R; Brentnall TA Pancreatic cancer proteome: The proteins that underlie invasion, metastasis, and immunologic escape. Gastroenterology, 2005, 129, (4), 1187–1197. [DOI] [PubMed] [Google Scholar]
- [24].Crnogorac-Jurcevic T; Gangeswaran R; Bhakta V; Capurso G; Lattimore S; Akada M; Sunamura M; Prime W; Campbell F; Brentnall TA; Costello E; Neoptolemos J; Lemoine NR Proteomic analysis of chronic pancreatitis and pancreatic adenocarcinoma. Gastroenterology, 2005, 129, (5), 1454–1463. [DOI] [PubMed] [Google Scholar]
- [25].Grutzmann R; Boriss H; Ammerpohl O; Luttges J; Kalthoff H; Schackert HK; Kloppel G; Saeger HD; Pilarsky C Meta-analysis of microarray data on pancreatic cancer defines a set of commonly dysregulated genes. Oncogene, 2005, 24, (32), 5079–5088. [DOI] [PubMed] [Google Scholar]
- [26].Biron DG; Brun C; Lefevre T; Lebarbenchon C; Loxdale HD; Chevenet F; Brizard J-P; Thomas F The pitfalls of proteomics experiments without the correct use of bioinformatics tools. Proteomics, 2006, 6, (20), 5577–5596. [DOI] [PubMed] [Google Scholar]
- [27].Reinders J; Lewandrowski U; Moebius J; Wagner Y; Sickmann A Challenges in mass spectrometry-based proteomics. Proteomics, 2004, 4, (12), 3686–3703. [DOI] [PubMed] [Google Scholar]
- [28].Powers R NMR metabolomics and drug discovery. Magn. Reson. Chem, 2009, 47, (S1), S2–S11. [DOI] [PubMed] [Google Scholar]
- [29].Zhang G-F; Sadhukhan S; Tochtrop GP; Brunengraber H Metabolomics, Pathway Regulation, and Pathway Discovery. J. Biol. Chem, 2011, 286, (27), 23631–23635. [DOI] [PMC free article] [PubMed] [Google Scholar]
- [30].Pauling L; Robinson AB; Teranishit R; Cary P Quantitative Analysis of Urine Vapor and Breath by Gas-Liquid Partition Chromatography. Proc. Natl. Acad. Sci. U. S. A, 1971, 68 (10), 2374–2376. [DOI] [PMC free article] [PubMed] [Google Scholar]
- [31].Dixon RA; Gang DR; Charlton AJ; Fiehn O; Kuiper HA; Reynolds TL; Tjeerdema RS; Jeffery EH; German JB; Ridley WP; Seiber JN Applications of Metabolomics in Agriculture. J. Agric. Food Chem. , 2006, 54 (24), 8984–8994. [DOI] [PubMed] [Google Scholar]
- [32].Wang TJ; Larson MG; Vasan RS; Cheng S; Rhee EP; McCabe E; Lewis GD; Fox CS; Jacques PF; Fernandez C; O’Donnell CJ; Carr SA; Mootha VK; Florez JC; Souza A; Melander O; Clish CB; Gerszten RE Metabolite profiles and the risk of developing diabetes. Nat. Med, 2011, 17, (4), 448–453. [DOI] [PMC free article] [PubMed] [Google Scholar]
- [33].Viant MR Metabolomics of aquatic organisms: the new ‘omics’ on the block. Mar Ecol Prog Ser, 2007, 332, 301–306. [Google Scholar]
- [34].Bundy JG; Davey MP; Viant MR Environmental metabolomics: a critical review and future perspectives. Metabolomics, 2008, 5, (1), 3–21. [Google Scholar]
- [35].Vinayavekhin N; Homan EA; Saghatelian A Exploring Disease through Metabolomics. ACS Chem. Biol, 2010, 5, (1), 91–103. [DOI] [PubMed] [Google Scholar]
- [36].Gowda G. n; Zhang S; Gu H; Asiago V; Shanaiah N; Raftery D Metabolomics-based methods for early disease diagnostics. Expert Rev. Mol. Diagn, 2008, 8, (5), 617–633. [DOI] [PMC free article] [PubMed] [Google Scholar]
- [37].Gu H; Chen H; Pan Z; Jackson AU; Talaty N; Xi B; Kissinger C; Duda C; Mann D; Raftery D; Cooks RG Monitoring Diet Effects via Biofluids and Their Implications for Metabolomics Studies. Anal. Chem, 2007, 79, 89–97. [DOI] [PubMed] [Google Scholar]
- [38].Olszewski KL; Morrisey JM; Wilinski D; Burns JM; Vaidya AB; Rabinowitz JD; Llinas M Host-parasite interactions revealed by Plasmodium falciparum metabolomics. Cell Host Microbe, 2009, 5, 191–199. [DOI] [PMC free article] [PubMed] [Google Scholar]
- [39].Drexler DM; Reily MD; Shipkova PA Advances in mass spectrometry applied to pharmaceutical metabolomics. Anal. Bioanal. Chem, 2011, 399, 2645–2653. [DOI] [PubMed] [Google Scholar]
- [40].Birungi G; Meijie Chen S; Pheng Loy B; Lee Ng M.; Fong Yau Li S. Metabolomics Approach for Investigation of Effects of Dengue Virus Infection Using the EA.hy926 Cell Line. J. Proteome Res. 2010, 9, 6523–6534. [DOI] [PubMed] [Google Scholar]
- [41].Krishnan P Metabolite fingerprinting and profiling in plants using NMR. J. Exp. Bot, 2004, 56, (410), 255–265. [DOI] [PubMed] [Google Scholar]
- [42].Atherton HJ; Bailey NJ; Zhang W; Taylor J; Major H; Shockcor J; Clarke K; Griffin JL A combined 1H-NMR spectroscopy- and mass spectrometry-based metabolomic study of the PPAR- null mutant mouse defines profound systemic changes in metabolism linked to the metabolic syndrome. Physiol. Genomics, 2006, 27, (2), 178–186. [DOI] [PubMed] [Google Scholar]
- [43].Pan Z; Raftery D Comparing and combining NMR spectroscopy and mass spectrometry in metabolomics. Anal. Bioanal. Chem, 2007, 387, (2), 525–527. [DOI] [PubMed] [Google Scholar]
- [44].Zheng S; Zhang S; Yu M; Tang J; Lu X; Wang F; Yang J; Li F An 1H NMR and UPLC-MS-based plasma metabonomic study to investigate the biochemical changes in chronic unpredictable mild stress model of depression. Metabolomics, 2011, 7, (3), 413–423. [Google Scholar]
- [45].Lanza IR; Zhang S; Ward LE; Karakelides H; Raftery D; Nair KS Quantitative metabolomics by 1H-NMR and LC-MS/MS confirms altered metabolic pathways in diabetes. PLoS One, 2010, 5, (5), e10538. [DOI] [PMC free article] [PubMed] [Google Scholar]
- [46].Gu H; Pan Z; Xi B; Asiago V; Musselman B; Raftery D Principal component directed partial least squares analysis for combining nuclear magnetic resonance and mass spectrometry data in metabolomics: Application to the detection of breast cancer. Anal. Chim. Acta, 2011, 686, (1–2), 57–63. [DOI] [PMC free article] [PubMed] [Google Scholar]
- [47].Nicholson JK; Buckingham MJ; Saldler PJ High resolution 1H n.m.r. studies of vertebrate blood and plasma. Biochem. J. , 1983, 211, (3), 605–615. [DOI] [PMC free article] [PubMed] [Google Scholar]
- [48].Lindon JC; Holmes E; Nicholson JK Metabonomics in pharmaceutical R & D. FEBS J., 2007, 274, (5), 1140–1151. [DOI] [PubMed] [Google Scholar]
- [49].Shin J-H; Yang J-Y; Jeon B-Y; Yoon YJ; Cho S-N; Kang Y-H; Ryu DH; Hwang G-S 1H NMR-based Metabolomic Profiling in Mice Infected withMycobacterium tuberculosis. J. Proteome Res, 2011, 10, (5), 2238–2247. [DOI] [PubMed] [Google Scholar]
- [50].Teng R; Junankar PR; Bubb WA; Rae C; Mercier P; Kirk K Metabolite profiling of the intraerythrocytic malaria parasitePlasmodium falciparumby1H NMR spectroscopy. NMR Biomed, 2009, 22, (3), 292–302. [DOI] [PubMed] [Google Scholar]
- [51].Slupsky CM NMR-based analysis of metabolites in urine provides rapid diagnosis and etiology of pneumonia. Biomarkers Med, 2010, 4, (2), 195–197. [DOI] [PubMed] [Google Scholar]
- [52].DeFeo EM; Wu C-L; McDougal WS; Cheng LL A decade in prostate cancer: from NMR to metabolomics. Nat. Rev. Urol, 2011, 8, (6), 301–311. [DOI] [PubMed] [Google Scholar]
- [53].Ahmed SSSJ; Santosh W; Kumar S; Christlet H Metabolic profiling of Parkinson’s disease: evidence of biomarker from gene expression analysis and rapid neural network detection. J. Biomed. Sci, 2009, 16, (63), Epub. [DOI] [PMC free article] [PubMed] [Google Scholar]
- [54].Sinclair AJ; Viant MR; Ball AK; Burdon MA; Walker EA; Stewart PM; Rauz S; Young SP NMR-based metabolomic analysis of cerebrospinal fluid and serum in neurological diseases - a diagnostic tool? NMR Biomed, 2009, 23, (2), 123–132. [DOI] [PubMed] [Google Scholar]
- [55].Beger RD; Schnackenberg LK; Holland RD; Li D; Dragan Y Metabonomic models of human pancreatic cancer using 1D proton NMR spectra of lipids in plasma. Metabolomics, 2006, 2, (3), 125–134. [Google Scholar]
- [56].Bathe OF; Shaykhutdinov R; Kopciuk K; Weljie AM; McKay A; Sutherland FR; Dixon E; Dunse N; Sotiropoulos D; Vogel HJ Feasibility of Identifying Pancreatic Cancer Based on Serum Metabolomics. Cancer Epidem. Biomar, 2010, 20, (1), 140–147. [DOI] [PubMed] [Google Scholar]
- [57].Uversky VN; Blasco H; Corcia P; Moreau C; Veau S; Fournier C; Vourc’h P; Emond P; Gordon P; Pradat P-F; Praline J; Devos D; Nadal-Desbarats L; Andres CR 1H-NMR-Based Metabolomic Profiling of CSF in Early Amyotrophic Lateral Sclerosis. PLoS One, 2010, 5, (10), e13223. [DOI] [PMC free article] [PubMed] [Google Scholar]
- [58].Bharti SK; Jaiswal V; Ghoshal U; Ghoshal UC; Baijal SS; Roy R; Khetrapal CL Metabolomic profiling of amoebic and pyogenic liver abscesses: an in vitro NMR study. Metabolomics, 2011, Epub. [Google Scholar]
- [59].Ramadan Z; Jacobs D; Grigorov M; Kochhar S Metabolic profiling using principal component analysis, discriminant partial least squares, and genetic algorithms. Talanta, 2006, 68, (5), 1683–1691. [DOI] [PubMed] [Google Scholar]
- [60].Monleón D; Morales JM; Barrasa A; López JA; Vázquez C; Celda B Metabolite profiling of fecal water extracts from human colorectal cancer. NMR Biomed, 2009, 22, (3), 342–348. [DOI] [PubMed] [Google Scholar]
- [61].Auray-Blais C; Raiche E; Gagnon R; Berthiaume M; Pasquier J-C Metabolomics and preterm birth: What biomarkers in cervicovaginal secretions are predictive of high-risk pregnant women? International J. Mass Spectrom, 2011, 307, (1–3), 33–38. [Google Scholar]
- [62].Beckonert O; Keun HC; Ebbels TMD; Bundy J; Holmes E; Lindon JC; Nicholson JK Metabolic profiling, metabolomic and metabonomic procedures for NMR spectroscopy of urine, plasma, serum and tissue extracts. Nat. Protoc., 2007, 2, (11), 2692–2703. [DOI] [PubMed] [Google Scholar]
- [63].Beckonert O; Coen M; Keun HC; Wang Y; Ebbels TMD; Holmes E; Lindon JC; Nicholson JK High-resolution magic-angle-spinning NMR spectroscopy for metabolic profiling of intact tissues. Nat. Protoc, 2010, 5, (6), 1019–1032. [DOI] [PubMed] [Google Scholar]
- [64].Somashekar BS; Kamarajan P; Danciu T; Kapila YL; Chinnaiyan AM; Rajendiran TM; Ramamoorthy A Magic Angle Spinning NMR-Based Metabolic Profiling of Head and Neck Squamous Cell Carcinoma Tissues. J. Proteome Res, 2011, 10, (11), 5232–5241. [DOI] [PMC free article] [PubMed] [Google Scholar]
- [65].Chan ECY; Koh PK; Mal M; Cheah PY; Eu KW; Backshall A; Cavill R; Nicholson JK; Keun HC Metabolic Profiling of Human Colorectal Cancer Using High-Resolution Magic Angle Spinning Nuclear Magnetic Resonance (HR-MAS NMR Spectroscopy and Gas Chromatography Mass Spectrometry (GC/MS). J. Proteome Res, 2009, 8 (1), 352–361. [DOI] [PubMed] [Google Scholar]
- [66].Wilson M; Davies NP; Brundler M-A; McConville C; Grundy RG; Peet AC High resolution magic angle spinning 1H NMR of childhood brain and nervous system tumours. Mol. Cancer, 2009, 8, (6), Epub. [DOI] [PMC free article] [PubMed] [Google Scholar]
- [67].Spratlin JL; Serkova NJ; Eckhardt SG Clinical Applications of Metabolomics in Oncology: A Review. Clin. Cancer Res, 2009, 15, 431–440. [DOI] [PMC free article] [PubMed] [Google Scholar]
- [68].Saude EJ; Sykes BD Urine stability for metabolomic studies: effects of preparation and storage. Metabolomics, 2007, 3, (1), 19–27. [Google Scholar]
- [69].Maher Anthony D., v SFMZ., Holmes Elaine, and Jeremy K. Nicholson Experimental and Analytical Variation in Human Urine in 1H NMR Spectroscopy-Based Metabolic Phenotyping Studies. Anal. Chem, 2007, 79 (14), 5204–5211. [DOI] [PubMed] [Google Scholar]
- [70].Slupsky CM; Rankin KN; Wagner J; Fu H; Chang D; Weljie AM; Saude EJ; Lix B; Adamko DJ; Shah S; Greiner R; Sykes BD; Marrie TJ Investigations of the Effects of Gender, Diurnal Variation, and Age in Human Urinary Metabolomic Profiles. Anal. Chem. , 2007, 79, (18), 6995–7004. [DOI] [PubMed] [Google Scholar]
- [71].Minami Y; Kasukawa T; Kakazu Y; Iigo M; Sugimoto M; Ikeda S; Yasui A; van d. H. G. T. J; Soga T.; Ueda HR. Measurement of internal body time by blood metabolomics. Proc. Natl. Acad. Sci. U. S. A, 2009, 106, (24), 9890–9895. [DOI] [PMC free article] [PubMed] [Google Scholar]
- [72].Saude EJ; Adamko D; Rowe BH; Marrie T; Sykes BD Variation of metabolites in normal human urine. Metabolomics, 2007, 3, (4), 439–451. [Google Scholar]
- [73].NCCLS, Urinalysis and Collection, Transportation, and Preservation of Urine Specimens; Approved Guideline-Second Edition NCCLS document GP16-A2 [ISBN 1–56238-448–1], NCCLS, 940 West Valley Rd, Suite 1400, Wayne, Pennsylvania 19087–1898 USA, 2001. [Google Scholar]
- [74].Lauridsen M; Hansen SH; Jroszewski JW; Cornett C Human Urine as Test Material in 1H NMR-Based Metabonomics: Recommendations for Sample Preparation and Storage. Anal Chem, 2007, 79, (3), 1181–1186. [DOI] [PubMed] [Google Scholar]
- [75].Winning H; Roldán-Marín E; Dragsted LO; Viereck N; Poulsen M; Sánchez-Moreno C; Cano MP; Engelsen SB An exploratory NMR nutri-metabonomic investigation reveals dimethyl sulfone as a dietary biomarker for onion intake. The Analyst, 2009, 134, (11), 2344–2351. [DOI] [PubMed] [Google Scholar]
- [76].Winnike JH; Busby MG; Watkins PB; O’Connell TM Effects of a prolonged standardized diet on normalizing the human metabolome. Am. J. Clin. Nutr, 2009, 90, (6), 1496–1501. [DOI] [PMC free article] [PubMed] [Google Scholar]
- [77].Bando K; Kawahara R; Kunimatsu T; Sakai J; Kimura J; Funabashi H; Seki T; Bamba T; Fukusaki E Influences of biofluid sample collection and handling procedures on GC-MS based metabolomic studies. J. Biosci. Bioeng, 2010, 110, (4), 491–499. [DOI] [PubMed] [Google Scholar]
- [78].Briscoe CJ; Hage DS Factors affecting the stability of drugs and drug metabolites in biological matrices. Bioanalysis, 2009, 1, (1), 205–220. [DOI] [PubMed] [Google Scholar]
- [79].Canelas AB; Ras C; ten Pierick A; van Dam JC; Heijnen JJ; van Gulik WM Leakage-free rapid quenching technique for yeast metabolomics. Metabolomics, 2008, 4, (3), 226–239. [Google Scholar]
- [80].Bernini P; Bertini I; Luchinat C; Nincheri P; Staderini S; Turano P Standard operating procedures for pre-analytical handling of blood and urine for metabolomic studies and biobanks. J Biomol NMR, 2011, 49, (3–4), 231–243. [DOI] [PubMed] [Google Scholar]
- [81].Rasmussen LG; Savorani F; Larsen TM; Dragsted LO; Astrup A; Engelsen SB Standardization of factors that influence human urine metabolomics. Metabolomics, 2011, 7, (1), 71–83. [Google Scholar]
- [82].Van CE; Shapiro ET; Tillil H; Polonsky KS Circadian modulation of glucose and insulin responses to meals: relationship to cortisol rhythm. Am. J. Physiol, 1992, 262, (4, Pt. 1), E467–E475. [DOI] [PubMed] [Google Scholar]
- [83].Alum MF; Shaw PA; Sweatman BC; Ubhi BK; Haselden JN; Connor SC 4,4-Dimethyl-4-silapentane-1-ammonium trifluoroacetate (DSA), a promising universal internal standard for NMR-based metabolic profiling studies of biofluids, including blood plasma and serum. Metabolomics, 2008, 4, (2), 122–127. [Google Scholar]
- [84].Bone I The increasing importance of inflammation in neurological disease. Curr Opin Neurol, 2007, 20, (3), 331–333. [DOI] [PubMed] [Google Scholar]
- [85].Bales JR; Higham DP; Howe I; Nicholson JK.; Sadler PJ. Use of High-Resolution Proton Nuclear Magnetic Resonance Spectroscopy for Rapid Multi-Component Analysis of Urine. Clin. Chem, 1984, 30, (3), 426–432. [PubMed] [Google Scholar]
- [86].Jukarainen NM; Korhonen S-P; Laakso MP; Korolainen MA; Niemitz M; Soininen PP; Tuppurainen K; Vepsäläinen J; Pirttilä T; Laatikainen R Quantification of 1H NMR spectra of human cerebrospinal fluid: a protocol based on constrained total-line-shape analysis. Metabolomics, 2008, 4, (2), 150–160. [Google Scholar]
- [87].Amathieu R; Nahon P; Triba M; Bouchemal N; Trinchet J-C; Beaugrand M; Dhonneur G; Le Moyec L Metabolomic Approach by1H NMR Spectroscopy of Serum for the Assessment of Chronic Liver Failure in Patients with Cirrhosis. J. Proteome Res, 2011, 10, (7), 3239–3245. [DOI] [PubMed] [Google Scholar]
- [88].Wang J; Zhang S; Li Z; Yang J; Huang C; Liang R; Liu Z; Zhou R 1H-NMR-based metabolomics of tumor tissue for the metabolic characterization of rat hepatocellular carcinoma formation and metastasis. Tumor Biol., 2010, 32, (1), 223–231. [DOI] [PubMed] [Google Scholar]
- [89].Kang S-M; Park J-C; Shin M-J; Lee H; Oh J; Ryu DH; Hwang G-S; Chung JH 1H nuclear magnetic resonance based metabolic urinary profiling of patients with ischemic heart failure. Clin. Biochem, 2011, 44, (4), 293–299. [DOI] [PubMed] [Google Scholar]
- [90].Cui Q; Lewis IA; Hegeman AD; Anderson ME; Li J; Schulte CF; Westler WM; Eghbalnia HR; Sussman MR; Markley JL Metabolite identification via the Madison Metabolomics Consortium Database. Nat Biotechnol, 2008, 26, (2), 162–164. [DOI] [PubMed] [Google Scholar]
- [91].Ulrich EL; Akutsu H; Doreleijers JF; Harano Y; Ioannidis YE; Lin J; Livny M; Mading S; Maziuk D; Miller Z; Nakatani E; Schulte CF; Tolmie DE; Kent Wenger R; Yao H; Markley JL BioMagResBank. Nucleic Acids Res, 2008, 36, (Database issue), D402–408. [DOI] [PMC free article] [PubMed] [Google Scholar]
- [92].Wishart DS; Tzur D; Knox C; Eisner R; Guo AC; Young N; Cheng D; Jewell K; Arndt D; Sawhney S; Fung C; Nikolai L; Lewis M; Coutouly MA; Forsythe I; Tang P; Shrivastava S; Jeroncic K; Stothard P; Amegbey G; Block D; Hau DD; Wagner J; Miniaci J; Clements M; Gebremedhin M; Guo N; Zhang Y; Duggan GE; Macinnis GD; Weljie AM; Dowlatabadi R; Bamforth F; Clive D; Greiner R; Li L; Marrie T; Sykes BD; Vogel HJ; Querengesser L HMDB: the Human Metabolome Database. Nucleic Acids Res, 2007, 35, (Database issue), D521–526. [DOI] [PMC free article] [PubMed] [Google Scholar]
- [93].Forsythe IJ; Wishart DS Exploring human metabolites using the human metabolome database. Curr Protoc Bioinformatics, 2009, 25, 14.18.11–14.18.45. [DOI] [PubMed] [Google Scholar]
- [94].Bertram HC; Malmendal A; Petersen BO; Madsen JC; Pedersen H; Nielsen NC; Hoppe C; Molgaard C; Michaelsen KF; Duus JO Effect of Magnetic Field Strength on NMR-Based Metabonomic Human Urine Data. Comparative Study of 250, 400, 500, and 800 MHz. Anal. Chem, 2007, 79, (18), 7110–7115. [DOI] [PubMed] [Google Scholar]
- [95].He Q; Ren P; Kong X; Wu Y; Wu G; Li P; Hao F; Tang H; Blachier F; Yin Y Comparison of serum metabolite compositions between obese and lean growing pigs using an NMR-based metabonomic approach. The J. Nutr.al Biochemistry, 2011, 23, (2), 133–139. [DOI] [PubMed] [Google Scholar]
- [96].Rastrelli F; Jha S; Mancin F Seeing through Macromolecules: T2-Filtered NMR for the Purity Assay of Functionalized Nanosystems and the Screening of Biofluids. J. AM. CHEM. SOC. , 2009. 131, 14222–14224. [DOI] [PubMed] [Google Scholar]
- [97].Diaz S. l. O; Pinto J; Graç G. a.; Duarte IF.; Barros A. n. S.; Galhano E. l.; Pita C; Almeida M. d. C. u.; Goodfellow BJ.; Carreira IM; Gil AM. Metabolic Biomarkers of Prenatal Disorders: An Exploratory NMR Metabonomics Study of Second Trimester Maternal Urine and Blood Plasma. J. Proteome Res, 2011, 10, (8), 3732–3742. [DOI] [PubMed] [Google Scholar]
- [98].Lewis IA; Schommer SC; Hodis B; Robb KA; Tonelli M; Westler WM; Sussman MR; Markley JL Method for Determining Molar Concentrations of Metabolites in Complex Solutions from Two-Dimensional 1H-13C NMR Spectra. Anal. Chem, 2007, 79, 9385–9390. [DOI] [PMC free article] [PubMed] [Google Scholar]
- [99].Jeannerat D; Furrer J NMR Experiments for the Analysis of Mixtures: Beyond 1D 1H Spectra Comb. Chem. High Throughput Screening, 2012, 15, (1), 15–35. [DOI] [PubMed] [Google Scholar]
- [100].Zhang F; Bruschweiler-Li L; Robinette SL Self-Consistent Metabolic Mixture Analysis by Heteronuclear NMR. Application to a Human Cancer Cell Line. Anal. Chem, 2008, 80, (19), 7549–7553. [DOI] [PMC free article] [PubMed] [Google Scholar]
- [101].Fan TWM; Lane AN; Higashi RM; Farag MA; Gao H; Bousamra M; Miller DM Altered regulation of metabolic pathways in human lung cancer discerned by 13C stable isotope-resolved metabolomics (SIRM). Mol. Cancer, 2009, 8, (41), Epub. [DOI] [PMC free article] [PubMed] [Google Scholar]
- [102].Moseley HNB; Lane AN; Belshoff AC; Higashi RM; Fan TWM A novel deconvolution method for modeling UDP-N-acetyl-D-glucosamine biosynthetic pathways based on 13C mass isotopologue profiles under non-steady-state conditions. BMC Biology, 2011, 9, (1), 37. [DOI] [PMC free article] [PubMed] [Google Scholar]
- [103].Heikkinen S; Toikka MM; Karhunen PT; Kilpeläinen IA Quantitative 2D HSQC (Q-HSQC) via Suppression of J-Dependence of Polarization Transfer in NMR Spectroscopy: Application to Wood Lignin. J. Am. Chem. Soc, 2003, 125, (14), 4362–4367. [DOI] [PubMed] [Google Scholar]
- [104].Henderson TJ Sensitivity-Enhanced Quantitative 13C NMR Spectroscopy via Cancellation of 1JCH Dependence in DEPT Polarization Transfers. J. AM. CHEM. SOC, 2004, 126, 3682–3683. [DOI] [PubMed] [Google Scholar]
- [105].Koskela H; Kilpeläinen I; Heikkinen S Some aspects of quantitative 2D NMR. J. Magn. Reson, 2005, 174, (2), 237–244. [DOI] [PubMed] [Google Scholar]
- [106].Gronwald W; Klein MS; Kaspar H; Fagerer SR; Nürnberger N; Dettmer K; Bertsch T; Oefner PJ Urinary Metabolite Quantification Employing 2D NMR Spectroscopy. Anal. Chem, 2007, 80, 9288–9297. [DOI] [PubMed] [Google Scholar]
- [107].Hu F; Furihata K; Kato Y; Tanokura M Nondestructive Quantification of Organic Compounds in Whole Milk without Pretreatment by Two-Dimensional NMR Spectroscopy. J. Agric. Food Chem. , 2007, 55, 4307–4311. [DOI] [PubMed] [Google Scholar]
- [108].Koskela H; Heikkilä O; Kilpeläinen I; Heikkinen S Quantitative two-dimensional HSQC experiment for high magnetic field NMR spectrometers. J. Magn. Reson, 2010, 202, (1), 24–33. [DOI] [PubMed] [Google Scholar]
- [109].Hu K; Westler WM; Markley JL Simultaneous Quantification and Identification of Individual Chemicals in Metabolite Mixtures by Two-Dimensional Extrapolated Time-Zero1H−13C HSQC (HSQC0). J. Amer. Chem. Soc, 2011, 133, (6), 1662–1665. [DOI] [PMC free article] [PubMed] [Google Scholar]
- [110].Lindon JC; Nicholson JK Analytical technologies for metabonomics and metabolomics, and multi-omic information recovery. TrAC Trends in Anal. Chem, 2008, 27, (3), 194–204. [Google Scholar]
- [111].Parsons HM; Ludwig C; Günther UL; Viant MR Improved classification accuracy in 1- and 2-dimensional NMR metabolomics data using the variance stabilising generalised logarithm transformation. BMC Bioinformatics, 2007, 8, (834), Epub. [DOI] [PMC free article] [PubMed] [Google Scholar]
- [112].Lindon JC; Holmes E; Nicholson JK Pattern recognition methods and applications in biomedical magnetic resonance. Prog. Nucl. Magn. Reson. Spectrosc, 2001, 39, (1), 1–40. [Google Scholar]
- [113].Bylesjoe M; Rantalainen M; Cloarec O; Nicholson JK; Holmes E; Trygg J OPLS discriminant analysis: combining the strengths of PLS-DA and SIMCA classification. J. Chemom, 2007, 20, 341–351. [Google Scholar]
- [114].Holmes E; Nicholson JK; Nicholls AW; Lindon JC; Connor SC; Polley S; Connelly J The identification of novel biomarkers of renal toxicity using automatic data reduction techniques and PCA of proton NMR spectra of urine. Chemom. Intell. Lab. Syst, 1998, 44, 245–255. [Google Scholar]
- [115].De Meyer T; Sinnaeve D; Van Gasse B; Tsiporkova E; Rietzschel ER; De Buyzere ML; Gillebert TC; Bekaert S; Martins JC; Criekinge WV NMR-Based Characterization of Metabolic Alterations in Hypertension Using an Adaptive, Intelligent Binning Algorithm. Anal. Chem, 2008, 80, 3783–3790. [DOI] [PubMed] [Google Scholar]
- [116].Craig A; Cloarec O; Holmes E; Nicholson JK; Lindon JC Scaling and Normalization Effects in NMR Spectroscopic Metabonomic Data Sets. Anal. Chem, 2006, 78, 2262–2267. [DOI] [PubMed] [Google Scholar]
- [117].Halouska S; Powers R Negative impact of noise on the principal component analysis of NMR data. J. Magn. Reson, 2006, 178, (1), 88–95. [DOI] [PubMed] [Google Scholar]
- [118].Triba MN; Starzec A; Bouchemal N; Guenin E; Perret GY; Le Moyec L Metabolomic profiling with NMR discriminates between biphosphonate and doxorubicin effects on B16 melanoma cells. NMR Biomed, 2010, 23, (9), 1009–1016. [DOI] [PubMed] [Google Scholar]
- [119].van den Berg RA; Hoefsloot HCJ; Westerhuis JA; Smilde AK; van der Werf MJ Centering, scaling, and transformations: improving the biological information content of metabolomics data. BMC Genomics, 2006, 7, (142), Epub. [DOI] [PMC free article] [PubMed] [Google Scholar]
- [120].Zhang B; Halouska S; Schiaffo CE; Sadykov MR; Somerville GA; Powers R NMR Analysis of a Stress Response Metabolic Signaling Network. J. Proteome Res, 2011, 10, 3743–3754. [DOI] [PMC free article] [PubMed] [Google Scholar]
- [121].Westerhuis JA; Velzen EJJ; Hoefsloot HCJ; Smilde AK Multivariate paired data analysis: multilevel PLSDA versus OPLSDA. Metabolomics, 2009, 6, (1), 119–128. [DOI] [PMC free article] [PubMed] [Google Scholar]
- [122].Molteni CG; Cazzaniga G; Condorelli DF; Fortuna CG; Biondi A; Musumarra G Successful Application of OPLS-DA for the Discrimination of Wild-Type and Mutated Cells in Acute Lymphoblastic Leukemia. QSAR Comb. Sci, 2009, 28, (8), 822–828. [Google Scholar]
- [123].Basant A; Rege M; Sharma S; Sonawat HM Alterations in urine, serum and brain metabolomic profiles exhibit sexual dimorphism during malaria disease progression. Malaria J, 2010, 9, (110), Epub. [DOI] [PMC free article] [PubMed] [Google Scholar]
- [124].Westerhuis JA; Hoefsloot HCJ; Smit S; Vis DJ; Smilde AK; van Velzen EJJ; van Duijnhoven JPM; van Dorsten FA Assessment of PLSDA cross validation. Metabolomics, 2008, 4, 81–89. [Google Scholar]
- [125].Efron B; Halloran E; Holmes S Bootstrap confidence levels for phylogenetic trees. Proc. Natl. Acad. Sci. U. S. A, 1996, 93, (23), 13429–13434. [DOI] [PMC free article] [PubMed] [Google Scholar]
- [126].Werth MT; Halouska S; Shortridge MD; Zhang B; Powers R Analysis of metabolomic PCA data using tree diagrams. Anal. Biochem, 2010, 399, (1), 58–63. [DOI] [PMC free article] [PubMed] [Google Scholar]
- [127].Retief JD Phylogenetic analysis using PHYLIP. Methods Mol. Biol, 2000, 132, 243–258. [DOI] [PubMed] [Google Scholar]
- [128].Zhang B; Halouska S; Schiaffo CE; Sadykov MR; Somerville GA; Powers R NMR Analysis of a Stress Response Metabolic Signaling Network. J. Proteome Res, 2011, 10, (8), 3743–3754. [DOI] [PMC free article] [PubMed] [Google Scholar]
- [129].Halouska S; Fenton RJ; Barletta R. l. G; Powers R. Predicting the in Vivo Mechanism of Action for Drug Leads Using NMR Metabolomics. ACS Chem. Biol, 2012, 7, (1), 166–171. [DOI] [PMC free article] [PubMed] [Google Scholar]
- [130].Carrola J; Rocha CM; Barros AS; Gil AM; Goodfellow BJ; Carreira IM; Bernardo J; Gomes A; Sousa V; Carvalho L; Duarte IF Metabolic signatures of lung cancer in biofluids: NMR-based metabonomics of urine. J Proteome Res, 2011, 10, (1), 221–230. [DOI] [PubMed] [Google Scholar]
- [131].Chiaradonna F; Moresco RM; Airoldi C; Gaglio D; Palorini R; Nicotra F; Messa C; Alberghina L From cancer metabolism to new biomarkers and drug targets. Biotechnol. Adv, 2012, 30, (1), 30–51. [DOI] [PubMed] [Google Scholar]
- [132].MacKinnon N; Khan AP; Chinnaiyan AM; Rajendiran TM; Ramamoorthy A Androgen receptor activation results in metabolite signatures of an aggressive prostate cancer phenotype: an NMR-based metabonomics study Metabolomics, 2012, published online. [Google Scholar]
- [133].Bernini P; Bertini I; Luchinat C; Tenori L; Tognaccini A The Cardiovascular Risk of Healthy Individuals Studied by NMR Metabonomics of Plasma Samples. J. Proteome Res, 2011, 10, (11), 4983–4992. [DOI] [PubMed] [Google Scholar]
- [134].Heinzmann SS; Brown IJ; Chan Q; Bictash M; Dumas ME; Kochhar S; Stamler J; Holmes E; Elliott P; Nicholson JK Metabolic profiling strategy for discovery of nutritional biomarkers: proline betaine as a marker of citrus consumption. Am. J. Clin. Nutr, 2010, 92, (2), 436–443. [DOI] [PMC free article] [PubMed] [Google Scholar]