

SUMMARY
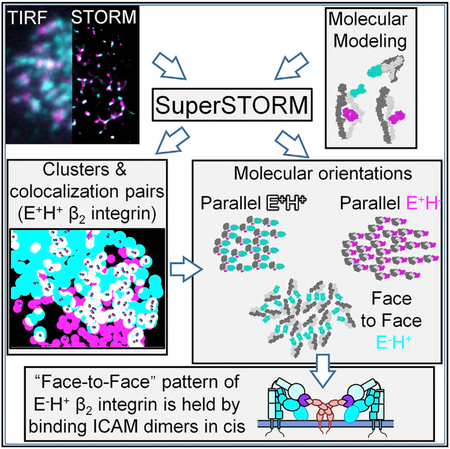
Leukocyte adhesion requires β2-integrin activation. Resting integrins exist in a bent-closed conformation—i.e., not extended (E−) and not high affinity (H−)—unable to bind ligand. Fully activated E+H+ integrin binds intercellular adhesion molecules (ICAMs) expressed on the opposing cell in trans. E−H− transitions to E+H+ through E+H− or through EH+, which binds to ICAMs on the same cell in cis. Spatial patterning of activated integrins is thought to be required for effective arrest, but no high-resolution cell surface localization maps of activated integrins exist. Here, we developed Super-STORM by combining super-resolution microscopy with molecular modeling to precisely localize activated integrin molecules and identify the molecular patterns of activated integrins on primary human neutrophils. At the time of neutrophil arrest, E−H+ integrins face each other to form oriented (non-random) nanoclusters. To address the mechanism causing this pattern, we blocked integrin binding to ICAMs in cis, which significantly relieved the face-to-face orientation.
Graphical Abstract
INTRODUCTION
As the most abundant leukocytes in blood, neutrophils play critical roles in infections (Gaertner et al., 2017; Huang and Niethammer, 2018) and inflammatory diseases (Tsuchiya et al., 2018). The recruitment of neutrophils during infection and inflammation involves many adhesion molecules, including integrins. In the recruitment cascade, neutrophils first roll and then arrest on the vascular endothelium. The arrest is triggered by the activation of β2-integrins (Ley et al., 2007; Phillipson and Kubes, 2011).
A study using quantitative dynamic footprinting (qDF) microscopy (Sundd et al., 2010) showed that activated β2-integrins are clustered on the neutrophil surface even before chemokine activation, i.e., during rolling (Fan et al., 2016). We used two monoclonal antibodies (mAbs) that report β2-integrin conformation. mAb KIM127 (Robinson et al., 1992) recognizes an epitope in the knee of β2 that is not accessible when the knee is bent and thus reports extension (E+) (Lu et al., 2001). mAb24 (Dransfield and Hogg, 1989) recognizes an epitope in the β2 I-like domain (A domain) that appears when the α I/A domain (A domain) assumes the high-affinity (H+) conformation (Yang et al., 2004). Neither antibody interferes with ligand binding, and KIM127 and mAb24 do not crossblock each other or affect neutrophil adhesion (Fan et al., 2016). Rolling on P-selectin induced clusters of KIM127+ E+H− β2-integrins. Exposure to the chemokine interleukin 8 (IL-8) induced mAb24 binding. We found that E−H+ (high-affinity bent) integrins bind to the β2-integrin ligands intercellular adhesion molecule 1 (ICAM-1) and ICAM-3 expressed on the same neutrophil in cis (Figure S1). By this cis binding, E−H+ integrins exert a strong anti-adhesion effect on both human and mouse neutrophils. The in cis interaction of Fc receptors (FcγRIIA) and β2-integrins (αMβ2) affects neutrophil recruitment as well (Saggu et al., 2018).
qDF is based on total internal reflection fluorescence (TIRF) microscopy and thus is diffraction limited. To determine whether apparent E+H+ clusters identified by qDF contain only E+H+ integrins or a mixture of E+H− and E−H+ integrins, and to reveal molecular patterns of integrin molecules, we performed super-resolution microscopy on primary human neutrophils labeled with Fab fragments of KIM127 and mAb24.
Super-resolution microscopy (Betzig et al., 2006; Rust et al., 2006) has brought new insights into integrin biology (Moore et al., 2018; Spiess et al., 2018). By using super-resolution interferometric photoactivation and localization microscopy (iPALM), E+ of lymphocyte function-associated 1 (LFA-1, one subtype of β2-integrins) was observed on spread Jurkat cells (Moore et al., 2018). In Hs578Tcells, active and inactive β1-integrins segregate into distinct nanoclusters in focal adhesions as visualized by stimulated emission depletion (STED) microscopy and stochastic optical reconstruction microscopy (STORM). Neither Jurkat nor Hs578T cells are primary; thus these cells are not directly relevant in vivo. Here, we report the first images and functional studies using super-resolution microscopy on primary cells, human neutrophils. To achieve sufficient resolution to reveal molecular patterns, we post-processed STORM data using custom software based on molecular modeling. This new imaging and computational method, called Super-STORM, dramatically improves the localization precision of molecules.
RESULTS
Super-Resolution Imaging Identifies β2-Integrin Activation within Clusters
To study β2-integrin activation in primary human neutrophils during arrest with super-resolution microscopy, we developed a strategy to fix the cells exactly at the time of their IL-8-triggered arrest (Figures S2A–S2C). Comparing qDF-based images of the footprint of arrested neutrophils with TIRF images of the same cells after fixation shows that there was no significant change in the morphology of the cell footprint after fixation (Figures S2D and S2E). During the sample preparation, fluorochrome-conjugated soluble Fabs of KIM127 and mAb24 were added with neutrophils during perfusion to homogenously bind to the activated integrin. Neither antibody interferes with ligand binding, and KIM127 and mAb24 do not crossblock each other or affect neutrophil adhesion (Fan et al., 2016). Adding KIM127 and mAb24 does not affect the phenotype of neutrophils (Figures S2F–S2I): quantified by forward scatter (FSC) and side scatter (SSC) in flow cytometry. IL-8 stimulation was used as a positive control. Conventional TIRF microscopy of the neutrophil footprints at the time of arrest showed maps (Figure 1A) of activated integrins labeled with KIM127 Fab fragments (indicating E+) and mAb24 Fab fragments (indicating H+), similar to what we reported previously (Fan et al., 2016). Processing the TIRF images using a smart segmentation algorithm (Fan et al., 2016) suggests large clusters of E−H+ integrins (cyan), E+H− integrins (magenta), and E+H+ integrins (white) (Figure 1B). The similarity of the integrin clusters obtained by TIRF and qDF suggests that (1) fixation did not introduce major changes in the distribution and expression of activated β2-integrins and (2) Fab fragments were similar to intact antibodies in their ability to label activated β2-integrins. To achieve high-resolution maps of activated β2-integrins in the footprint of arrested neutrophils, we applied STORM (Rust et al., 2006) (Figure 1C). The improved resolution is immediately obvious. We reasoned that E−H+ clusters mainly contained E−H+ integrins and E+H− clusters mainly contained E+H− integrins (Figure S3). This was the case, as revealed by STORM microscopy (Figures 1D–1F). We next hypothesized that E+H+ clusters identified by qDF microscopy might be of two types, either containing mainly E+H+ β2-integrins (true E+H+) or mixtures of E+H− and E−H+ integrins (false E+H+) (Figure S3). Analyzing the content of E+H+ TIRF clusters (Figures 1D, 1G, and 1H) revealed that two types of E+H+ clusters existed: some were dominated by E+H+ β2-integrins (Figure 1G), and others contained a mixture of E+H− and E−H+ integrins (Figure 1H). Quantification of six cells showed that around five E+H+ clusters were dominated by E+H+ β2-integrins and around ten E+H+ clusters were mixtures of E+H− and E−H+ integrins in each cell (Figure 1I).
Figure 1. Super-Resolution STORM Imaging of β2-Integrin Activation on Arrested Human Neutrophils.

(A) Primary human neutrophils rolling on P-selectin and ICAM-1 at a wall shear stress of 6 dyn·cm−2 were exposed to IL-8 and Fab fragments of the β2-integrin extension (E+) reporter KIM127 (magenta) and the high-affinity (H+) reporter mAb24 (cyan), immediately fixed and imaged by TIRF (entire TIRF footprint, raw image shown). The gray dotted line shows the border of the cell footprint.
(B) Binary image of (A) using smart segmentation, as in Fan et al. (2016).
(C) STORM buffer was introduced and blinking events were recorded for 10,000 frames per channel over 10 min, corrected for stochastic motion and drift as in STAR Methods to obtain a raw super-resolution STORM image of the footprint of arrested human neutrophils.
(D–H) STORM image overlaid with the outlines of binary TIRF clusters (D, from B). Zoomed-in examples of E−H+ (cyan, E) and E+H− TIRF clusters (magenta, F). Some white E+H+ TIRF clusters showed true colocalization of KIM127 and mAb24 in STORM (white, G). (H) shows examples of clusters that appeared colocalized in TIRF but were composed of E−H+ and E+H− areas, as revealed by STORM.
(I) Quantifications of different clusters from six cells. Mean ± SD. Scale bars are 1 μm for (A)–(D) and 200 nm for (E)–(H). See also Figures S2–S5.
To test whether integrin activation on other leukocytes is similar, we performed the same experiments on CCL2-stimulated arrested monocytes on a substrate of P-selectin and ICAM-1 (Figure S4). Similar to neutrophils, clusters of activated integrins were observed in both TIRF (Figures S4A and S4B) and STORM imaging of monocytes (Figure S4C). Clusters of E−H+ and E+H− integrins in the TIRF imaging were confirmed by STORM imaging (Figures S4D–S4F). Two types of E+H+ clusters were observed: some were dominated by E+H+ β2-integrins (Figure S4G), and others contained a mixture of E+H− and E−H+ integrins (Figure S4H).
Pointillism Map of Integrin Activation within the 50 nm Adhesion Zone to the Substrate
From STORM data, pointillism maps (Figures 2A–2C) can be constructed (Bon et al., 2015), where each point represents the most likely location of the peak of a two-dimensional Gaussian distribution of photons emanating from one fluorochrome (blinks). The location of the most likely position of the peaks of the Gaussians for KIM127 and mAb24 approach the molecular scale of β2-integrins (Figure 2D). The resolution of our STORM setup (localization precision, σ) was around 15 nm (Figure S5A). To resolve the location of individual integrin molecules (size ~20 × 10 × 5 nm), we used molecular modeling, taking advantage of the knowledge of the integrin shapes. First, we filtered the data for areas in which integrins could physically bind ligands in trans. Because the total length of an extended β2-integrin bound to ICAM-1 is ~50 nm (Fan et al., 2016; Moore et al., 2018), and microvilli on the surface of rolling neutrophils are up to ~200 nm high (Bruehl et al., 1996), only integrins on the tops of microvilli can reach (and bind) ICAM-1. Other integrin molecules on the sides of the microvilli or in the valleys between the microvilli are too far from the adhesive substrate to contribute to binding (Fan et al., 2016), even though they may be in the E+H+ conformation (Figure S6A). Because this study focuses on neutrophil arrest, we focused our attention on integrin molecules anchored in regions of the plasma membrane less than 50 nm from the adhesive substrate. We took advantage of how the intensity of the TIRF signal emanating from the homogeneous membrane label (CD16, a glycosylphosphatidylinositol [GPI]-anchored protein) monoexponentially decays with the distance from the substrate (Fan et al., 2016; Jung et al., 2016; Sundd et al., 2010, 2012). The signal from anti-CD16-Alexa Fluor 488 shows linear correlation with the intercalating membrane dye CellMask DeepRed (Figures S6B and S6C; Table S1), which was used in the previous study (Fan et al., 2016). From the membrane TIRF signal, we constructed a three-dimensional (3D) hills-and-valleys plot and gated it for a distance of 50 nm or less from the coverslip (Figure 2E; Figure S6D). Applying this 50 nm height gate to the entire footprint of neutrophils revealed that only ~15% of the neutrophil footprint was within 50 nm of the coverslip (Figures 2F–2H; Figure S7). Visual comparison of Figures 2G and 2H illustrates that most activated β2-integrins of all three conformations (E+H−, E−H+, and E+H+) are outside the reach of ICAM-1 in cis and thus irrelevant to arrest. Quantification shows that ~25% H+ and ~31% E+ β2-integrin molecules (Figures 2I and 2J; Figure S7) are located in the 15% surface area within 50 nm of the substrates and thus within reach of the ICAM-1 substrate.
Figure 2. Pointillism Map of H+ and E+ Locations within 50 nm of the Substrate Generated from STORM Imaging.

(A–C) Pointillism map of locations of H+ and E+ generated from STORM imaging (details in STAR Methods), with zoomed-in images in (B) (box in A) and (C) (box in B).
(D) Structures of three active conformations of β2-integrins (E−H+, cyan; E+H−, magenta; and E+H+, gray) at the same scale as (C).
(E) 3D topography of a neutrophil footprint generated from the TIRF image of anti-CD16-Alexa Fluor 488 (AF488), as in Fan et al. (2016) and Sundd et al. (2010, 2012). CD16 is a homogeneously distributed GPI-anchored protein. The area within 50 nm of the substrate is highlighted in red. The x, y, and z scales indicated.
(F) Distribution of distances between the neutrophil membrane and the coverslip substrate.
(G) STORM pointillism map (A) overlaid with white outlines showing the area within 50 nm of the substrate.
(H) Pointillism map gated for areas within 50 nm of the substrate.
(I and J) Distribution of distances between mAb24 blinks (I) and KIM127 blinks (J) within 50 nm of the substrate.
Scale bars are 1 μm for (A), (G), and (H); 200 nm for (B); and 30 nm for (C). Averaged distribution curves and the percentages within 50 nm (mean ± SD) of six cells shown in (F), (I), and (J). Histograms of each cell are shown in Figure S7. See also Figures S6–S8 and Tables S1 and S3.
Vascular endothelial cells also have microvilli and protrusions that potentially could fill the valleys of neutrophil microvilli (Whittall et al., 2013). To test whether integrins outside the range of 50 nm may contribute to arresting this, we repeated the experiment on human umbilical vein endothelial cell monolayers (HUVECs). Because endothelial cells are not compatible with TIRF-based methods like STORM, we analyzed the data using a different technique of super-resolution microscopy (Airyscan) (Figure S8). Clusters of E−H+ β2-integrins (data not shown), E+H− β2-integrins (data not shown), and E+H+ β2-integrins (blue) were observed that were similar to those in TIRF or STORM images. Endothelial cells have microvilli. However, there are only a few endothelial microvilli (~0.09 per μm2) (Figures S8B and S8C), as opposed to the neutrophil, where almost the whole surface is covered in microvilli (~3.7 per μm2) (Figure S8A). These data indicate that leukocyte microvilli dominate the integrin location but endothelial surface irregularities contribute.
Molecular Modeling-Based Image Processing Identified the Localization and Number of Activated Integrins
Next, we concentrated our attention on the orientation of these activated β2-integrins. Although the exact angle between an extended integrin and the membrane plane is not known (Moore et al., 2018), it is commonly assumed that a β2-integrin anchored in the plasma membrane at a distance of 50 nm from the coverslip must stand up, i.e., be oriented vertically, normal to the plasma membrane to bind ICAM-1 in trans. Thus, the microscopic image of such integrins is equivalent to the top view rather than a side view. We took advantage of the known structure of Fab fragments (Zhang et al., 2009) and modeled their binding to β2-integrins (Figures 3A–3E; Videos S1, S2, and S3). Figure 3A shows a schematic overview of the three β2-integrin conformations in side view: E−H+ (top), E+H− (middle), and E+H+ (bottom). These schematics are based on rotary shadowing electron microscopy (EM) images (Figure 3B; Figure S9) (Chen et al., 2010,2012). For clarity, the position of the mAb24 Fab is outlined in cyan and that of the KIM127 Fab is outlined in magenta. Because crystal structures of bent β2-integrins E−H− (Xie et al., 2010) and E−H+ (Sen et al., 2013) and the headpiece for E+H+ integrin (with a swung-out hybrid domain) (Zhu et al., 2008) are available (PDB: 3K6S, 4NEH, and 3FCU) and binding sites of mAb24 (Yang et al., 2004) and KIM127 (Lu et al., 2001) are known, we were able to construct ribbon diagrams (Figure 3C) and space-filling models (Figure 3D) of E−H+, E+H−, and E+H+ integrins. Because the shape of the three integrin conformations and the location of the bound Fab fragments are known and only the Fab fragments are labeled, their possible locations are constrained by the projection of the integrin molecules in the top view (Figure 3E).
Figure 3. Molecular Modeling for Improved Image Processing (Super-STORM).

(A–D) Side-view schematics of E−H+, E+H−, and E+H+ β2-integrins with KIM127 and mAb24 Fabs bound (A), EM images (B), ribbon (C), and space filling (D).
(E) Space-filling structure, top view; see also Videos S1, S2, and S3. EM images were adapted from Chen et al. (2010, 2012). The Fab of CBR LFA-1/2 in the EM images of E+H− and E+H+ and the ligand C3c in the EM image of E+H+ were removed with Photoshop for clarity (original images are shown in Figure S9). E−H+ β2-integrin is from the published crystal structure (PDB: 4NEH) (Sen et al., 2013); E+H− is modeled by unfolding the headpiece of E−H− (PDB: 3K6S) (Xie et al., 2010) to E+. For E+H+ modeling, the hybrid domain swing out is superposed (PDB: 3FCU) (Zhu et al., 2008). α chain is in gray, and β chain is in white. mAb24 and KIM127 Fabs are docked to their binding sites (Lu et al., 2001; Yang et al., 2004).
(F and G) Distance distributions of localizations emanating from the same Fab (open) or from Fabs bound to adjacent integrin molecules (filled) of mAb24 (F) or KIM127 (G), based on simulations of 64,000 randomly oriented integrin molecules.
(H) Zoomed-in pointillism map gated for areas within 50 nm of the substrate.
(I) Pointillism map after removing multiple blinks from (H), based on the cutoffs indicated in (F) and (G). The fields of view in (H) and (I) are the same as in Figure 2C. Scale bars are 10 nm for (A)–(E) and 30 nm for (H) and (I). See also Figures S5 and S9–S11, Tables S2 and S3, and Videos S1, S2, and S3.
In STORM, each fluorochrome can blink more than once (Sengupta et al., 2013), and each Fab fragment may contain more than one fluorochrome. To accurately count molecules, multiple blinks emanating from within the projection of each Fab were merged and considered to represent the same Fab fragment (Figure S5B). We modeled the distribution of distances of blinks emanating from the same Fab and compared it to the distribution of distances emanating from Fab fragments bound to adjacent β2-integrin molecules (Figures 3F and 3G). The distance distribution of blinks from Fabs bound to adjacent integrin molecules was obtained by modeling adjacent β2-integrin molecules (1,000 random simulations each of 64 adjacent conditions) (Figures S10A and S10B). For both mAb24 (Figure 3F) and KIM127 (Figure 3G), there was little overlap between the two distributions (Table S2). Thus, we used the crossing point of the two distributions to distinguish between photons emanating from the same Fab versus those from Fabs bound to adjacent integrin molecules: mAb24 signals within 7.3 nm of each other and KIM127 signals within 6.1 nm of each other were considered to have been derived from the same Fab. The projected area of the KIM127 Fab is slightly smaller, because the top view of the E+H− is smaller than that of the E−H+ β2-integrin (Figure 3E). Filtering all blinks in the pointillism map by the proximity criteria of 7.3 nmfor mAb24 and 6.1 nmfor KIM127 reduced the number of blinks within 50 nm of the coverslip from ~35,000 and ~17,000 to ~11,000 and ~10,000, respectively (compare Figures 3H and 3I). Because each Fab binds one epitope in β2, this method allows us to count the number of E+ (KIM127+) and H+ (mAb24+) integrin molecules. This number was determined for each of 100 microvilli (three cells) within 50 nm of the coverslip and showed on average 337 E+ and 897 H+ integrin molecules per microvillus (Table S3).
To independently verify this method, we compared the number of E+ (KIM127+) and H+ (mAb24+) STORM-based dots with the number of E+ and H+ integrins obtained by counting the activated integrin molecules in the neutrophil footprint based on calibrated flow cytometry (Figure S11). We used calibration beads with known numbers of antibody binding sites and expressed the footprint area as a percentage of total cell surface area. The number of mAb24 and KIM127 epitopes within 50 nm of the coverslip was estimated based on the surface maps (Fan et al., 2016) and yielded an average of ~12,000 mAb24 and ~21,000 KIM127 epitopes within 50 nm per footprint, similar to ~12,000 mAb24 and ~10,000 KIM127 epitopes within 50 nm obtained by direct molecule counting from STORM and molecular modeling.
Neutrophil arrest requires E+H+ β2-integrins binding ICAM-1 in trans (Alon and Feigelson, 2012; Fan et al., 2016). The E+H+ integrin molecules within reach of ICAM-1 (membrane within 50 nm of the coverslip) integrins have both KIM127 and mAb24 Fabs bound. If a KIM127 Fab and a mAb24 Fab are bound to the same integrin molecule, we call this a pair and consider that integrin to be in the E+H+ conformation. To distinguish E+H+ integrin molecules binding both KIM127 and mAb24, or a pair (Figure 3E, bottom), from adjacent E+H− and E−H+ integrins (Figure S10C), we compared the distributions of distances between KIM127 signals and mAb24 signals emanating from the same (filled gray curve) versus adjacent (open black curve) integrin molecules derived from simulations (Figure 4A). The crossover point between the two distributions was found to be at 8.2 nm. Thus, we considered all KIM127 signals within 8.2 nm of a mAb24 signal as evidence of a pair, i.e., an E+H+ integrin. We found about 4,600 E+H+ pairs on all microvillus tips within 50 nm of the coverslip. The E+H+ pairs accounted for 42% of all H+ and 46% of all E+ integrin molecules. The average determined from 100 microvilli (three cells) within 50 nm of the coverslip was 184 E+H+ integrin molecules per microvillus (Table S3). According to our numerical simulations (made in Comsol) (Marki et al., 2016) at a shear stress of 6 dyn·cim−2, the drag force on a neutrophil with ~9.9 μm diameter (acquired from bright-field imaging of human neutrophils) is ~430 pN. Therefore, at the time of neutrophil arrest, each microvillus provides an average of ~12.9 pN resisting force and each E+H+ integrin molecule supports a load of at least ~0.07 pN. A previous study (Nordenfelt et al., 2016) directly measured the force loaded on β2-integrins during Jurkat T cell migration using a fluorescence resonance energy transfer (FRET) tension sensor. The loading force per β2-integrin molecule during cell migration on ICAM-1 is ~1 pN and up to ~3 pN. This is an active force generated by the migrating cell that is not directly comparable with the force per β2-integrin molecule (imposed by the flow) during neutrophil arrest.
Figure 4. Molecular Modeling Defines the Colocalization of E+ and H+ and Clusters of E+H−, E−H+, and E+H+ b2-Integrins in the Footprint of Arrested Neutrophils by STORM Imaging.

(A) To find E+H+ β2-integrin molecules with both mAb24 and KIM127 Fabs bound, distances between fluorophores on the same molecules were modeled (gray curves with filled area, 100,000 iterations) and compared with distances from adjacent E−H+ and E+H−integrins (black curves with open area). The cutoff (crosses of the distributions) was 8.2 nm for pairs (KIM127 and mAb24 Fabs on the same integrin molecule).
(B and C) Clusters of mAb24 and KIM127 are defined based on distances of blinks obtained by random positioning of two adjacent integrins of the same type (64,000 iterations). Cumulative frequency of the randomly simulated distances of mAb24 events (B) or KIM127 events (C). To cover 99% of clustered integrins, a cutoff of 29.8 or 20.5 nm for mAb24 or KIM127, respectively, was determined.
(D–F) Binary cluster image of β2-integrin H+ (mAb24, cyan) and E+ (KIM127 Fab, magenta) on the footprint of a typical arrested human neutrophil. Overlaps between magenta and cyan are shown as white. Zoomed-in images in (E) (box in D) and (F) (box in E).
(G) The E+H+ pairs (based on cutoff defined in A) were overlaid on the binary cluster image in (F).
(H) Frequency of the E+H+ pairs in each of the binarized cluster types. Data were acquired from three neutrophil footprints. Scale bars are 1 μm for (D), 200 nm for (E), and 30 nm for (F) and (G). See also Figure S10 and Table S3.
Super-Resolution Clusters of Integrin Activation
Because integrins effectively operate as adhesion molecules localized in clusters (Fan et al., 2016; Ye et al., 2013), we next determined the sizes and shapes of clusters. Existing clustering algorithms (Andronov et al., 2016; Levet et al., 2015) require arbitrary cutoffs in molecular density or distance. Because we know the shape of the projection of integrin molecules, we were able to construct cumulative histograms of the distances between KIM127 Fabs and mAb24 Fabs (Figures 4B and 4C) based on modeling integrins densely (touching) clustered in random orientations (Figures S10A and S10B). Using this approach, we found that 99% of mAb24 Fabs on randomly oriented, adjacent touching integrin molecules were within 29.8 nm of each other (Figure 4B) and 99% of KIM127 Fabs on adjacent integrin molecules were within 20.5 nm of each other (Figure 4C). Therefore, clusters of mAb24+ (H+) integrins were defined by merging circles with a radius of 29.8 nm around each mAb24 signal, and clusters of KIM127+ (E+) integrins were defined by merging circles with a radius of 20.5 nm around each KIM127 signal. This resulted in clearly defined clusters of various sizes and shapes for both E+ and H+ integrins (Figures 4D–4F, 5A, and 5B). The STORM clusters show a higher degree of ellipticity, elongated and even branched shapes, significantly different from the shapes of clusters visible in TIRF microscopy (Figures 5A–5D). Thus, STORM resolved what TIRF microscopy had distorted into coarse rounded clusters (ellipticity closer to 1) because of insufficient resolution. Clusters of mAb24 were significantly larger than KIM127 clusters (p < 0.0001) (Figure 5E). STORM imaging identified significantly more clusters (Figures 5F and 5G), but significantly smaller clusters (Figures 5H–5K), than traditional TIRF imaging. In STORM imaging, most mAb24+ (~94%) and KIM127+ (~83%) events were clustered (Figure 5L). We next colored H+ clusters cyan and E+ clusters magenta. Where H+ clusters overlapped with E+ clusters, we assigned white (Figures 4D–4F). The comparison of the colocalization area (overlap of H+ and E+ clusters) in STORM and TIRF shows that TIRF imaging overestimated the colocalization (Figure 5M). Because we knew the location of the E+H+ pairs, we next asked how the location of these pairs was related to the white clusters (Figure 4G). About 93.2% of all E+H+ pairs were located within white clusters (Figure 4H).
Figure 5. Cluster Statistics of β2-Integrin Activation in STORM Imaging.

(A and B) H+ clusters(cyan, A) and E+ clusters (magenta, B) (larger than 5,000 nm2) were sorted (right to left, top to bottom) by their ellipticities. Scale bars are 1 μm. (C and D) Violin plots showing the ellipticity distribution of H+ clusters (C) and E+ clusters (D) in images of STORM and TIRF clusters.
(E) Histograms showing the size distribution of H+ STORM clusters (cyan) and E+ STORM clusters (magenta). p < 0.0001 in the Mann-Whitney test.
(F-K)The cluster number (F and G), size distributions (bean plots, Hand I), and total area of clusters (J and K) of H+ clusters (F, H, and J) and E+ clusters (G, I, and K) in STORM and TIRF imaging.
(L) Percentage of H+ and E+ within clusters.
(M) Total area of apparent (TIRF) and true (STORM) E+ and H+ colocalization.
Data of clusters were acquired from three cells. Mean ± SD, *p < 0.05, **p < 0.01, ****p < 0.0001 by Mann-Whitney test (C, D, H, and I) or Student’s t test (F, G, J, K, and M).
Spatial Patterns of Integrin Activation in Nanoclusters
We started from the null hypothesis that E+H−, E−H+, and E+H+ integrins might be oriented randomly within the clusters. To test this, we modeled the distances between mAb24 Fabs and KIM127 Fabs in randomly distributed E−H+ integrins (Figures 6A and 6D), E+H− integrins (Figures 6B and 6E), and E+H+ integrins (Figures 6C and 6F). The modeled distributions were compared to the measured distributions of distances in areas of the image where the resolution (σ of the localization accuracy Gaussian) was better than 7.3 nm. The measured distance distribution among E−H+ integrins (Figure 6D), E+H− integrins (Figure 6E), and E+H+ integrins (Figure 6F) did not match the prediction from the random simulation: The measured distances were closer than those predicted by the random orientation model. Thus, we conclude that activated integrins are not randomly oriented on the microvilli of neutrophils.
Figure 6. Molecular Pattern of β2-Integrin Activation.

(A–C) Typical space-filling top views of E−H+ β2-integrins (A), E+H− β2-integrins (B), and E+H+ β2-integrins (C) with random directions and orientations.
(D–I) Distance distributions of E−H+ integrins (σ % 7.3 nm) (D and G), E+H− integrins (E and H), and E+H+ integrins (F and I) in STORM images within 50 nm of the coverslip (dark cyan, magenta, or gray curves with open area, respectively) compared with distance distributions from random simulations (light cyan, magenta, or gray curves with filled area, respectively). The random simulations in (D)–(F) contain 64 conditions (8 directions × 8 orientations, 64,000 iterations each). The random simulations in (G) contain 16 face-to-face conditions. The random simulations in (H) and (I) contain 8 parallel conditions each.
(J–L) Examples showing space-filling E−H+ integrins (J) face to face, E+H− integrins (K), and E+H+ integrins (L) parallel, which best fit the observed distance distribution. Scale bars are all 10 nm.
Next, we asked what kind of non-random distribution might fit the observed molecular locations. We considered distribution that were face to face (Figures 6G, 6J, and 7A–7D), back to back (Figures 7A–7C), and parallel (Figures 6H, 6I, 6K, 6L, 7A–7C, 7G, and 7H). The face-to-face orientation (integrins facing each other, with the side of headpiece where the Fab fragments are bound) matched the experimental distance distribution of E−H+ (Figure 6G and cumulative histograms in Figure 7A). The random, parallel, and back-to-back orientations were not compatible with the data (Figure 7A). The parallel orientation, but not the random, face-to-face, or back-to-back orientations, matched the E+H− (Figures 6H, 6K, and 7B) and E+H+ clusters (Figures 6I, 6L, and 7C).
Figure 7. ICAMs Hold E−H+ β2-Integrin in a Face-to-Face Spatial Pattern.

(A–H) Distance cumulative frequency of E−H+ β2-integrins (A and D), E+H− β2-integrins (B and G), and E+H+ β2-integrins (C and H) in STORM images of arrested human neutrophils treated with isotype control (A, six cyan curves; B, six magenta curves; and C, six gray curves) or ICAM-1, ICAM-2, and ICAM-3 antibodies (D, six blue curves; G, six purple curves; and H, six gray curves) compared with cumulative distance histograms from random simulations (dark gray curve shows all conditions of random simulations, and black curves show face-to-face, parallel, and back-to-back conditions of random simulations indicated by labels in the graph).
(E) Model showing E−H+ β2-integrins binding ICAM-1 and ICAM-3 homodimers in cis.
(F, I, and J) Box and whiskers plot showing the median distance of E−H+ β2-integrins (F), E+ H− β2-integrins (I), and E+H+ β2-integrins (J) in STORM images of arrested neutrophils treated with isotype control or ICAM-1, ICAM-2, and ICAM-3 antibodies.
n = 6; n.s., not significant, p > 0.05; and **p < 0.01 by Student’s t test. See also Figure S1.
ICAMs Expressed on Neutrophils Hold EH+ β2-Integrin in a Face-to-Face Pattern
Because E−H+ integrins bind ICAMs in cis (Fan et al., 2016) (Figure S1) and functional ICAMs form dimers (Chen et al., 2007), we hypothesized that the face-to-face orientation of E−H+ integrins might be caused by E−H+ interaction with ICAMs (Figure 7E). If this is the case, blocking the interaction between E−H+ integrin and ICAMs should change the integrin spatial distribution. To test this, we blocked ICAM-1 (by mAb HA58 and R6.5), ICAM-2 (by mAb24 Center for Blood Research [CBR]-IC2/2), and ICAM-3 (by mAb CBR-IC3/1) on neutrophils. This resulted in a significant right-shift of the measured cumulative distance histograms, moving the ICAM-blocked histograms away from the face-to-face cumulative distance histogram (Figure 7D). Statistical analysis of the data (Figure 7F) showed a highly significant increase in the median distance between the isotype control (9.2 ± 0.2 nm) and the blocked ICAM (10.1 ± 0.1 nm). Blocking ICAMs did not affect the distance distribution (Figures 7G and 7H) or the median distance (Figures 7I and 7J) of E+H_ and E+H+ β2-integrins.
DISCUSSION
This study reports the first maps of activated integrins during arrest, the first use of STORM on integrin activation in primary human cells, and a new computational enhancement we call Super-STORM. First, we show that diffraction-limited (TIRF) clusters of KIM127+mAb24+-activated integrins contain E+H+ integrin molecules, which support arrest, and mixtures of E+H− and E−H+ integrins, which do not support arrest. Thus, the revised number of E+H+ integrin molecules required to arrest human neutrophils on P-selectin and ICAM-1 in response to immobilized IL-8 is 4,625 ± 369 molecules per neutrophil. Second, E−H+ integrins are forced into a face-to-face orientation by their interaction with ICAMs in cis, and blocking this interaction significantly relieves this constraint. Third, each fully activated E+H+ integrin molecule bears a load of 0.07 pN at 6 dyn·cm−2 fluid shear stress.
Two studies (Moore et al., 2018; Spiess et al., 2018) showed integrin activation in cell lines using super-resolution microscopy, but no study on primary cells has been published. The E+ conformation of β2-integrins was shown on spread Jurkat cells (Moore et al., 2018) using iPALM. iPALM has a similar lateral resolution to STORM and a high vertical resolution (<10 nm), which was able to reveal the vertical movement of molecules. However, applying the newly developed Super-STORM algorithm, our study achieved a better lateral resolution and thus a better way to interpret the spatial arrangement of activated integrins (Table S4). Moore et al. (2018) used a fluorescent protein to indicate the position of integrin headpieces and measured their movement toward the substrate to indicate the E+ conformation. This technique is similar to previous FRET techniques (Chigaev et al., 2015; Lefort et al., 2009) that report integrin E+. However, the conformational changes of β2-integrin H+ were not studied. In our study, we used Fabs of conformation reporter antibodies to monitor both E+ (KIM127+) and H+ (mAb24+). Moore et al. (2018) used Jurkat cell as a model to study integrin E+ but did not address high affinity. Furthermore, it remained unclear whether integrin E+ would be observed in primary human cells with similar dynamics. Here, we show significantly different spatial organizations of extended (E+H− and E+H+) integrins versus E−H+ integrins. Our study is the first visualizing the integrin activation on primary human cells using super-resolution imaging techniques. In addition, we extended the observations made in stationary spread cells (Moore et al., 2018) to the dynamic process of arrest from rolling, which is of high physiologic relevance for neutrophil recruitment from the bloodstream.
Besides the affinity change of single-integrin molecules, the spatial organization of integrins has been hypothesized to affect the avidity of ligand binding and cell adhesion (Ye et al., 2013). This organization has been demonstrated by the clustering of integrin on leukocytes (Fan et al., 2016) and platelets (Gaertner et al., 2017), and the formation of organized focal adhesions on epithelial cells (Spiess et al., 2018). Spiess et al. (2018) used super-resolution microscopy to investigate the spatial organization of β1-integrin activation in focal adhesions of Hs578T epithelial cells. They used both STED and STORM microscopy and found linear aligned nanoclusters (~40 nm in diameter) of β1-integrins within focal adhesions. They used conformation reporter antibodies to identify both active (12G10, similar to mAb24 for p2, and 9EG7, similar to KIM127 for β2) and inactive (AIIB2) forms of β1-integrins. Similar to our results for β2-integrins, they found that active and inactive β1-integrins segregate into distinct nanoclusters. However, their study was limited in that intact antibodies plus secondary antibodies were used for labeling. Thus, one integrin molecule might be labeled with two or more secondary antibodies. This introduces a substantial spatial uncertainty and masks the integrin spatial organization. Using secondary antibodies can also crosslink the integrin molecules and thereby generate artifacts like incorrect (induced) nanoclusters. In our study, we used directly labeled Fab fragments of antibodies to achieve superior resolution, avoid crosslinking, and make sure each Fab binds one integrin molecule. Our unbiased cluster identification algorithm is superior to the arbitrary 20-nm cutoff used in Spiess et al. (2018). Ours is the first study to reveal β2-integrin organization on microvilli at the molecular level.
In conclusion, we show that activated β2-integrins on primary neutrophils exist in patterned arrays. About 184 E+H+ integrin molecules per microvillus support 12.9 pN of force at 6 dyn·cm−2, or at least 0.07 pN per molecule. Clustered activated integrins are not randomly oriented. Specifically, E−H+ integrins are forced into a face-to-face orientation by their interaction with ICAMs dimers in cis. Blocking this interaction significantly changes the molecular pattern of activated integrins on the neutrophil surface. Super STORM appears to be a promising software tool to discover more examples of molecular patterning of adhesion and other molecules on biologically relevant primary cells.
STAR★METHODS
KEY RESOURCES TABLE
| REAGENT or RESOURCE | SOURCE | IDENTIFIER |
|---|---|---|
| Antibodies | ||
| Anti-human β2 integrin (clone mAb24) Fab | Biolegend | Customized |
| Anti-human β2 integrin (clone KIM127) | Lymphocyte Culture Center at the University of Virginia | Customized |
| anti-human CD16 (AF488, clone 3G8) | Biolegend | Cat# 302019; RRID:AB_492974 |
| anti-human CD16 (AF647, clone 3G8) | Biolegend | Cat# 302020; RRID:AB_492976 |
| Anti-human β2 integrin (AF488, clone mAb24) | Biolegend | Cat# 363404; RRID:AB_2565289 |
| anti-human CD14 (BV421, clone M5E2) | Biolegend | Cat# 325627; RRID:AB_2561342 |
| Biological Samples | ||
| Human blood from healthy donors | LJI | N/A |
| Chemicals, Peptides, and Recombinant Proteins | ||
| Recombinant human P-selectin-Fc | R&D Systems | Cat# 137-PS-050 |
| Recombinant human ICAM-1 -Fc | R&D Systems | Cat# 720-IC-050 |
| Recombinant human IL-8 | R&D Systems | Cat#208-IL-010 |
| Recombinant human CCL2 | Biolegend | Cat# 571402 |
| Recombinant human TNF-α | Biolegend | Cat# 570102 |
| Casein blocking buffer | Thermo Fisher | Cat# 37528 |
| Fluorescein (FITC) | Thermo Fisher | Cat# 46425 |
| CellTracker Orange CMRA | Thermo Fisher | Cat# C34551 |
| CellTrace Violet | Thermo Fisher | Cat# C34557 |
| CellMask DeepRed | Thermo Fisher | Cat# C10046 |
| Polymorphprep | Cosmo Bio | Cat# AXS-1114683 |
| Ficoll-Paque Plus | GE Healthcare | Cat# 17144003 |
| Human Serum Albumin (HSA) | Gemini | Cat# 800–120 |
| Paraformaldehyde | Thermo Fisher | Cat# 28906 |
| Glutaraldehyde | Sigma-Aldrich | Cat# G5882–10X1ML |
| Mercaptoethanolamine | Sigma-Aldrich | Cat# M9768–5G |
| Glucose Oxidase from Aspergillus niger | Sigma-Aldrich | Cat#49180 |
| Catalase from bovine liver | Sigma-Aldrich | Cat# C9322 |
| Critical Commercial Assays | ||
| Pierce Fab Preparation Kit | Thermo Fisher | Cat# 44985 |
| DyLight 550 Microscale Antibody Labeling Kit | Thermo Fisher | Cat# 84531 |
| DyLight 650 Microscale Antibody Labeling Kit | Thermo Fisher | Cat# 84536 |
| Quantum Simply Cellular anti-Mouse | Bangs Laboratories | Cat# 810 |
| EasySep Human Monocyte Enrichment Kit without CD16 Depletion | StemCell | Cat# 19058 |
| Endothelial SingleQuots Kit | Lonza | Cat# CC-4176 |
| Deposited Data | ||
| Raw data of E−H+ αxβ2 integrin crystal structure | Protein Data Bank | PDB: 4NEH |
| Raw data of Fab crystal structure | Protein Data Bank | PDB: 3HI6 |
| Raw data of E−H− αxβ2 integrin crystal structure | Protein Data Bank | PDB: 3K6S |
| Raw data of H+ αIIBβ3 integrin crystal structure | Protein Data Bank | PDB: 3FCU |
| Electron microscopy image of E+H+ β2 integrin | Chen et al., 2012 | N/A |
| Electron microscopy images of E− and E+ β2 integrin | Chen et al., 2010 | N/A |
| Experimental Models: Cell Lines | ||
| Hybridoma of KIM127 | ATCC | Cat# CRL-2838 RRID:CVCL_0F09 |
| HUVEC | ATCC | Cat# CRL-1730 RRID:CVCL_2959 |
| Primary human neutrophils | This paper | N/A |
| Primary human monocytes | This paper | N/A |
| Software and Algorithms | ||
| FIJI-lmage J2 | Rueden et al., 2017 | https://imagej.net/lmageJ2 |
| Imaris 9.0 | Bitplane | www.bitplane.com |
| Nikon STORM software | Nikon | N/A |
| Thunder STORM | Ovesný et al., 2014 | https://github.com/zitmen/thunderstorm |
| CCP4MG | McNicholas et al., 2011 | www.ccp4.ac.uk/MG |
| Prism 7 | GraphPad | graphpad.com |
| MATLAB | MathWorks | https://www.mathworks.com/products/matlab.html |
| Other | ||
| Roswell Park Memorial Institute (RPMI) medium 1640 without phenol red | Thermo Fisher | Cat# 11835055 |
| phosphate-buffered saline (PBS) without Ca2+ and Mg2+ | Thermo Fisher | Cat# 10010049 |
| Phenol Red Free Endothelial Cell Growth Basal Medium | Lonza | Cat# CC-3129 |
| μ-Slide VI 0.5 Glass Bottom chambers | ibidi | Cat#80607 |
CONTACT FOR REAGENT AND RESOURCE SHARING
Further information and requests for resources and reagents should be directed to and will be fulfilled by the Lead Contact, Klaus Ley (klaus@lji.org).
EXPERIMENTAL MODEL AND SUBJECT DETAILS
Human Neutrophil
Heparinized whole blood was obtained from healthy human donors after informed consent, as approved by the Institutional Review Board of the La Jolla Institute of Allergy & Immunology in accordance with the Declaration of Helsinki. Donors were randomly selected regardless of gender and age. Neutrophils were isolated by using Polymorphprep (a mixture of sodium metrizoate and Dextran 500) density gradient (Accurate Chemical) (Fan et al., 2016). Briefly, human blood was applied onto Polymorphprep, centrifuged at 500 × g for 35 min at 20–25°C, resulting in neutrophils concentrated in a layer between peripheral blood mononuclear cells and erythrocytes. After washing with PBS without Ca2+ and Mg2+ twice, neutrophils (> 95% purity by flow cytometry, no visible activation by microscopy) were re-suspended in RPMI-1640 without phenol red plus 2% HSA and were used within four hours. Neutrophils were incubated with FcR blocking reagents for ten minutes at room temperature (RT) prior to all the experiments.
Human Monocyte
Peripheral blood mononuclear cells (PBMCs) were isolated by using Ficoll-Paque Plus (GE Healthcare) density gradient. Briefly, human blood was applied onto Ficoll-Paque Plus, centrifuged at 400 × g for 35 min at 18–20°C, resulting in PBMCs concentrated in a layer between Ficoll and plasma. After washing with PBS without Ca2+ and Mg2+ twice and platelet removal (100 × g, 10 min), PBMCs were re-suspended in RPMI-1640 without phenol red plus 2% HSA. Monocytes were isolated using the EasySep Human Monocyte Enrichment Kit without CD16 Depletion from PBMCs following the manufactory’s instruction. Briefly, PBMCs were re-suspended at a concentration of 5 × 10⁷ mL−1 in a 5 mL polystyrene round-bottom tube. Enrichment Cocktails (50 μL·mL−1) were mixed with cell suspension and incubated for 10 min at RT. Magnetic Particles (50 μL·mL−1) were vortexed for 30 s, mixed with the sample and incubated for 5 min at RT. Samples were diluted with PBS without Ca2+ and Mg2+ to 2.5 mL. The tube was placed into the magnet and incubated for 5 min RT. Cells were poured into a new tube.
Human umbilical vein endothelial cells (HUVECs)
HUVECs (ATCC) were cultured in the Phenol Red Free Endothelial Cell Growth Basal Medium with proper supplements and growth factors (Endothelial SingleQuots Kit) in the presence of 5% CO2 and 37°C. Four days before the flow chamber experiment, 2 × 10⁵ HUVECs were seeded onto fibronectin (10 μg·mL−1, 4°C, overnight) coated μ-Slide VI 0.5 Glass Bottom chambers. TNF-α (10 ng·mL−1) was used to induce the expression of adhesion molecules on HUVECs two days before the experiment. HUVECs were labeled with 10 μM CellTrace Violet for 30 min at 37°C. After washes with medium, pre-warmed (37°C) neutrophils incubated with AF488-conjugated mAb24 (5 μg·ml−1), DL550-conjugated KIM127 (5 μg·ml−1), and AF647-conjugated anti-CD16 (1 μg·ml−1) antibodies were perfused through the HUVEC cultured flow chamber at a shear stress of 2 dyn·cm−2. Neutrophil arrest was induced by 10 ng·ml−1 IL-8. Cells were fixed by 8% PFA plus 0.05% glutaraldehyde. The super-resolution (~120 nm) four-color (excitation 405/488/561/633 nm, emission long-pass 450/516/579/654) confocal imaging of samples was performed by a Zeiss LSM 880 microscope equipped with a 63 × 1.40 NAoil immersion objective and an Airyscan super-resolution detector.
METHOD DETAILS
Microfluidic device
The assembly of the microfluidic devices used in this study and the coating of coverslips with recombinant human P-selectin-Fc and ICAM-1-Fc has been described previously(Fan et al., 2016; Sundd et al., 2010, 2011, 2012). Briefly, cleaned coverslips were coated with P-selectin-Fc (2 μg ml−1) and ICAM-1-Fc (10 μg ml−1) for 2 hours and then blocked for 1 hour with casein (1%) at RT. After coating, coverslips were sealed to polydimethylsiloxane (PDMS) chips by magnetic clamps to create flow chamber channels ~29 μm high and ~300 μm across. By modulating the pressure between the inlet well and the outlet reservoir, 6 dyn·cm−2 wall shear stress was applied in all experiments.
Microfluidic perfusion assay
To fix the neutrophils at the moment of arrest, the time of arrest upon IL-8 and the time of fixation upon PFA were assessed (STAR Methods; Figure 1). Isolated human primary neutrophils (5 × 10⁶ cells ml−1) were labeled with 10 μM CellTracker Orange CMRAat RT for 10 minutes and perfused in the microfluidic device over a substrate of recombinant human P-selectin-Fc and recombinant human ICAM-1-Fc at a shear stress of 6 dyn cm−2. IL-8 (10 ng ml−1) or PFA (8%) was mixed with FITC (1 μM) and perfused through the microfluidic flow chamber after cell rolling on the substrate. Dual-color epifluorescence imaging (CMRA and FITC) was recorded by an IX71 inverted research microscope (Olympus America) with a 40 x air objective to monitor the arrival of IL-8 or PFA by FITC and the stop (arresting by IL-8 or fixing by PFA) of neutrophils. The background mean fluorescence intensity (MFI) of FITC and the cell velocity was quantified by using FIJI-ImageJ2 (Rueden et al., 2017). Cell arrest was defined as the time when the velocity dropped below 0.1 μm s−1. IL-8 was added 12 s before PFA to achieve fixation at the moment of arrest (Figure S2).
To prepare for STORM microscopy, isolated human primary neutrophils (5 × 10⁶ cells ml−1) were incubated with fluorochrome-conjugated reporting Fabs (mAb24-DL550 and KIM127-DL650, 5 μg ml−1 each) for 3 minutes at RT and immediately perfused through the microfluidic device over a substrate of recombinant human P-selectin-Fc and recombinant human ICAM-1-Fc at a wall shear stress of 6 dyn cm−2 without separation of the unbound Fabs. After cells began rolling on the substrate, 10 ng ml−1 IL-8 was perfused for twelve seconds, then 8% PFA was perfused for five minutes to fix the cells at the time of arrest. After washing with the medium (RPMI-1640 without phenol red + 2% HSA) for five minutes, Fabs (mAb24-DL550and KIM127-DL650, 5 μg ml−1 each) were perfused again to saturate the staining of active epitopes. Coverslips were disassembled from the microfluidic device and mounted with the STORM buffer on a glass slide prior to imaging. The monocyte protocol followed the neutrophil protocol except that IL-8 was replaced by 10 ng ml−1 CCL2.
Super-STORM
The workflow of experimental and image processing procedures are shown in Figure S12. The comparison of TIRF, STORM and Super-STORM is shown in Table S4. Details including STORM setup and imaging, molecular modeling, and imaging processing are described below.
STORM setup and imaging
Images were captured using 100 × 1.49 NA Apo TIRF objective with TIRF (80° incident angle) illumination on a Nikon Ti super-resolution microscope. Images were collected on an ANDOR IXON3 Ultra DU897 EMCCD camera using the multicolor sequential mode setting in the NIS-Elements AR software (Nikon Instruments Inc., NY). Power on the 488, 561, and 647-nm lasers was adjusted to 50% to enable collection of between 100 and 300 blinks per 256 × 256 pixel camera frame in the center of the field at appropriate threshold settings for each channel. The collection was set to 20,000 frames, yielding 1–2 million molecules.
Molecular Modeling
CCP4MG (http://www.ccp4.ac.uk/MG) is used in structural modeling and generating figures (McNicholas et al., 2011). We used the published structure of E−H+ β2 integrin extracellular domains (PDB: 4NEH) (Sen et al., 2013) and modeled a Fab (PDB: 3HI6) on the binding site of mAb24 (Yang et al., 2004). For the structure of E+H− β2 integrin, published E−H− β2 integrin extracellular domains (PDB: 3K6S) (Xie et al., 2010) were adjusted to model an extended headpiece. Modeled structures were matched to EM images of E+ β2 integrin(Chen et al., 2010). A Fab was modeled to the binding site of KIM127(Lu et al., 2001). For the structure of E+H+ β2 integrin, the hybrid domain swing out of E−H+ β2 integrin (PDB: 4NEH) was superposed with the open headpiece of integrin αIIBβ3 (PDB: 3FCU)(Zhu et al., 2008). To match EM images of E+H+ β2 integrin (Chen et al., 2012), the headpiece was unbent, the membrane-proximal ends of integrin α and β chains were modeled close to each other, and the membrane-distal ends of integrin α and β tailpieces were modeled linked to the membrane-proximal ends of integrin α and β headpieces. Two Fabs were modeled to the binding sites of mAb24 (Yang et al., 2004) and KIM127 (Lu et al., 2001). Two-dimensional STORM data were acquired and the distances of bound Fabs were estimated in the top view projection.
Image processing - generation of STORM pointillisms
The super-resolution localizations were reconstructed with the Nikon STORM software (Huang et al., 2008). Positions of individual blinks have been localized with high accuracy by switching them on and off sequentially using the 488, 561, and 647-nm lasers at appropriate power settings. Fitting the histograms of beads with Gaussians gave standard deviations of 17.25 nm and 15.88 nm for the DL550 channel in the x and y directions, respectively. Analogous values for the DL650 channel were 15.68 nm and 14.97 nm (Figure S5A). The positions determined from multiple switching cycles can show a substantial drift over the duration of the acquisition. This error is considerably reduced by correcting for sample drift over the course of the experiment by an autocorrelation method reconstructed from 200–1000 frames (implemented in the Nikon software) (Huang et al., 2008). The number of frames used in a set is based on the number of blinks identified, with a default setting of 10,000 blinks. Displacement is corrected by translation and rotation in the X and Y directions for 2D STORM. Axial drift over the course of the acquisition is minimized by engaging the Nikon Perfect Focus System. Calibration of chromatic shift (warp correction) was carried out using a multicolored 100nm TetraSpeck beads using at least 100 beads per field. Calibration for warp correction for 2D STORM was executed using the 2D warp calibration feature of the Nikon STORM software. Briefly, a total of 201 images were collected for each channel (488, 561 and 647nm) without the cylindrical lens in place. Frames 1–20 and frames 182–201 are collected at the focal position. Frames 21–181 are collected across a range of 1.6 microns in 10 nm steps in the Z (covering 800 nm above and 800 nm below the focal plane). The calibration files generated from this software feature were applied during analysis for the correction of the STORM images. Blinking events were followed for successive frames to filter out blinks generating traces longer than five frames during analysis. Furthermore, only molecules with a point spread function (PSF) of 200–400nm (based on a 100× 1.49 objective) and a photon count above 100 (based on camera noise of the ANDOR EMCCD) were retained. The data was further filtered based on empirical observation of photon count signals (peak height when converted to an intensity value) found in cells versus background staining on the glass slide surface (generally values above 300–700 intensity units above camera noise). The precision of the localization during a switching cycle is calculated from these parameters and from photon counts using molecules that are ultimately well separated in the sample itself (Huang et al., 2008; Rust et al., 2006; Thompson et al., 2002). After getting the datasheet of the blink events, Imaris was used to generate the pointillism map (Figures 2A–2C).
Image processing - filtering the blinks within reach of the substrate
Neutrophils have microvilli that are up to ~200 nm high(Bruehl et al., 1996) and the sum of the length of an extended β2 integrin and its ligand ICAM-1-Fc is ~50 nm(Fan et al., 2016; Moore et al., 2018). Only integrins on the “tops” of microvilli can reach (and bind) ICAM-1, and other integrins on the “sides” of the microvilli or in the “valleys” between the microvilli are too far from the adhesive substrate to contribute to binding (Fan et al., 2016), even though such integrin molecules may be in the fully activated E+H+ conformation that could bind ligand in trans if they could reach it (Figure S6A). Only β2 integrins that could physically bind ICAM-1 in trans can contribute to arrest. Since the intensity of the TIRF signal emanating from the homogeneous membrane label (CD16, a Glycosylphosphatidylinositol (GPI)-anchored protein) mono-exponentially decays with the distance from the substrate (Fan et al., 2016; Jung et al., 2016; Sundd et al., 2010, 2012), we used CD16-AF488 intensity to construct a three-dimensional (3D) “hills and valleys” plot. We filtered for mAb24 and KIM127 Fab signals that were in areas in which the CF16 signal was within 50 nm of the coverslip (Figure 2D; Figure S6D). By using such a narrow slice, we select only the “tips” of microvilli which form planes nearly parallel to the coverslips (Figure S6). Integrin molecules anchored in the membrane plane are approximately normal to the coverslip, which guided our top-view molecular modeling (Videos S1, S2, and S3). Imaris was used to generate the pointillism maps after the proximity filtering (Figures 2A–2C and 3H).
Image processing - eliminating multiple blinks from each Fab
Because multiple blinks of the same fluorochrome may be recorded during STORM imaging, and one Fab may be labeled with several fluorochromes, it is necessary to merge these blinks to one Fab event for further analysis. We used molecular modeling to find which blinks likely represent the same Fab molecule. First, we modeled the structure of various β2 integrins with Fab molecules attached as described above.
To find the cut-off for merging blinks, fluorochromes were placed randomly in each Fab, and the projection of their distance in the plane of the coverslip was recorded. 100,000 simulations generated the distribution of the distance of the fluorochromes residing in the same Fab (Figures 3F and 3G, the curve with dark cyan and magenta line and open area).
This was repeated for blinks emanating from two fluorochromes located in Fabs bound to two different but adjacent integrin molecules. In each simulation, integrins are closely packed (allowed to touch), but randomly oriented. We tested eight positions of the second integrin molecule relative to the first integrin molecule (top, bottom, left, right, top-left, top-right, bottom-left, bottom-right) and eight orientations (one of the integrins was rotated by 0°, 45°, 90°, 135°, 180°, 225°, 270°, 315° about the z axis), totaling 64 conditions for the relative position of the two integrins. One thousand random simulations were done for each of these conditions. These 64,000 simulations yielded the distribution of the distance of blinks emanating from fluorochromes in two Fabs bound to adjacent integrins (Figures 3F and 3G, the curve with light cyan and magenta line and closed area). The cross of the two distributions was used as the cut-off for merging. 99.1% or 96.8% of blinks truly emanating from the same mAb24 or KIM127 Fab, respectively, and 7.8% or 11.5% of blinks emanating from mAb24 or KIM127 Fabs, respectively, bound to adjacent integrin molecules were correctly assigned. ThunderSTORM (Ovesný et al., 2014) was used to eliminate the multiple blinks in the same Fab within the calculated distance threshold. Imaris was used to generate the pointillism map after eliminating multiple blinks (Figure 3I).
Image processing – colocalization
To obtain the molecular cut-off for colocalized pairs, i.e., the E+H+ integrin molecules with both mAb24 and KIM127 Fabs bound, two new random simulations were performed. If a KIM127 and a mAb24 Fab are bound to the same E+H+ integrin, the blinks emanating from their fluorochromes were assigned the range of possible positions in the projection of the coverslip plane. In each simulation, a fluorochrome is randomly placed in the KIM127 Fab and another in the mAb24 Fab, and the distances are calculated. 100,000 such simulations yielded the distribution of the distances of blinks emanating from fluorochromes in KIM127 and mAb24 Fabs on the same E+H+ integrin (Figure 4A, the curve with gray line and closed area). For KIM127 and mAb24 Fabs are bound to adjacent E+H−and E−H+ integrin molecules, a second distance distribution is generated. Similar to the approach used above, the integrin molecules (E+H−and E−H+) are closely packed and randomly positioned and oriented, totaling 64 conditions for the relative position of the two integrins. 64,000 random simulations (1,000 for each position and orientation) yield the distribution of the distances of blinks emanating from KIM127 and mAb24 Fabs bound to adjacent E+H−and E−H+ integrins (Figure 4A, the curve with black line and open area). The cross of the two distributions was used as the cut-off for merging. 93.8% of KIM127-mAb24 pairs truly emanating from the same integrin and 14.4% of KIM127-mAb24 pairs from Fabs bound to adjacent integrin molecules were correctly assigned. KIM127-mAb24 pairs were identified with a custom MATLAB algorithm. Briefly, KIM127 and mAb24 mutual nearest neighbor pairs (where a KIM127+ molecule and a mAb24+ integrin molecule identify each other as their nearest neighbors of the other species) were found using “KdTreeSearcher” in MATLAB. These pairs were filtered from the list of H+ and E+ positions, and then the nearest neighbor search was repeated until no new pairs were identified. Only those pairs with a separation distance less than the calculated threshold (8.2 nm) were kept for the final calculation. Imaris was used to generate the image of colocalization pairs (Figure 4G).
Image processing – clustering
To define clusters, we constructed circles around the most likely center of each KIM127 and each mAb24 signal with radii (20.5 and 29.8 nm, respectively) that enclosed 99% of all distances between adjacent integrins from the random simulations (Figures 4B and 4C). The integrins in circles touching or overlapping a circle of its same kind (KIM127+ or mAb24+, respectively) were considered to be in clusters. Thus, a cluster could be as small as two and as large as thousands of integrin molecules. These STORM-based binary clusters (Figures 4D–4G) were generated by masking from the pointillism map (with the diameters of the above clustering cut-off) after eliminating multiple blinks (with the diameter as the cluster cut-off) in Imaris. Sizes, ellipticities, number of clusters and cluster areas (Figure 5) were obtained in Imaris.
QUANTIFICATION AND STATISTICAL ANALYSIS
Statistical analysis was performed with Prism 7 (GraphPad). Data are presented as violin plots (Figures 5C and 5D), bean plots (Figures 5H and 5I) (Kampstra, 2008), Box and whiskers plot (Figures 7F, 7I, and 7J; Figures S2H and S2I), mean ± SD (Figures 1I, 5F, 5G, and 5J–5M; Figures S2A and S2B), distributions (Figures 2F, 2I, 2J, 3F, 3G, 4A, 5E, and 6D–6I; Figures S5A, S7, and S10) and cumulative distributions (Figures 4B, 4C, 7A–7D, 7G, and 7H), pie chart (Figure 4H). The means for the datasets were compared using paired Student’s t tests with equal variances (Figures 5F, 5G, 5J–5M, 7F, 7I, and 7J), one-way ANOVA test (Figures S2H and S2I), or Mann-Whitney test (Figures 5C–5E, 5H, and 5I). P values less than 0.05 were considered significant.
DATA AND SOFTWARE AVAILABILITY
The data that support the findings of this study are available from the corresponding author upon request. The raw datasets are large (gigabytes each) and require special data transfer arrangements.
Supplementary Material
Highlights.
Super-resolution map of β2-integrin activation on human neutrophils during arrest
Developed Super-STORM to visualize single-integrin molecules and their conformation
High-affinity bent β2-integrin molecules face each other
The face-to-face pattern is held by in cis binding to ICAM dimers
ACKNOWLEDGMENTS
This research was supported by funding from the NIH (HL078784, DK48549, and S10OD021831) and a WSA postdoctoral fellowship and the Career Development Award from the American Heart Association (AHA) (16POST31160014 and 18CDA34110426). We acknowledge Dr. Sara McArdle from the Microscopy Core Facility, La Jolla Institute for Immunology, for coding the custom scripts on MATLAB used in this study. We acknowledge Dr. Yunmin Jung from the Division of Inflammation Biology, La Jolla Institute for Immunology, for assessing the resolution of the STORM microscope. We acknowledge both Dr. Sara McArdle and Dr. Zbigniew Mikulski from the Microscopy Core Facility, La Jolla Institute for Immunology, for providing help with image processing and acquisition. We acknowledge Dr. Kersi Pestonjamasp from the Moores Cancer Center, University of California, San Diego, for the maintenance and calibration of the STORM microscope and for helping us with the data acquisition and analysis.
Footnotes
SUPPLEMENTAL INFORMATION
Supplemental Information includes twelve figures, four tables, and three videos and can be found with this article online at https://doi.org/10.1016/j.celrep.2018.12.038.
DECLARATION OF INTERESTS
The authors declare no competing interests.
REFERENCES
- Alon R, and Feigelson SW (2012). Chemokine-triggered leukocyte arrest: force-regulated bi-directional integrin activation in quantal adhesive contacts. Curr. Opin. Cell Biol. 24, 670–676. [DOI] [PubMed] [Google Scholar]
- Andronov L, Orlov I, Lutz Y, Vonesch JL, and Klaholz BP (2016). ClusterViSu, a method for clustering of protein complexes by Voronoi tessellation in super-resolution microscopy. Sci. Rep 6, 24084. [DOI] [PMC free article] [PubMed] [Google Scholar]
- Betzig E, Patterson GH, Sougrat R, Lindwasser OW, Olenych S, Bonifacino JS, Davidson MW, Lippincott-Schwartz J, and Hess HF (2006). Imaging intracellular fluorescent proteins at nanometer resolution. Science 313, 1642–1645. [DOI] [PubMed] [Google Scholar]
- Bon P, Bourg N, Lécart S, Monneret S, Fort E, Wenger J, and Lévêque-Fort S (2015). Three-dimensional nanometre localization of nanoparticles to enhance super-resolution microscopy. Nat. Commun 6, 7764. [DOI] [PMC free article] [PubMed] [Google Scholar]
- Bruehl RE, Springer TA, and Bainton DF (1996). Quantitation of L-selectin distribution on human leukocyte microvilli by immunogold labeling and electron microscopy. J. Histochem. Cytochem 44, 835–844. [DOI] [PubMed] [Google Scholar]
- Chen X, Kim TD, Carman CV, Mi LZ, Song G, and Springer TA (2007). Structural plasticity in Ig superfamily domain 4 of ICAM-1 mediates cell surface dimerization. Proc. Natl. Acad. Sci. USA 104, 15358–15363. [DOI] [PMC free article] [PubMed] [Google Scholar]
- Chen X, Xie C, Nishida N, Li Z, Walz T, and Springer TA (2010). Requirement of open headpiece conformation for activation of leukocyte integrin alphaXbeta2. Proc. Natl. Acad. Sci. USA 107, 14727–14732. [DOI] [PMC free article] [PubMed] [Google Scholar]
- Chen X, Yu Y, Mi LZ, Walz T, and Springer TA (2012). Molecular basis for complement recognition by integrin αXβ2. Proc. Natl. Acad. Sci. USA 109, 4586–4591. [DOI] [PMC free article] [PubMed] [Google Scholar]
- Chigaev A, Smagley Y, Haynes MK, Ursu O, Bologa CG, Halip L, Oprea T, Waller A, Carter MB, Zhang Y, et al. (2015). FRET detection of lymphocyte function-associated antigen-1 conformational extension. Mol. Biol. Cell 26, 43–54. [DOI] [PMC free article] [PubMed] [Google Scholar]
- Dransfield I, and Hogg N (1989). Regulated expression of Mg2+ binding epitope on leukocyte integrin alpha subunits. EMBO J. 8, 3759–3765. [DOI] [PMC free article] [PubMed] [Google Scholar]
- Fan Z, McArdle S, Marki A, Mikulski Z, Gutierrez E, Engelhardt B, Deutsch U, Ginsberg M, Groisman A, and Ley K (2016). Neutrophil recruitment limited by high-affinity bent β2 integrin binding ligand in cis. Nat. Commun 7, 12658. [DOI] [PMC free article] [PubMed] [Google Scholar]
- Gaertner F, Ahmad Z, Rosenberger G, Fan S, Nicolai L, Busch B, Yavuz G, Luckner M, Ishikawa-Ankerhold H, Hennel R, et al. (2017). Migrating platelets are mechano-scavengers that collect and bundle bacteria. Cell 171, 1368–1382. [DOI] [PubMed] [Google Scholar]
- Huang C, and Niethammer P (2018). Tissue damage signaling is a prerequisite for protective neutrophil recruitment to microbial infection in zebrafish. Immunity 48, 1006–1013. [DOI] [PMC free article] [PubMed] [Google Scholar]
- Huang B, Wang W, Bates M, and Zhuang X (2008). Three-dimensional super-resolution imaging by stochastic optical reconstruction microscopy. Science 319, 810–813. [DOI] [PMC free article] [PubMed] [Google Scholar]
- Jung Y, Riven I, Feigelson SW, Kartvelishvily E, Tohya K, Miyasaka M, Alon R, and Haran G (2016). Three-dimensional localization of T-cell receptors in relation to microvilli using a combination of superresolution microscopies. Proc. Natl. Acad. Sci. USA 113, E5916–E5924. [DOI] [PMC free article] [PubMed] [Google Scholar]
- Kampstra P (2008). Beanplot: a boxplot alternative for visual comparison of distributions. J. Stat. Softw 28, 9. [Google Scholar]
- Lefort CT, Hyun Y-M, Schultz JB, Law F-Y, Waugh RE, Knauf PA, and Kim M (2009). Outside-in signal transmission by conformational changes in integrin Mac-1. J. Immunol 183, 6460–6468. [DOI] [PMC free article] [PubMed] [Google Scholar]
- Levet F, Hosy E, Kechkar A, Butler C, Beghin A, Choquet D, and Sibarita JB (2015). SR-Tesseler: a method to segment and quantify localization-based super-resolution microscopy data. Nat. Methods 12, 1065–1071. [DOI] [PubMed] [Google Scholar]
- Ley K, Laudanna C, Cybulsky MI, and Nourshargh S (2007). Getting to the site of inflammation: the leukocyte adhesion cascade updated. Nat. Rev. Immunol 7, 678–689. [DOI] [PubMed] [Google Scholar]
- Lu C, Ferzly M, Takagi J, and Springer TA (2001). Epitope mapping of antibodies to the C-terminal region of the integrin beta 2 subunit reveals regions that become exposed upon receptor activation. J. Immunol 166, 5629–5637. [DOI] [PubMed] [Google Scholar]
- Marki A, Gutierrez E, Mikulski Z, Groisman A, and Ley K (2016). Micro-fluidics-based side view flow chamber reveals tether-to-sling transition in rolling neutrophils. Sci. Rep 6, 28870. [DOI] [PMC free article] [PubMed] [Google Scholar]
- McNicholas S, Potterton E, Wilson KS, and Noble ME (2011). Presenting your structures: the CCP4mg molecular-graphics software. Acta Crystallogr. D Biol. Crystallogr 67, 386–394. [DOI] [PMC free article] [PubMed] [Google Scholar]
- Moore TI, Aaron J, Chew TL, and Springer TA (2018). Measuring integrin conformational change on the cell surface with super-resolution microscopy. Cell Rep. 22, 1903–1912. [DOI] [PMC free article] [PubMed] [Google Scholar]
- Nordenfelt P, Elliott HL, and Springer TA (2016). Coordinated integrin activation by actin-dependent force during T-cell migration. Nat. Commun 7, 13119. [DOI] [PMC free article] [PubMed] [Google Scholar]
- Ovesný M, Křížek P, Borkovec J, Svindrych Z, and Hagen GM (2014). ThunderSTORM: a comprehensive ImageJ plug-in for PALM and STORM data analysis and super-resolution imaging. Bioinformatics 30, 2389–2390. [DOI] [PMC free article] [PubMed] [Google Scholar]
- Phillipson M, and Kubes P (2011). The neutrophil in vascular inflammation. Nat. Med 17, 1381–1390. [DOI] [PMC free article] [PubMed] [Google Scholar]
- Robinson MK, Andrew D, Rosen H, Brown D, Ortlepp S, Stephens P, and Butcher EC (1992). Antibody against the Leu-CAM beta-chain (CD18) promotes both LFA-1- and CR3-dependent adhesion events. J. Immunol 148, 1080–1085. [PubMed] [Google Scholar]
- Rueden CT, Schindelin J, Hiner MC, DeZonia BE, Walter AE, Arena ET, and Eliceiri KW (2017). ImageJ2: ImageJ for the next generation of scientific image data. BMC Bioinformatics 18, 529. [DOI] [PMC free article] [PubMed] [Google Scholar]
- Rust MJ, Bates M, and Zhuang X (2006). Sub-diffraction-limit imaging by stochastic optical reconstruction microscopy (STORM). Nat. Methods 3, 793–795. [DOI] [PMC free article] [PubMed] [Google Scholar]
- Saggu G, Okubo K, Chen Y, Vattepu R, Tsuboi N, Rosetti F, Cullere X, Washburn N, Tahir S, Rosado AM, et al. (2018). Cis interaction between sialylated FcγRIIA and the αI-domain of Mac-1 limits antibody-mediated neutrophil recruitment. Nat. Commun 9, 5058. [DOI] [PMC free article] [PubMed] [Google Scholar]
- Sen M, Yuki K, and Springer TA (2013). An internal ligand-bound, metastable state of a leukocyte integrin, αxβ2. J. Cell Biol. 203, 629–642. [DOI] [PMC free article] [PubMed] [Google Scholar]
- Sengupta P, Jovanovic-Talisman T, and Lippincott-Schwartz J (2013). Quantifying spatial organization in point-localization super-resolution images using pair correlation analysis. Nat. Protoc 8, 345–354. [DOI] [PMC free article] [PubMed] [Google Scholar]
- Spiess M, Hernandez-Varas P, Oddone A, Olofsson H, Blom H, Waithe D, Lock JG, Lakadamyali M, and Strömblad S (2018). Active and inactive β1 integrins segregate into distinct nanoclusters in focal adhesions. J. Cell Biol. 217, 1929–1940. [DOI] [PMC free article] [PubMed] [Google Scholar]
- Sundd P, Gutierrez E, Pospieszalska MK, Zhang H, Groisman A, and Ley K (2010). Quantitative dynamic footprinting microscopy reveals mechanisms of neutrophil rolling. Nat. Methods 7, 821–824. [DOI] [PMC free article] [PubMed] [Google Scholar]
- Sundd P, Gutierrez E, Petrich BG, Ginsberg MH, Groisman A, and Ley K (2011). Live cell imaging of paxillin in rolling neutrophils by dual-color quantitative dynamic footprinting. Microcirculation 18, 361–372. [DOI] [PMC free article] [PubMed] [Google Scholar]
- Sundd P, Gutierrez E, Koltsova EK, Kuwano Y, Fukuda S, Pospieszalska MK, Groisman A, and Ley K (2012). ‘Slings’ enable neutrophil rolling at high shear. Nature 488, 399–403. [DOI] [PMC free article] [PubMed] [Google Scholar]
- Thompson RE, Larson DR, and Webb WW (2002). Precise nanometer localization analysis for individual fluorescent probes. Biophys. J 82, 2775–2783. [DOI] [PMC free article] [PubMed] [Google Scholar]
- Tsuchiya M, Sekiai S, Hatakeyama H, Koide M, Chaweewannakorn C, Yaoita F, Tan-No K, Sasaki K, Watanabe M, Sugawara S, et al. (2018). Neutrophils provide a favorable IL-1-mediated immunometabolic niche that primes GLUT4 translocation and performance in skeletal muscles. Cell Rep. 23, 2354–2364. [DOI] [PubMed] [Google Scholar]
- Whittall C, Kehoe O, King S, Rot A, Patterson A, and Middleton J (2013). A chemokine self-presentation mechanism involving formation of endothelial surface microstructures. J. Immunol 190, 1725–1736. [DOI] [PMC free article] [PubMed] [Google Scholar]
- Xie C, Zhu J, Chen X, Mi L, Nishida N, and Springer TA (2010). Structure of an integrin with an alphaI domain, complement receptor type 4. EMBO J. 29, 666–679. [DOI] [PMC free article] [PubMed] [Google Scholar]
- Yang W, Shimaoka M, Chen J, and Springer TA (2004). Activation of integrin beta-subunit I-like domains by one-turn C-terminal alpha-helix deletions. Proc. Natl. Acad. Sci. USA 101, 2333–2338. [DOI] [PMC free article] [PubMed] [Google Scholar]
- Ye F, Petrich BG, Anekal P, Lefort CT, Kasirer-Friede A, Shattil SJ, Ruppert R, Moser M, Fassler R, and Ginsberg MH (2013). The mechanism of kindlin-mediated activation of integrin αIIbβ3. Curr. Biol 23, 2288–2295. [DOI] [PMC free article] [PubMed] [Google Scholar]
- Zhang H, Liu JH, Yang W, Springer T, Shimaoka M, and Wang JH (2009). Structural basis of activation-dependent binding of ligand-mimetic antibody AL-57 to integrin LFA-1. Proc. Natl. Acad. Sci. USA 106, 18345–18350. [DOI] [PMC free article] [PubMed] [Google Scholar]
- Zhu J, Luo BH, Xiao T, Zhang C, Nishida N, and Springer TA (2008). Structure of a complete integrin ectodomain in a physiologic resting state and activation and deactivation by applied forces. Mol. Cell 32, 849–861. [DOI] [PMC free article] [PubMed] [Google Scholar]
Associated Data
This section collects any data citations, data availability statements, or supplementary materials included in this article.
Supplementary Materials
Data Availability Statement
The data that support the findings of this study are available from the corresponding author upon request. The raw datasets are large (gigabytes each) and require special data transfer arrangements.