Abstract
The activities of hundreds, perhaps thousands, of metabolites are regulated by human cytosolic sulfotransferases (SULTs) – a 13-member family of disease relevant enzymes that catalyze transfer of the sulfuryl moiety (-SO3) from PAPS (3′-phosphoadenosine 5′-phosphosulfonate) to the hydroxyls and amines of acceptors. SULTs harbor two independent allosteric sites, one of which, the focus of this work, binds non-steroidal anti-inflammatory drugs (NSAIDs). The structure of the first NSAID-binding site – that of SULT1A1 – was elucidated recently and homology modeling suggest that variants of the site are present in all SULT isoforms. The objective of the current study was to assess whether the NSAID-binding site can be used to regulate sulfuryl transfer in humans in an isoform specific manner. Mefenamic acid (Mef) is a potent (Ki 27 nM) NSAID-inhibitor of SULT1A1 – the predominant SULT isoform in small intestine and liver. Acetaminophen (APAP), a SULT1A1 specific substrate, is extensively sulfonated in humans. Dehydroepiandrosterone (DHEA) is specific for SULT2A1, which we show here is insensitive to Mef inhibition. APAP and DHEA sulfonates are readily quantified in urine and thus the effects of Mef on APAP and DHEA sulfonation could be studied non-invasively. Compounds were given orally in a single therapeutic dose to a healthy, adult male human with a typical APAP-metabolite profile. Mef profoundly decreased APAP sulfonation during first pass metabolism and substantially decreased systemic APAP sulfonation without influencing DHEA sulfonation; thus, it appears the NSAID site can be used to control sulfonation in humans in a SULT-isoform specific manner.
Keywords: Sulfotransferase, Drug-drug interaction, Acetaminophen, Toxicity, Mefenamic acid, Metabolism, Pharmacokinetics, Pain, Opioid, LXR, NMR, Allosteric, Regulation, Inhibition, NSAID
1. Introduction
Thyroid hormone (TH) regulates energy metabolism and development in humans [1]. TH is extensively sulfonated, which prevents TH-receptor binding and dramatically increases the efficiency with which TH is inactivated by Type 1 deiodinase [2–4]. Inhibition of SULT1A1 – the isoform that sulfonates TH – is expected to slow TH inactivation, and could thus prove of value in treating hypothyroidism. Further, in clinical studies, elevated intratumoral expression of SULT2B1b in colorectal cancer patients is highly correlated with increased invasion and metastasis, and early recurrence and death [5]. 2B1b expression in colorectal cell lines correlates positively with enhanced colony formation, migration and invasion [5,6]. Here again, an isoform specific SULT inhibitor might prove of value. Finally, liver X receptors (LXRs) are pivotal in regulating cholesterol homeostasis. Oxysterols are primary endogenous LXR agonists and are transformed by sulfonation into LXR antagonists with enhanced affinities [7]. In liver, SULT2A1 catalyzes the majority of oxysterol sulfonation [8]; in brain [9] and aorta [10], SULT2B1b is the dominant isoform. Thus, tissue specific alleviation of LXR inhibition (i.e., LXR activation) could in theory be achieved by selective inhibition of one or the other SULT isoform.
The preceding examples highlight the potential of SULT inhibition in treating human disease; yet, to our knowledge, there are no therapeutics that target sulfuryl-transfer – a situation due, in part, to the challenges associated with selectively inhibiting a single member of ahighly sequence- and structurally-conserved enzyme family [11,12]. Recently, our group demonstrated that SULTs harbor two physically distinct, non-interacting allosteric pockets [13] – the so-called NSAID [14] and catechin binding sites [15]. The structures of both sites have been determined [14,15] and homology modeling suggests that variants of the sites are present in each SULT family member. The allosteric sites appear to have evolved to enable molecular communication between a given isoform and the metabolites with its purview. Recent work demonstrated that SULT1A3, which exhibits high specificity for catecholamine neurotransmitters, is allosterically regulated by tetrahydrobiopterin (THB), an essential co-factor in catecholamine bio-synthesis. THB exhibits > 20,000-fold selectivity for 1A3 over the other major SULTs in liver and brain [16]. Thus, each allosteric site promises a unique isoform-specific target that can be used to independently regulate metabolism the thirteen metabolic domains in which SULTs operate.
The current study, the first of its kind, uses an NSAID (mefenamic acid, Mef) with high specificity for SULT1A1, the predominant SULT in human liver, to demonstrate that the allostere potently inhibits sulfonation of a 1A1-specific substrate (acetaminophen, APAP) in a healthy adult human without influencing sulfonation of dehydroepiandrosterone (DHEA) – a substrate for SULT2A1, which is a Mef-insensitive isoform also found at high levels in liver. Thus it appears SULT allosteric sites can be used to isoform-specifically regulate SULTs in vivo. In addition, the work reveals that first-pass sulfonation of APAP is virtually completely inhibited by Mef – a finding of some clinical significance – and addresses the potential drug-drug interactions between NSAIDs and drugs sulfonated by SULT1A1.
2. Materials and methods
2.1. Materials
The materials and sources used in this study are as follows: dithiothreitol (DTT), ethylenediaminetetraacetic acid (EDTA), L-glutathione (reduced), 1-hydroxypyrene (1-HP), imidazole, isopropyl-thio-β-D-galacto-pyranoside (IPTG), LB media, lysozyme, pepstatin A, potassium phosphate, and 3-(trimethylsilyl)propionic-2,2,3,3-d4 acid (TSP) sodium salt were the highest grade available from Sigma. Ampicillin, HEPES, KCl, KOH, MgCl2 and phenylmethylsulfonyl fluoride (PMSF) were purchased from Fisher Scientific. Acetaminophen was obtained from CVS Pharmacy, liquid gel tablets, lot 1001402. Dehydroepiandrosterone (DHEA), the chemical, was purchased from TCI America, DHEA [1,2,6,7-3H(N)] was obtained from PerkinElmer, DHEA, the nutraceutical, was obtained from the General Nutrition Corporation, lot 57429B17. Mefenamic acid, the chemical, was obtained from Santa Cruz Biotechnology. Mefenamic acid, the drug, was obtained from Lupin Limited, Lot G700974. Deuterium Oxide (> 99%) was purchased from Acros Organics. Glutathione- and nickel-chelating resins were obtained from GE Healthcare. Competent E. coli (BL21(DE3)) was purchased from Novagen. PAPS was synthesized as previously described [17,18] and was ≥99% pure as assessed by anion-exchange HPLC.
2.2. Methods
2.2.1. Dosing and sample collection
The following protocol is approved by the Albert Einstein College of Medicine, Institutional Review Board (IRB protocol # 2017–8685) and is registered at ClinicalTrials.gov (NCT03383133). A single, therapeutic dose of acetaminophen (APAP, 1.0 g) or dehydroepiandrosterone (DHEA, 75 mg) was taken orally (with 375 ml of water) either alone or simultaneously with a single, oral, therapeutic dose of mefenamic acid (Mef, 0.75 g). The compounds were taken prior to eating. One hour later, a light breakfast was consumed (cereal with milk, and coffee) and normal eating habits were then resumed. Voided urine samples were collected at regular intervals. The first sample was collected at 30′, and samples were collected approximately hourly thereafter. The exact time that each sample was collected was recorded and is reported in the figures. Samples were weighed, and a 10 ml aliquot was removed and stored at −80 °C for subsequent study. The time interval between dosing in these experiments was at least 24 hrs (i.e. > 20× reported drug half-life [19–21]).
2.2.2. NMR Measurements
1H NMR spectra were acquired using a Bruker 600 or 900 MHz spectrometer equipped with a TCI H/F-cryogenic probe. Samples (pH 6.9 ± 0.1) were mixed 1:1 (v/v) with D2O containing TSP (1.0 mM [22]). Each spectrum represents the average of 64 spectra acquired using a 1D pulse sequence that included a 4.0 s relaxation delay and 2.73 s acquisition time. Water suppression was accomplished using Excitation Sculpting [23]. Samples were equilibrated, and spectra were acquired at 298 ± 2 °K. 600 MHz spectra were collected using the Bruker automated acquisition software ICON-NMR and SampleJet. Peaks were fit to a Lorentzian peak shape using TopSpin3.5 [24]. Metabolite concentrations were determined by normalizing their peak areas to that of the TSP signal [24].
2.2.3. Protein expression and purification
The SULT1A1 and 2A1 expression plasmids have a PreScission-protease cleavable, triple-affinity tag (N-His/GST/MBP) fused to the N-termini of SULT coding regions that are spliced into the multiple cloning site of pGEX-6P [13,25–27]. Protein expression is induced by addition of IPTG (0.30 mM, final) to LB/ampicillin (100 mg/L) cultures of E. coli (BL21(DE3)) harboring expression plasmid that were cultured at 37 °C to an OD600–0.6. Upon IPTG addition, cultures are shifted to 17 °C using an ice/water bath and then incubated at 17 °C for 18 h. The cells are pelleted, resuspended in Lysis Buffer (PMSF (290 μM), pepstain A (1.5 μM), lysozyme (0.10 mg/ml), EDTA (2.0 mM), KCl (400 mM), KPO4 (50 mM), pH 7.5), sonicated, and centrifuged (10,000 g, 1.0 hr) at 4 °C. MgCl2 (5.0 mM) is then added to chelate EDTA and the supernatant is passed through a Chelating Sepharose Fast Flow column charged with Ni2+. The column is washed with 15 column volumes of buffer (imidazole (10 mM), KCl (0.40 M), and KPO4 (50 mM), pH 7.5), enzyme is then eluted (imidazole (250 mM), KCl (0.40 M), KPO4 (50 mM), pH 7.5) and loaded directly onto a Glutathione Sepharose column equilibrated with (DTT (2.0 mM), KCl (0.40 M), and KPO4 (50 mM), pH 7.5), which is then washed with the same buffer before eluting the tagged enzyme (reduced glutathione (10 mM), DTT (2.0 mM), KCl (0.40 M), Tris (100 mM), pH 8.0). The fusion protein is digested using PreScission Protease during dialysis (DTT (2.0 mM), KCl (0.10 M), and KPO4 (25 mM), pH 7.5) overnight at 4 °C to remove reduced glutathione, and then run through a GST column to remove the tag. The protein is > 95% pure as judged by SDS-PAGE. The protein is then concentrated and its concentration is determined by UV absorbance (Ɛ290 1A1 = 53.9 mM−1 cm−1, Ɛ280 2A1 = 79.5 mM−1 cm−1) [25,26]. The final protein is flash frozen and stored at −80 °C.
2.2.4. Mef inhibition studies
Mef initial-rate inhibition parameters for SULT1A1 and 2A1 were determined using the well-established 1-HP assay [13–16,28,29]. Reaction progress was monitored via the sulfonation-dependent change in 1-HP fluorescence (λex = 325 nm, λem = 370 nm). Velocities were calculated from the region of the progress curve in which ≤5% of the concentration-limiting substrate (1-HP) consumed at the reaction endpoint was converted to product. Velocities were determined in duplicate, and Ki was obtained from least-squares fitting of v vs [S] data using a noncompetitive partial-inhibition model [13,30]. Mef concentrations ranged from 0.20 to 20 × Ki (SULT1A1) and 0.10–10 × Ki (SULT2A1). Reactions were initiated by addition of saturating PAPS (0.50 mM, > 16 × Km) to a solution containing enzyme (10 nM, active site), saturating (40 x Km) 1–HP (2.0 and 20 μM for SULT1A1 and 2A1, respectively), MgCl2 (5.0 mM), and KPO4 (50 mM), pH 7.5, 25 ± 2 °C.
3. Results and discussion
3.1. APAP metabolism – a brief overview
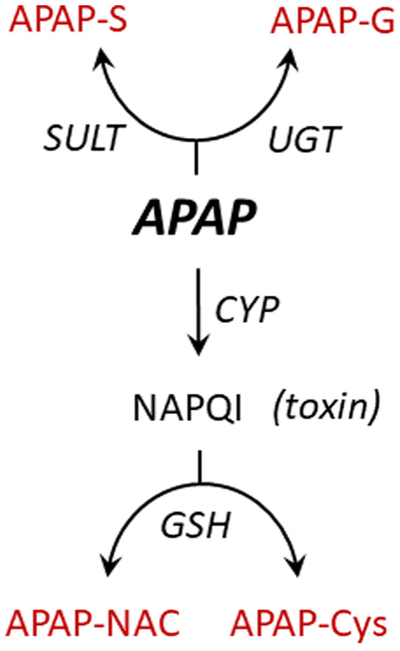
In normal adult humans, APAP is extensively metabolized, primarily in liver [31]. The principal APAP metabolic transformations are outlined in Fig. 1. The major metabolites are the sulfonate and glucuronide conjugates [31], which along with minor conjugates [20,21] clear rapidly to urine [19]. Approximately 100% of a therapeutic dose of APAP is recovered in urine; ~4% as unconjugated APAP [31]. APAP is also converted, via CYP-mediated oxidation, to N-acetyl-p-benzoqui-none (NAPQI) – a highly reactive, toxic alkylating agent [32]. APAP-induced hepatotoxicity accounts for > 50% of overdose related acute liver failures in the United States [33]. The balance between conjugation and toxicity is determined largely by the degree to which the conjugating systems are saturated [19,31,33]. As saturation ensues, unconjugated APAP and NAPQI levels increase concomitantly. The toxic effects of NAPQI are buffered by glutathione (GSH), with which it reacts largely non-enzymatically [34] to form an APAP-GSH conjugate that is converted to secondary metabolites including APAP-NAC and APAP-Cys [21,33].
Fig. 1.
APAP metabolismoverview. Metabolites highlighted in grey are detectable in urine using 1H-NMR. Abbreviations: SULT (sulfotransferase); UGT (uridine 5′-diphospho-glucuronosyltransferase); CYP (cytochrome P450); APAP (acetyl-4-aminophenol); APAP-S (acetyl-4-aminophenol sulfate); APAP-G (acetyl-4-aminophenyl beta-D-glucopyranosiduronic acid); APAP-Cys (3-(5′-acetamido-2′-hydroxyphenyl)-2-aminoproprionic acid); APAP-NAC (2-acetamido-3-(5′-acetamido-2′-hydroxyphenylthio) propanoic acid); GSH (glutathione); NAPQI(N-acetyl-p-benzoquinone imine).
3.2. Detecting APAP and Mef metabolites in urine
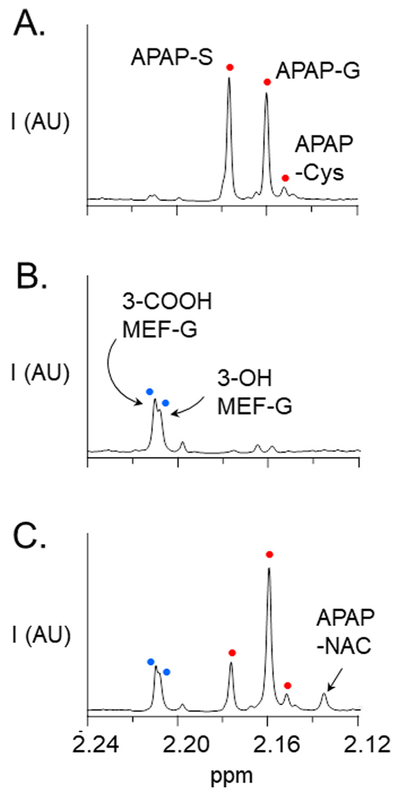
Representative 1H NMR spectra of APAP and Mef metabolites present in the urine of a heathy adult male following a single oral dose of APAP (1.0 g) and/or Mef (0.75 g) are presented in Fig. 2, Panels A, B and C. Samples were taken at the end of the second one-hour interval following dosing, and NMR-peak areas reflect the average metabolite levels during that period. When APAP is taken alone (Panel A), the ratio of sulfonated to glucuronidated APAP (the S/G-ratio) is ~1.2/1. The S/G-ratio ratio calculated from the total amount of APAP-S and APAP-G collected over the first 8 h after dosing was ~0.8, and is consistent with the ratios reported in previous clinical trials [21,31]. The spectrum also reveals a minor quantity of APAP-Cys, which reports on the level of toxin (NAPQI) [21]. Mef metabolites include numerous oxidized and glucuronidated species [35,36]. The major Mef metabolites in urine are the glucuronides of 3-OH- and 3-COOH-Mef [36] and the NMR peaks associated with these glucuronides are labelled in Panel B. When the drugs are taken simultaneously (Panel C), the APAP S/G-ratio decreases substantially (2.8-fold) relative to APAP alone, and the system compensates by increasing the APAP-G level ~1.4-fold. Given the NMR-signal detection lower-limit (i.e., ~1.0 μM metabolite), the spectrum further reveals a considerable Mef-induced increase (≥8-fold) in the level of APAP-NAC, which forms in response to increased level of NAPQI (see, Fig. 1) [21]. Increased APAP-NAC indicates that APAP levels have risen to the point that APAP cannot be glucuronidated quickly enough to avoid toxin formation, and the large fold-effect on APAP-NAC (≥8) relative to APAP-S (2.6) or APAP-G (1.3) suggests that the conjugating system may be near saturation.
Fig. 2.
1H NMR spectrum of APAP and Mef metabolites in urine. Panel A. APAP (oral 1.0 g dose). Panel B. Mef (oral 750 mg dose). Panel C. APAP (1.0 g) + Mef (750 mg) taken simultaneously. Samples were collected at the end of the one-to-two hour interval following oral administration of drug. Spectra were acquired using a Bruker 900 MHz spectrometer equipped with a 5 mm TCI probe. Signal intensities are plotted in arbitrary units (AU). NMR pulse parameters are described in Methods (see, NMR Measurements). Spectral assignments are based on published literature (20, 21, 35, 36). Metabolite acronyms are as follows: APAP-S (acetaminophen sulfonate); APAP-G (acetaminophen glucuronide); APAP-Cys (acetaminophen cysteine); APAP-NAC (acetaminophen N-acetylcysteine); 3-COOH Mef-G (3-carboxy mefenamic glucuronide); 3-OH Mef-G (3-hydroxymethyl mefenamic glucuronide). White and black dots in Panels A and B correspond to those in Panel C.
3.3. Mef effects on APAP metabolism
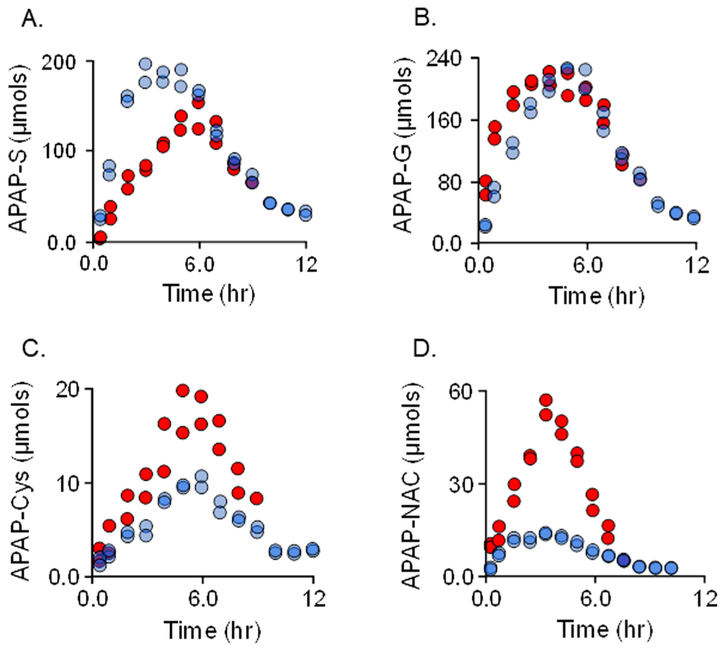
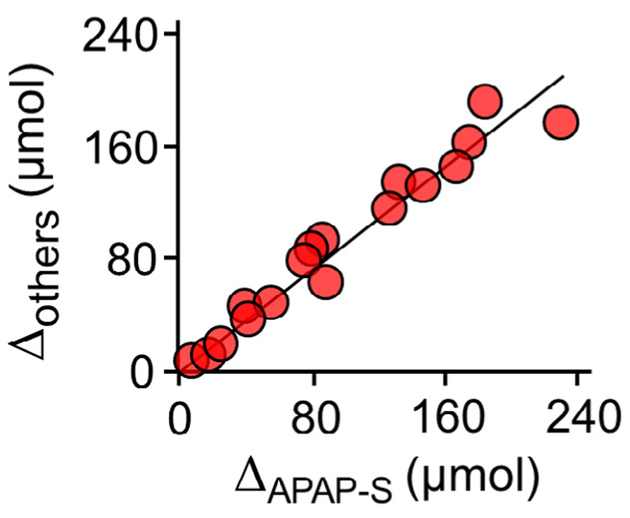
To assess the influence of Mef on APAP metabolism, the distribution and quantities of APAP metabolites that accumulate in urine were determined at regular intervals over periods sufficient to recover > 90% of the APAP dose (Fig. 3A–D). APAP (1.0 g) was taken either alone (white dots) or concomitantly with 0.75 g of Mef (black dots). The profiles reveal that Mef simultaneously suppresses APAP sulfonation and increases the levels of all other APAP metabolites. The (±)-Mef profiles for each metabolite begin separating immediately, achieve maximum separation maximum at 2–4 h, and coalesce near the seven-hour time point – this timeline is consistent with that for serum levels of orally administered Mef, which peak at ~1.8 h and decrease to less than 10% of peak at seven hours [36]. To assess the extent to which APAP metabolism compensates for the Mef-induced loss in APAP-S, the difference between the (+) and (−) Mef APAP-S levels (i.e., ΔAPAP–S) was plotted vs the sum of the differences for all other metabolites (i.e., ΔAPAP–G + ΔAPAP–Cys + ΔAPAP-Nac). The plot (Fig. 4) reveals that losses in APAP-S correlate linearly with gains in the other metabolites. The slope of the correlation, 0.91, indicates that each μmole of APAP-S lost due to Mef produces a gain of 0.91 μmoles in compensating metabolites, and that virtually all excess APAP is conjugated and cleared in the intervals between sampling.
Fig. 3.
Mefinfluences APAP metabolism. APAP (1.0 g) was taken alone, white dots, or simultaneously with Mef (0.75 g), black dots. Drugs were taken orally with 275 ml water. Voided urine samples were collected at the indicated time intervals, sample volumes were determined, and APAP metabolite levels were quantitated using NMR (see, NMR Measurements in Methods). Data are plotted as total μmoles of metabolite in a given sample vs the time following drug administration. The influences of Mef on the following conjugates are shown: Panel A, APAP-sulfonate; Panel B, APAP-glucuronide; Panel C, APAP-cysteine; and Panel D, APAP-acetylcysteine.
Fig. 4.
Mef-induced metabolic compensation among APAP metabolites. The difference between the (+) and (−) Mef levels of APAP-S(i.e., ΔAPAP–S) is plotted vs the sum of the differences for all other metabolites (i.e., ΔAPAP–G + ΔAPAP–Cys + ΔAPAP–Nac). The differences were calculated from the data shown in Fig. 3. The correlation is linear, and its slope (0.91) indicates that virtually all of the APAP that is not sulfonated due to Mef is converted to other Mef conjugates and transported to urine.
Given that APAP conjugates share the same transporters (OATs and MDRs) in liver and kidney [37,38], the observed simultaneous decrease in APAP-S levels and increase in all other conjugates is difficult to explain on the basis of Mef-induced transporter inhibition. Moreover, transport inhibition is expected to delay APAP-S elimination without affecting overall exposure– neither of which is observed. Finally, an accumulation of APAP-S in plasma due to transporter inhibition is not de facto expected to result in quantitative conversion of APAP-S to alternative conjugates [19]. These contra-indications strongly suggest that the Mef-induced redistribution of APAP conjugates in urine is not likely the result of transporter inhibition.
3.4. Mef prevents first pass sulfonation
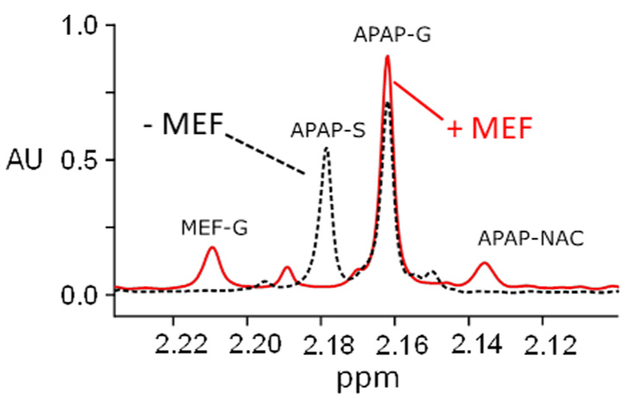
To assess the effects of Mef on APAP first-pass metabolism, APAP (1.0 g) and Mef (0 or 0.75 g) were taken together orally, and 1H NMR urinalysis was performed on samples taken 30 min post administration. The spectra (see, Fig. 5) reveal that while both unconjugated and glucuronidated APAP have accumulated in urine during this interval, APAP-S and the other APAP conjugates have not. The peak plasma concentration of APAP is reached 20–40 min after oral administration [20,21,31,33]; thus, conjugates that accumulate during the first 30 min are expected to reflect primarily first-pass metabolism, and to a lesser degree, systemic metabolism. Given that APAP-S accumulates as the systemic metabolism begins to dominate (see, Fig. 3), we can conclude that the contribution of systemic metabolism is negligible during the first 30 min, and thus that APAP sulfonation is essentially completely suppressed during first-pass metabolism. As might be expected, suppressing APAP-S leads to an increase in APAP-G levels.
Fig. 5.
The effects of Mef on APAP first-pass metabolism. APAP (1.0 g) was administered orally at t0 with and without Mef (0.75 g). Urine was collected at 30 min and APAP and Mef metabolites were analyzed using 900 MHz 1H NMR (see, Materials and Methods). Spectra with (solid line) and without Mef (dotted line) are overlain, and the metabolite peaks are labelled. In the presence of Mef, the APAP-S peak is suppressed beyond the limit of detection (~100-fold).
Thorough suppression of first-pass APAP sulfonation may be of some clinical value. Intravenous (IV) APAP administration is considerably more effective in controlling pain than oral administration [39] and significantly reduces patient consumption of on-demand opioids in the peri-operative setting. The primary site of APAP’s analgesic and antipyretic actions is believed to be the CNS [40,41]. CNS APAP levels correlate linearly with plasma levels, and achieving plasma levels needed for rapid pain relief is challenging when the drug is given orally. Oral co-administration of APAP with Mef, and likely other NSAIDs, is expected to significantly increase unconjugated APAP plasma levels and, in theory, enhance the therapeutic effects of APAP. On this point, APAP and aspirin have long been considered synergistic – consider, for example, Excedrin Migraine, which contains both compounds. To our knowledge, a molecular mechanism for this synergy has not yet been published. The work described here offers a cogent rational for such synergy. Finally, UGT1A6 is primarily responsible for the glycosylation of APAP and is expressed at low levels in infants and neonates [42]. The lack of a compensating UGT pathway suggests that NSAID inhibition of sulfonation may be particularly effective in regulating the activities of APAP (and metabolites with similar SULT1A1/UGT1A6-substrate profiles) in these populations.
3.5. Isoform-Specific inhibition suggests Mef acts allosterically
In designing an in vivo experiment to test whether the Mef induced inhibition of APAP sulfonation is likely allosteric, we reasoned that if a Mef-insensitive SULT isoform that exhibits high specificity for a urine-detectible metabolite could be identified, it would be possible to assess whether Mef inhibition in vivo correlates with its specificity toward the allosteric sites of Mef-sensitive and -insensitive isoforms.
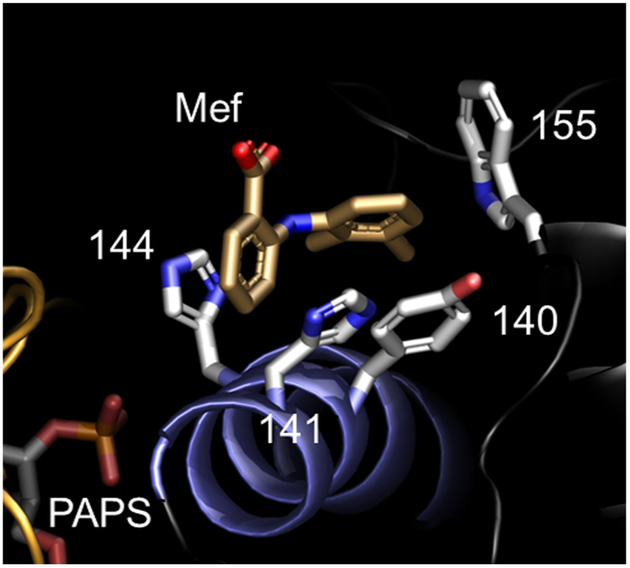
The structure of the Mef-bound allosteric pocket of SULT1A1 [14] was used to identify a Mef-insensitive SULT isoform. When bound to 1A1, each of the two Mef benzyl-rings interacts with a different pair of planar SULT1A1 R-groups – H141/H144 and Y140/W155 (see, Fig. 6). Mutating any one residue typically attenuates Mef binding (five- to tenfold) but does not alter other initial-rate parameters [14]. Notably, the H141/H144-pair binds the single benzyl-ring of aspirin (acetylsalicylic acid) – an allosteric, NSAID inhibitor of SULT1A1 [14,43]. In SULT2A1, one residue in each pair is substituted (H141F and H144/K) and the H141K substitution is non-conserved; hence, it seemed SULT2A1 might exhibit a substantially reduced affinity for Mef.
Fig. 6.
Structure of the Mef-bound NSAID-binding site of SULT1A1. The two planar rings of Mef are in direct contact with two pairs of residues (H141/H144 and Y140/W155). Two of the contact residues are substituted in SULT2A1 (H144F and H144K).
The sensitivity of SULTs 2A1 and 1A1 toward Mef inhibition were compared in classical initial-rate experiments. Reaction rates were determined as a function of Mef concentration at a saturating concentrations of PAPS and 1-hydroxypyrene, which undergoes a sulfo-nation dependent change in fluorescence [28] that was used to monitor reaction progress. The experimental design of the initial-rate experiments is described in Materials and Methods and the associated initial-rate parameters are compiled in Table 1. The affinity of Mef for SULT2A1 (Ki = 14 ± 0.6 μM) is ~520-fold weaker than its affinity for SULT1A1 (Ki = 0.027 ± 0.001 μM). Thus, SULT2A1 seemed an excellent candidate for the proposed studies.
Table 1.
SULT1A1 and 2A1Mef Inhibition Parameters.
| Isozyme | Ki Mef (μM) |
|---|---|
| SULT1A1 | 0.027 (0.001)a |
| SULT2A1 | 14 (0.6) |
Values in parentheses indicate one standard error unit.
SULT2A1 expression is highest in liver, where it approaches that of SULT1A1 [8], and its catalytic efficiency (kcat/Km) toward DHEA (de-hydroepiandrosterone) is uniquely high among SULTs; hence, 2A1′s common name: DHEA sulfotransferase [44]. DHEA is the most abundant circulating steroid in humans and is nearly 100% sulfonated in plasma [45] where it functions as a prohormone [46]. DHEA is available as an over-the-counter nutraceutical and the 1H NMR signal of DHEA-S is readily detected in urine [47].
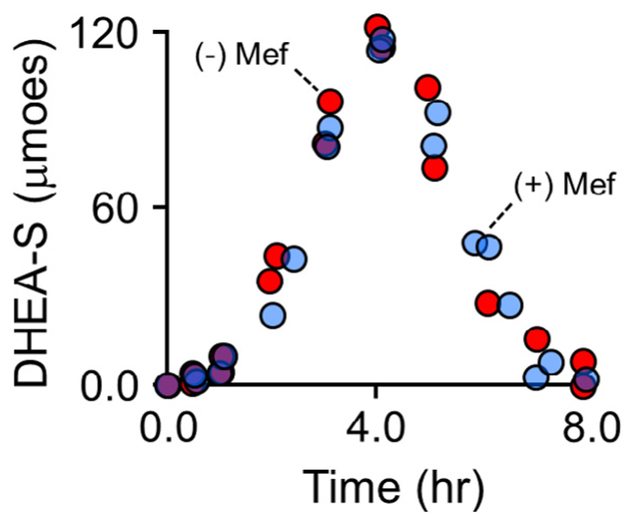
To assess the in vivo Mef-sensitivity of SULT2A1, DHEA (75 mg) was administered orally with and without Mef (750 mg), and DHEA-S in urine was quantified at regular intervals over an 8 hr period using 1H NMR. The drug administration protocol paralleled that for the APAP studies and is described in Materials and Methods. As is evident in Fig. 7, Mef has no detectible effect on DHEA sulfonation. Thus, Mef inhibition in vivo is isoform specific and consistent with its in vitro allosteric inhibition. It appears that Mef is binding at the NSAID allosteric site in vivo – a finding that suggests that the NSAID sites of other SULT iso-forms may prove to be targets for controlling sulfotransferase-linked metabolism in humans.
Fig. 7.
Mef does not affect DHEA sulfonation. DHEA (75 mg) was taken orally with and without Mef (0.75 g) – black and white dots, respectively. Voided urine samples were taken at regular intervals over an 8 h period. Sample volumes were determined, DHEA-S concentrations were determined using 600 MHz 1H NMR, and total DHEA-S was calculated and plotted vs time. Mef does not affect DHEA-S levels. (For interpretation of the references to color in this figure legend, the reader is referred to the web version of this article.)
Catecholamine mediated neurotransmission and neuronal cell death [9,48,49], thyroid hormone regulated energy metabolism [2–4], estrogen linked adipogenesis [50], HIV infection[51], olfaction [52] … are but a few of the scenarios in which SULT isoform-specific inhibition might be used to correct disease-linked metabolic imbalances. The specificity of each SULT isoform centers on a different area of metabolism; hence, as targets, SULTs provide the opportunity to regulate 13 different, disease-relevant metabolic networks. Homology modelling indicates that each human SULT harbors at least one unique allosteric site [14,16]. Each new allosteric binding-site promises a target that can be used to regulate a specific area of SULT biology.
4. Conclusions
Mef inhibits SULT1A1 in vivo in an isoform specific manner that is consistent with its binding at the NSAID allosteric site – this finding opens the door to using Mef (or other NSAIDs) to control SULT1A1 activity in humans and, more broadly, to targeting SULT allosteric sites to control specific aspects of SULT biology; second, Mef completely suppresses APAP sulfonation during first pass metabolism, which may prove to be of therapeutic value; finally, the work reveals that APAP that is not sulfonated due to Mef is shifted nearly entirely to other conjugates, including an ~7-fold increase in NAPQI levels – a fact that should be born in mind when administering APAP with Mef or other NSAIDs.
Acknowledgements
We would like to thank Johanna Daly, M.D. and Robert A. Wolfson, M.D. for their advice and guidance in this work.
The work was supported by the National Institutes of Health Grants GM121849, GM106158 and GM 127144.
Abbreviations:
- APAP-S
acetyl-4-aminophenol sulfate
- APAP-G
acetyl-4-aminophenyl beta-D-glucopyranosiduronic acid
- APAP-Cys
3-(5′-acetamido-2′-hydro-xyphenyl)-2-aminoproprionic acid
- APAP-NAC
2-acetamido-3-(5′-acetamido-2′-hydroxyphenylthio) propanoic acid
- 1-HP
1-hydroxpyrene
- 3-COOH Mef-G
3-carboxy mefenamic acid 1-O-acyl-beta-D-glucuronide
- 3-OH Mef-G
3-hydroxymethyl mefenamic acid acyl-beta-D-glucuronide
- PAPS
3′-phosphoadenosine 5′-phosposulfonate
- TSP
potassium phosphate, and 3-(trimethylsilyl) propionic-2,2,3,3-d4 acid
References
- [1].Brent GA, The molecular basis of thyroid hormone action, N Engl. J. Med 331 (13) (1994) 847–853, 10.1056/NEJM199409293311306. [DOI] [PubMed] [Google Scholar]
- [2].Visser TJ, Role of sulfation in thyroid hormone metabolism, Chem. Biol. Interact 92 (1–3) (1994) 293–303. [DOI] [PubMed] [Google Scholar]
- [3].Rutgers M, Heusdens FA, Visser TJ, Deiodination of iodothyronine sulfamates by type I iodothyronine deiodinase of rat liver, Endocrinology 129 (3) (1991) 1375–1381, 10.1210/endo-129-3-1375. [DOI] [PubMed] [Google Scholar]
- [4].Spaulding SW, Smith TJ, Hinkle PM, Davis FB, Kung MP, Roth JA, Studies on the biological activity of triiodothyronine sulfate, J. Clin. Endocrinol. Metab 74(5) (1992) 1062–1067, 10.1210/jcem.74.5.1533227. [DOI] [PubMed] [Google Scholar]
- [5].Hu L, Yang GZ, Zhang Y, Feng D, Zhai YX, Gong H, Qi CY, Fu H, Ye MM, Cai QP, Gao CF, Overexpression of SULT2B1b is an independent prognostic indicator and promotes cell growth and invasion in colorectal carcinoma, Lab Invest. 95 (9) (2015) 1005–1018 Epub 2015/06/29. doi: 10.1038/labinvest.2015.84.. [DOI] [PMC free article] [PubMed] [Google Scholar]
- [6].Vickman RE, Crist SA, Kerian K, Eberlin L, Cooks RG, Burcham GN,Buhman KK, Hu CD, Mesecar AD, Cheng L, Ratliff TL, Cholesterol sulfonation enzyme, SULT2B1b, modulates AR and cell growth properties in prostate cancer, Mol. Cancer Res 14 (9) (2016) 776–778 Epub 2016/06/24. doi: 10.1158/1541-7786.MCR-16-0137.. [DOI] [PMC free article] [PubMed] [Google Scholar]
- [7].Cook IT, Duniac-Dmuchowski Z, Kocarek TA, Runge-Morris M, Falany CN, 24-Hydroxycholesterol sulfation by human cytosolic sulfotransferases: formation of monosulfates and disulfates, molecular modeling, sulfatase sensitivity and inhibition of LXR activation, Drug Metab Dispos. (2009). [DOI] [PMC free article] [PubMed] [Google Scholar]
- [8].Riches Z, Stanley EL, Bloomer JC, Coughtrie MW, Quantitative evaluation of the expression and activity of five major sulfotransferases (SULTs) in human tissues: the SULT “pie”, Drug Metab Dispos. 37 (11) (2009) 2255–2261 10.1124/dmd.109.028399.. [DOI] [PMC free article] [PubMed] [Google Scholar]
- [9].Salman ED, Kadlubar SA, Falany CN, Expression and localization of cytosolic sulfotransferase (SULT) 1A1 and SULT1A3 in normal human brain, Drug Metab Dispos. 37 (4) (2009) 706–709 10.1124/dmd.108.025767.. [DOI] [PMC free article] [PubMed] [Google Scholar]
- [10].Bai Q, Zhang X, Xu L, Kakiyama G, Heuman D, Sanyal A, Pandak WM, Yin L,Xie W, Ren S, Oxysterol sulfation by cytosolic sulfotransferase suppresses liver X receptor/sterol regulatory element binding protein-1c signaling pathway and reduces serum and hepatic lipids in mouse models of nonalcoholic fatty liver disease, Metabolism 61 (6) (2012) 836–845 Epub 2012/01/05. doi: 10.1016/j.metabol.2011.11.014. [DOI] [PMC free article] [PubMed] [Google Scholar]
- [11].Nowell S, Falany CN, Pharmacogenetics of human cytosolic sulfotransferases, Oncogene 25 (11) (2006) 1673–1678. [DOI] [PubMed] [Google Scholar]
- [12].Blanchard RL, Freimuth RR, Buck J, Weinshilboum RM, Coughtrie MW, A proposed nomenclature system for the cytosolic sulfotransferase (SULT) super-family, Pharmacogenetics 14 (3) (2004) 199–211. [DOI] [PubMed] [Google Scholar]
- [13].Cook I, Wang T, Falany CN, Leyh TS, The allosteric binding sites of sulfotransferase 1A1, Drug Metab Dispos. 43 (3) (2015) 418–423 10.1124/dmd.114.061887.. [DOI] [PMC free article] [PubMed] [Google Scholar]
- [14].Wang T, Cook I, Leyh TS, The NSAID allosteric site of human cytosolic sulfotransferases, J. Biol. Chem 292 (49) (2017) 20305–20312 Epub 2017/10/16. 10.1074/jbc.M117.817387. [DOI] [PMC free article] [PubMed] [Google Scholar]
- [15].Cook I, Wang T, Girvin M, Leyh TS, The structure of the catechin-binding site of human sulfotransferase 1A1, Proc. Natl. Acad. Sci. USA 113 (50) (2016) 14312–7 Epub 2016/11/23. doi: 10.1073/pnas.1613913113. [DOI] [PMC free article] [PubMed] [Google Scholar]
- [16].Cook I, Wang T, Leyh TS, Tetrahydrobiopterin regulates monoamine neuro-transmitter sulfonation, Proc. Natl. Acad. Sci. USA 114 (27) (2017) E5317–E24 Epub 2017/06/19. doi: 10.1073/pnas.1704500114. [DOI] [PMC free article] [PubMed] [Google Scholar]
- [17].Sun M, Leyh TS, The human estrogen sulfotransferase: a half-site reactive enzyme, Biochemistry 49 (23) (2010) 4779–4785 Epub 2010/05/01. doi: 10.1021/bi902190r. [DOI] [PMC free article] [PubMed] [Google Scholar]
- [18].Wang T, Cook I, Leyh TS, 3’-Phosphoadenosine 5’-phosphosulfate allosterically regulates sulfotransferase turnover, Biochemistry 53 (44) (2014) 6893–690010.1021/bi501120p. [DOI] [PMC free article] [PubMed] [Google Scholar]
- [19].Davis M, Labadarios D, Williams RS, Metabolism of paracetamol after therapeutic and hepatotoxic doses in man, J. Int. Med. Res 4 (4 Suppl) (1976) 40–45, 10.1177/14732300760040S409. [DOI] [PubMed] [Google Scholar]
- [20].Bales JR, Nicholson JK, Sadler PJ, Two-dimensional proton nuclear magnetic resonance “maps” of acetaminophen metabolites in human urine, Clin. Chem 31(5) (1985) 757–762. [PubMed] [Google Scholar]
- [21].Bales JR, Sadler PJ, Nicholson JK, Timbrell JA, Urinary excretion of acetaminophen and its metabolites as studied by proton NMR spectroscopy, Clin. Chem 30 (10) (1984) 1631–1636. [PubMed] [Google Scholar]
- [22].Gronwald W, Klein MS, Kaspar H, Fagerer SR, Nürnberger N, Dettmer K, Bertsch T, Oefner PJ, Urinary metabolite quantification employing 2D NMR spectroscopy, Anal Chem. 80 (23) (2008) 9288–9297, 10.1021/ac801627c. [DOI] [PubMed] [Google Scholar]
- [23].Hwang TL, Shaka AJ. Water, Suppression that works. excitation sculpting using arbitrary waveforms and pulsed field gradients, J. Magn. Resonance 112 (2) (1995) 275–279. [Google Scholar]
- [24].Lee W, Hu K, Tonelli M, Bahrami A, Neuhardt E, Glass KC, Markley JL, Fast automated protein NMR data collection and assignment by ADAPT-NMR on Bruker spectrometers, J. Magn. Reson 236 (2013) 83–88 Epub 2013/08/30. doi: 10.1016/j.jmr.2013.08.010. [DOI] [PMC free article] [PubMed] [Google Scholar]
- [25].Cook I, Wang T, Almo SC, Kim J, Falany CN, Leyh TS, The gate that governs sulfotransferase selectivity, Biochemistry 52 (2) (2013) 415–424 10.1021/bi301492j. [DOI] [PMC free article] [PubMed] [Google Scholar]
- [26].Cook I, Wang T, Almo SC, Kim J, Falany CN, Leyh TS, Testing the sulfotransferase molecular pore hypothesis, J. Biol. Chem 288 (12) (2013) 8619–8626 10.1074/jbc.M112.445015. [DOI] [PMC free article] [PubMed] [Google Scholar]
- [27].Cook I, Wang T, Falany CN, Leyh TS, A nucleotide-gated molecular pore selects sulfotransferase substrates, Biochemistry 51 (28) (2012) 5674–5683 10.1021/bi300631g. [DOI] [PMC free article] [PubMed] [Google Scholar]
- [28].Wang T, Cook I, Leyh TS, Design and Interpretation of Human Sulfotransferase 1A1 Assays, Drug Metab Dispos. 44 (4) (2016) 481–484 10.1124/dmd.115.068205. [DOI] [PMC free article] [PubMed] [Google Scholar]
- [29].Wang T, Cook I, Leyh TS, Isozyme specific allosteric regulation of human sulfotransferase 1A1, Biochemistry 55 (29) (2016) 4036–4046, 10.1021/acs.biochem.6b00401. [DOI] [PMC free article] [PubMed] [Google Scholar]
- [30].Whiteley CG, Enzyme kinetics: partial and complete non-competitive inhibition, Biochem. Educ 27 (1999) 15–18. [DOI] [PubMed] [Google Scholar]
- [31].Prescott LF, Kinetics and metabolism of paracetamol and phenacetin, Br J. Clin. Pharmacol 10 (1980) Suppl 2:291S–8S. [DOI] [PMC free article] [PubMed] [Google Scholar]
- [32].Hoffmann KJ, Axworthy DB, Baillie TA, Mechanistic studies on the metabolic activation of acetaminophen in vivo, Chem. Res. Toxicol 3 (3) (1990) 204–211. [DOI] [PubMed] [Google Scholar]
- [33].Yoon E, Babar A, Choudhary M, Kutner M, Pyrsopoulos N, Acetaminophen-induced hepatotoxicity: a comprehensive update, J. Clin. Transl. Hepatol 4 (2) (2016) 131–142 Epub 2016/06/15. doi: 10.14218/JCTH.2015.00052. [DOI] [PMC free article] [PubMed] [Google Scholar]
- [34].Henderson CJ, Wolf CR, Kitteringham N, Powell H, Otto D, Park BK, Increased resistance to acetaminophen hepatotoxicity in mice lacking glutathione S-transferase Pi, Proc. Natl. Acad. Sci. USA 97 (23) (2000) 12741–12745 10.1073/pnas.220176997. [DOI] [PMC free article] [PubMed] [Google Scholar]
- [35].Venkataraman H, den Braver MW, Vermeulen NP, Commandeur JN, Cytochrome P450-mediated bioactivation of mefenamic acid to quinoneimine intermediates and inactivation by human glutathione S-transferases, Chem Res Toxicol. 27 (12) (2014) 2071–2081 Epub 2014/11/18. doi: 10.1021/tx500288b. [DOI] [PubMed] [Google Scholar]
- [36].McGurk KA, Remmel RP, Hosagrahara VP, Tosh D, Burchell B, Reactivity of mefenamic acid 1-o-acyl glucuronide with proteins in vitro and ex vivo, Drug Metab. Dispos 24 (8) (1996) 842–849. [PubMed] [Google Scholar]
- [37].Jayasinghe KS, Roberts CJ, Read AE, Is biliary excretion of paracetamol significant in man? Br J. Clin. Pharmacol 22 (3) (1986) 363–366. [DOI] [PMC free article] [PubMed] [Google Scholar]
- [38].Mazaleuskaya LL, Sangkuhl K, Thorn CF, FitzGerald GA, Altman RB,Klein TE, PharmGKB summary: pathways of acetaminophen metabolism at the therapeutic versus toxic doses, Pharmacogenet Genom. 25 (8) (2015) 416–42610. 10.1097/FPC.0000000000000150. [DOI] [PMC free article] [PubMed] [Google Scholar]
- [39].Urman RD, Boing EA, Pham AT, Khangulov V, Fain R, Nathanson BH,Zhang X, Wan GJ, Lovelace B, Cirillo J, Improved outcomes associated with the use of intravenous acetaminophen for management of acute post-surgical pain in cesarean sections and hysterectomies, J. Clin. Med. Res 10 (6) (2018) 499–507 Epub 2018/04/13. doi: 10.14740/jocmr3380w. [DOI] [PMC free article] [PubMed] [Google Scholar]
- [40].Bannwarth B, Netter P, Lapicque F, Gillet P, Péré P, Boccard E, Royer RJ,Gaucher A, Plasma and cerebrospinal fluid concentrations of paracetamol after a single intravenous dose of propacetamol, Br J. Clin. Pharmacol 34 (1) (1992) 79–81. [DOI] [PMC free article] [PubMed] [Google Scholar]
- [41].Singla NK, Parulan C, Samson R, Hutchinson J, Bushnell R, Beja EG, Ang R, Royal MA, Plasma and cerebrospinal fluid pharmacokinetic parameters after single-dose administration of intravenous, oral, or rectal acetaminophen, Pain Pract. 12 (7) (2012) 523–532 Epub 2012/04/24. 10.1111/j.1533-2500.2012.00556.x. [DOI] [PubMed] [Google Scholar]
- [42].Miyagi SJ, Collier AC, The development of UDP-glucuronosyltransferases 1A1 and 1A6 in the pediatric liver, Drug Metab Dispos. 39 (5) (2011) 912–919 Epub 2011/01/25. doi: 10.1124/dmd.110.037192. [DOI] [PMC free article] [PubMed] [Google Scholar]
- [43].Vietri M, De Santi C, Pietrabissa A, Mosca F, Pacifici GM, Inhibition of human liver phenol sulfotransferase by nonsteroidal anti-inflammatory drugs, Eur. J. Clin. Pharmacol 56 (1) (2000) 81–87. [DOI] [PubMed] [Google Scholar]
- [44].Falany CN, Vazquez ME, Kalb JM, Purification and characterization of human liver dehydroepiandrosterone sulphotransferase, Biochem. J 260 (3) (1989) 641–646. [DOI] [PMC free article] [PubMed] [Google Scholar]
- [45].Parker CR, Dehydroepiandrosterone and dehydroepiandrosterone sulfate production in the human adrenal during development and aging, Steroids 64 (9) (1999) 640–647 S0039–128X(99)00046-X [pii]. [DOI] [PubMed] [Google Scholar]
- [46].Labrie F, Bélanger A, Luu-The V, Labrie C, Simard J, Cusan L, Gomez JL,Candas B, DHEA and the intracrine formation of androgens and estrogens in peripheral target tissues: its role during aging, Steroids 63 (5–6) (1998) 322–328 S0039–128X(98)00007–5 [pii]. [DOI] [PubMed] [Google Scholar]
- [47].Dehennin L, Ferry M, Lafarge P, Pérès G, Lafarge JP, Oral administration of dehydroepiandrosterone to healthy men: alteration of the urinary androgen profile and consequences for the detection of abuse in sport by gas chromatography-mass spectrometry, Steroids 63 (2) (1998) 80–87. [DOI] [PubMed] [Google Scholar]
- [48].Asanuma M, Miyazaki I, Ogawa N, Dopamine- or L-DOPA-induced neurotoxicity: the role of dopamine quinone formation and tyrosinase in a model of Parkinson’s disease, Neurotox Res. 5 (3) (2003) 165–176. [DOI] [PubMed] [Google Scholar]
- [49].Eisenhofer G, Coughtrie MW, Goldstein DS, Dopamine sulphate: an enigma resolved, Clin. Exp. Pharmacol. Physiol. Suppl 26 (1999) S41–S53. [PubMed] [Google Scholar]
- [50].Ihunnah CA, Wada T, Philips BJ, Ravuri SK, Gibbs RB, Kirisci L, Rubin JP, Marra KG, Xie W, Estrogen sulfotransferase/SULT1E1 promotes human adipo-genesis, Mol. Cell. Biol 34 (9) (2014) 1682–1694 10.1128/MCB.01147-13. [DOI] [PMC free article] [PubMed] [Google Scholar]
- [51].Swann J, Murry J, Young JA, Cytosolic sulfotransferase 1A1 regulates HIV-1 minus-strand DNA elongation in primary human monocyte-derived macrophages, Virol. J 13 (2016) 30 10.1186/s12985-016-0491-9. [DOI] [PMC free article] [PubMed] [Google Scholar]
- [52].Stowers L, Logan DW, Sexual dimorphism in olfactory signaling, Curr. Opin. Neurobiol 20 (6) (2010) 770–775 S0959–4388(10)00135–2 [pii]; 10.1016/j.conb.2010.08.015. [DOI] [PMC free article] [PubMed] [Google Scholar]


