

SUMMARY
The prognosis of patients with glioblastoma (GBM) remains dismal, with a median survival of approximately 15 months. Current preclinical GBM models are limited by the lack of a “normal” human microenvironment and the inability of many tumor cell lines to accurately reproduce GBM biology. To address these limitations, we have established a model system whereby we can retro-engineer patient-specific GBMs using patient-derived glioma stem cells (GSCs) and human embryonic stem cell (hESC)-derived cerebral organoids. Our cerebral organoid glioma (GLICO) model shows that GSCs home toward the human cerebral organoid and deeply invade and proliferate within the host tissue, forming tumors that closely phenocopy patient GBMs. Furthermore, cerebral organoid tumors form rapidly and are supported by an interconnected network of tumor micro-tubes that aids in the invasion of normal host tissue. Our GLICO model provides a system for modeling primary human GBM ex vivo and for high-throughput drug screening.
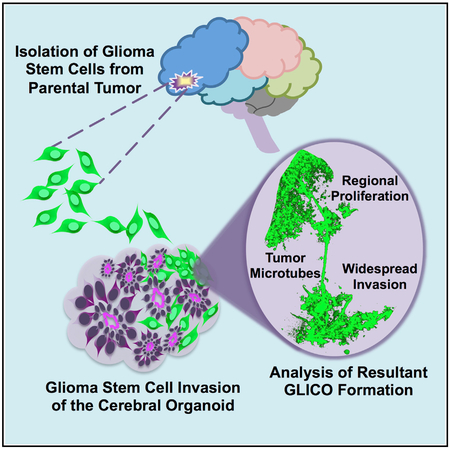
Graphical Abstract
In Brief
To address limitations with current preclinical glioblastoma (GBM) models, Linkous et al. establish a “GLICO” (cerebral organoid glioma) model to retro-engineer patient-specific GBMs using patient-derived glioma stem cells and human cerebral organoids. Resulting tumors closely phenocopy patient GBMs and are supported by tumor microtubes that promote invasion into host tissue.
INTRODUCTION
Glioblastoma multiforme is the most lethal primary brain tumor in adults. Median survival rates have remained largely unchanged for 30 years. With a 5-year survival rate of less than 5% (Stupp et al., 2005), new strategic approaches to the study and treatment of this disease are clearly needed.
Glioblastoma multiforme (GBM) research and drug development rely on cell autonomous in vitro or lengthy, expensive in vivo models that poorly recapitulate human disease. Tumors are not cell autonomous but rather inherently complex systems that generate emergent properties specific to their host (Lu et al., 2012; Quail and Joyce, 2017; Rubenstein and Kaufman, 2008). Three-dimensional (3D) models of cancers, including tumor organoids (Shroyer, 2016), patient-derived xenografts (PDXs) (Tentler et al., 2012), and genetic mouse models (Holland, 2001), all address some aspects of GBM but are fundamentally limited. Thus, the ability to comprehensively understand and therapeutically manipulate complex cancer phenotypes requires the creation of clinically relevant models that embrace that complexity yet retain amenability to detailed analysis. We contend that an ex vivo model that is experimentally manipulable, biologically and clinically relevant, logistically pragmatic, and scientifically rigorous would enhance the study of GBM as a human disease and allow patient-specific high-throughput drug and therapeutic screening.
Over the years, evidence generated by our laboratory and others has shown that patient-derived glioma stem cells (GSCs) are the most biologically and phenotypically relevant cells to the parental tumor in patients (Baysan et al., 2012, 2014; Lee et al., 2006, 2008; Son et al., 2009). Defined by the capacity for self-renewal and multi-lineage differentiation, this subpopulation of cells is imperative for tumor initiation, maintenance, and invasion in vivo. Moreover, GSCs exhibit increased resistance to ionizing radiation and cytotoxic drugs, implicating their role in treatment resistance of GBM (Bao et al., 2006). Thus, GSCs have become the accepted standard for studying GBM biology. It is important to acknowledge, however, that in vivo GSCs are not cell autonomous but rather heavily influenced by tumor host-cell interactions and the ability to grow within a 3D extracellular matrix (Lu et al., 2012; Quail and Joyce, 2017; Rubenstein and Kaufman, 2008). Unknown interspecies differences between human GSCs and murine brain cells coupled with variably long tumor latencies, lack of real-time imaging and genetic manipulation, and various ethical issues represent limitations of GSC-derived xenografts (Anisimov et al., 2005; Dragunow, 2008; Gould et al., 2015; Huszthy et al., 2012; Hutchinson and Kirk, 2011; John Lin et al., 2017; Jucker, 2010; Perrin, 2014). In contrast, although tumor organoids overcome some of the logistical constraints of animal models, they fail to address the critical issue of tumor-normal host tissue microenvironment interactions.
Although it would be theoretically possible to co-culture various brain cells with GSCs in two dimension (2D) to address host-tumor cell interaction, the resulting disorganized mixture of normal cells would lack the human extracellular matrix and would not remotely resemble the 3D, carefully organized arrangement of cells in the human brain. This, however, is exactly what cerebral organoids achieve. Thus, using hESC-derived cerebral organoids and patient-derived GSCs, we demonstrate a powerful tool for modeling human GBM within a primitive, human brain microenvironment.
RESULTS
Morphological and Immunohistochemical Analysis Reveals Neural Stem Cells and Lineage-Specific Differentiation in Cerebral Organoids
On the basis of recent work by Lancaster and Knoblich (Lancaster et al., 2013), others and we are now able to create a realistic in vitro model of the developing human brain. By culturing human embryonic stem cells (hESCs) or induced pluripotent stem cells (iPSCs) in conditions that promote 3D expansion of neuroectoderm, a cerebral organoid or “miniature brain” forms. Our cerebral organoids display a primitive ventricular system, multiple neural rosettes with a proliferative zone of neural stem cells (NSCs), and a differentiated choroid plexus (Figure S1A). Cerebral organoids are positive for NSC markers including Nestin, Musashi-1, and Sox2 (Figure S1C). In addition, Pax6, a key transcription factor essential for NSC proliferation and neurogenesis (Sansom et al., 2009), is found extensively within the cerebral organoids (Figure S2A). Expression of these proteins is consistent with neuroectoderm cell fate determination, progenitors of the ventricular zone (VZ) and forebrain identity. Moreover, co-staining with TBR2, a marker of intermediate progenitors within the subventricular zone (SVZ) of the human brain (Lancaster et al., 2013), shows distinct populations of SVZ-associated (TBR2+) and VZ-associated (Pax6+) cells (Figure S2A).
Providing additional evidence of regulated development, we show that the lumens of the neural rosettes are positive for the apical tight junction protein, N-cadherin (Figure S2A). Luminal accumulation of N-cadherin-positive cells suggests that these rosettes display the same type of polarity found within the neural tube of the embryonic neural plate (Elkabetz et al., 2008). These morphological and immunohistochemical findings suggest that the level of differentiation and structural development in our cerebral organoids approximate the developmental stage of a 20-week-old human fetal brain (Figure S1B). In addition, temporal evolution studies of the cerebral organoids reveal decreased neurogenesis and increased gliogenesis over time, with enhanced expression of glial fibrillary acidic protein (GFAP) as the organoids continue to age, much like the normal mammalian brain (Figures 4A and S2C). Recent data from Sloan et al. (2017) corroborates our findings by demonstrating that gene signatures in cortical cerebral organoids switch from fetal astrocyte genes to mature astrocyte genes as the organoids age over time.
Figure 4. GLICOs Exhibit Similar Growth Rates in iPSC-Derived Organoids and in Organoids of Different Ages.

(A) Immunofluorescence staining for GFAP (green) and DAPI (blue) in 6- or 20-week-old H1-derived cerebral organoids; n = 4 organoids per time point; scale bars, 200 μm.
(B) Representative images of GLICO tumor growth (top) and quantification of secreted luciferase activity (bottom) from 923 GLICO tumors grown in either 1- or 4-month-old H1-derived cerebral organoids; n = 6 organoids per group; scale bar, 500 μm.
(C) Representative images of GLICO tumor growth (top) and quantification of secreted luciferase activity (bottom) from 923 GLICO tumors grown in either 1-month-old hESC-derived (H1) or iPSC-derived (H6) organoids; n = 6 organoids per group; scale bar, 500 μm.
Cerebral Organoids Exhibit Stage-Specific Neural Development and Demonstrate Myelinated Axons, Dendrodendritic Synapses, Neurons, and Glia
Because molecular markers are not always cell type specific, we performed high-resolution transmission electron microscopy (TEM) to confirm the presence of specific cell types and neuroanatomical features within the cerebral organoids. As shown in Figure S2B, cerebral organoids contain both glial cells and neurons, with a number of the neuronal axons displaying myelination and the presence of dendrodendritic synapses (black arrows). In contrast to the more common axodendritic synapse, a dendrodendritic synapse occurs between the dendrites of two neurons and can mediate bi-directional signaling (Masurkar and Chen, 2012). Interestingly, these synapses are among the most well characterized microcircuits within the brain.
Patient-Derived GSCs Form Infiltrative Tumors in Cerebral Organoids
To accurately model human GBM in cerebral organoids, we co-cultured GFP-labeled GSCs with individual, fully formed cerebral organoids for 24 h. Tumor take rate was 100% for all GSC lines, and tumor-infiltrated organoids were monitored daily by immunofluorescence microscopy for evidence of tumor formation. As shown in Figure 1A, considerable tumor growth was detected 1 week after co-culture. Subsequent neuropathological evaluation of tumor-bearing organoids revealed a hypercellular bulk tumor with an infiltrating edge of GSCs that were invading the normal tissue, thus recapitulating tumor morphology observed in human patient GBMs. In addition, immunofluorescence staining for GFP revealed extensive infiltration of GFP-positive tumor cells in 923 cerebral organoid gliomas (GLICOs), with more than 20% of these tumor cells staining positive for the proliferative marker Ki67 (Figure 1D). To further confirm that a portion of the glioma cells within the GLICO were actively proliferating, we pulsed 923 GLICOs for 48 h with the modified thymidine analog EdU (5-ethynyl-2°-deoxyuridine). We then performed co-immunofluorescence staining to identify proliferating tumor cells as evident by dual positivity for Edu and GFP (Figure S4A).
Figure 1. Patient-Derived GSCs Form Infiltrative Tumors in Cerebral Organoids.

(A) Tumor formation from GFP-expressing 827 GSCs (left) 1 week after co-culture; scale bar, 400 μm; n = 6 organoids per cell line.
(B) Historical development of patient-derived GLICOs from six patient tumor specimens.
(C) Diffuse GSC infiltration (blue arrow indicates tumor cells) of the organoid as evident by morphological (H&E) analysis of control organoids (top) and GFP-expressing 923 GLICO tumors (bottom) at day 14; scale bars, 1,000 μm (left) and 100 μm (right); six organoids were analyzed per group. Tumors exhibit necrosis (black arrow).
(D) Representative image and bar graph showing quantification of Ki67+/GFP+ cells in GFP+ 923 GLICO tumors after 2 weeks of growth; green, GFP; red, Ki67; blue, DAPI; n = 3 organoids; scale bar, 50 μm.
In addition to the positive Ki67 and EdU staining, we also quantitatively assessed GSC proliferation using two additional methods. First, we plated 20,000 or 200,000 GFP-expressing 827 GSCs in triplicate and counted the number of live cells at day 8 and day 18. Both groups exhibited proliferation at days 8 and 18; live cell number from 20,000 = 50,000 at day 8 and 760,000 at day 18, while live cell number from 200,000 = 1,212,000 at day 8 and 2,080,000 at day 18 (Figure S4B). We then co-cultured 20,000 or 200,000 GFP-expressing 827 GSCs with H1-derived cerebral organoids and performed subsequent qRT-PCR (qPCR) for GFP expression at days 8 and 18. Figure S4C demonstrates increasing GFP expression at days 8 and 18 for GLICO tumors originating from both 20,000 and 200,000 GSCs, but GFP expression was significantly higher at day 8 between GLICOs formed from 200,000 GSCs compared with GLICOs from 20,000 GSCs (p = 0.0005). Day 18 GFP expression in GLICOs from 200,000 GSCs was also significantly greater than GFP expression from the same group at day 8 (p = 0.0094), indicating that GLICO tumors are proliferating over time, as demonstrated by the Ki67 expression and EdU incorporation.
Two-photon microscopy of GFP-labeled GSC-bearing organoids revealed distinct areas of tumor bulk adjacent to normal cerebral tissue diffusely infiltrated by glioma cells in a pattern highly similar to that seen in surgical and autopsy specimens from GBM patients (Figures 1B and S3A). In order to determine if this heterogeneity of glioma growth and invasion within the GLICO model is a consistent phenotype intrinsic to that particular patient-derived GSC line and the GLICO model or just a random event, we interrogated the growth patterns of six newly generated patient-derived GSC lines in the GLICO (Figure 1B). Using six to ten GLICO tumors per cell line, we observed remarkably consistent GSC line-specific biological behavior in the GLICO model. For example, 0728 and 1206, two of our most aggressive cell lines in vitro, exhibited a highly diffuse pattern of invasion that extended to all areas of the cerebral organoid. IN contrast, 0320 and 0810 often form rather large neurospheres in 2D growth and display a consistent and similar pattern of invasion that is characterized by tightly woven honeycomb-like networks of tumor cells (Figure 1B). Last, 0517 and 0607 GSCs are defined by slow growth rates compared with the other GSCs, and their respective GLICO tumors are often characterized by smaller regional nodes of proliferation, surrounded by distinct areas of limited infiltration. Such strikingly different patterns and degrees of tumor cell invasion and proliferation between the different GSC lines is consistently reflected in the growth of these different GSC lines in the GLICO model and reflects the heterogeneity of the invasive phenotypes that are clinically observed in GBM patients.
3D topographical analyses and optical sections of GLICO z stacks further illustrate the various levels of tumor infiltration and proliferation throughout the entire structural landscape of the organoid (Figure S3B and S3C). These data were supported by light sheet microscopic studies in which the resulting 3D tumor volume rendering shows a definitive GFP-positive 923 tumor mass at 14 days post-co-culture (Figure S3D; pseudo-color, red).
GLICO Tumors Are Detectable by Luciferase-Based Imaging
In order to develop a rapid and quantitative method for repeated in vitro imaging and quantitation of tumor mass in real time without the need to disrupt the cerebral organoid, we generated GSCs that stably express either firefly luciferase or a secreted Cypridina luciferase and co-cultured these cells with cerebral organoids to allow tumor formation. The tumor bioluminescence signal from firefly luciferase-expressing 923 GLICOs was easily detected in a multi-well plate within 1 min of exposure (Figure S3E). The amount of activity in the GLICO tumor imaged in real time was directly proportional to the number of 923 GSC cells that were initially co-cultured with the cerebral organoid (Figure S3E). In 827 GSCs that expressed the secreted form of luciferase, luciferase activity in the medium increased over time and was directly proportional to the number of GSCs that were growing in the GLICO tumors (Figure S3F).
GSC-Derived GLICO Tumors Recapitulate Features of the Human Disease
To further highlight the aggressiveness of GSC-derived tumors in cerebral organoids, we evaluated the histopathology of tumor-bearing organoids whose tumors had been growing for approximately 2 weeks. Figure 1C demonstrates marked destruction of cerebral organoid tissue by 923 GLICOs, closely mirroring the human disease pathology. In contrast to the completely viable con trol organoid tissue, invasion of the GSCs induced abundant necrosis in cerebral organoids, in part because of the large number of proliferating tumor cells (Figure 1C).
GLICO Tumor Growth Is Supported by a Network of Tumor Microtubes
We further sought to elucidate whether GSC growth in organoids resembles human glioma growth in vivo. Osswald et al. (2015) recently reported that GBMs in situ possess a network of gap junction mediated-interconnecting microtubes. This network of tumor microtubes provides potential routes for invasion and proliferation, thus facilitating multicellular communication between tumor cells. Using two-photon microscopy, we observed a similar network of microtubes in 923 and 827 GSC-formed GBMs growing in cerebral organoids (Figures 2A, Figures 2B, and 2G; Videos S1, S2, and S3). These microtubes penetrate deeply into the normal brain and provide multicellular connections among various tumor subpopulations in the organoid. Electron micrographs of peroxidase-based immunolabeling of connexin-43 in GLICO tumors revealed not only connexin-43-positive gap junctions (Figure 2C, top) but also elevated cytoplasmic labeling for connexin-43 at various regions of connectivity within the tumor micro-tubes themselves (Figure 2D). Furthermore, time-lapse imaging demonstrated that these tumor microtubes effectively propagate calcium signals (Figure 2F; Video S3). Thus, we have developed a humanized bioengineered model of GBM that recapitulates microtube formation in vitro.
Figure 2. GLICO Tumor Growth Is Supported by a Network of Tumor Microtubes.

(A) Formation of 923 GSC-derived tumor micro-tubes in vitro after 12 days in 2D culture (arrows); scale bar, 200 μm (top) and 100 μm (bottom).
(B) Two-photon microscopy of tumor microtubes (arrows) in GLICO tumor from GFP-positive 923 GSCs; day 10; 3D rendering of GLICO tumor, top; individual z stack images of microtubes, bottom; scale bar, 80 μm; n = 3 organoids.
(C) Electron micrographs of peroxidase-based immunolabeling of connexin-43-positive gap junctions (top) and desmosomes (bottom) in GFP-positive 923 GLICO tumors; scale bars, 500 nm (top) and 100 nm (bottom); n = 5 organoids.
(D) Electron micrographs showing tube-like connections between 923 GLICO tumor cells; arrows indicate peroxidase labeling for connexin-43; scale bars, 2 μm (left) and 500 nm (right).
(E) Cytoplasmic fusion between two 0728 GLICO tumor cells (left) and a cytoplasmic fusion between a neuron and 0728 GLICO tumor cell (right); scale bars, 500 nm (left) and 2 mm (right); m, mitochondria; N, nucleus; N1, neuronal nucleus; N2, 0728 tumor cell nucleus; n = 5 organoids.
(F) Time-lapse image of calcium waves (Rhod-2AM) traveling along 923 GSC microtubes; scale bar, 50 μm. (G) Two-photon microscopy of tumor microtube (arrows) in GLICO tumor from GFP- and RFP-positive 827 GSCs; day 10; n = 3 organoids; scale bar, 80 μm.
Additionally, our electron microscopy studies also revealed multiple desmosome-mediated connections (Figure 2C, bottom) as well as cytoplasmic fusions between not only neighboring tumor cells (Figure 2E, left) but also between neurons and tumor cells (Figure 2E, right). Multiple organelles, including mitochondria, were observed between the nuclei of the fused cells (Figure 2E).
GLICOs and 2D Cultures Exhibit Differential Sensitivity to Chemotherapeutic Agents and Ionizing Radiation
The in vivo tumor microenvironment can have a profound effect on the ability of a tumor cell to respond to cellular stress, including genotoxic damage from chemotherapy and radiotherapy. Such an effect is not recapitulated in standard 2D growth conditions, an oft-cited reason for the poor predictive value of in vitro drug screening for selecting clinically active drugs. We therefore designed experiments to determine whether GSC sensitivity to chemotherapeutic agents and radiation is different in the GLICO model compared with standard 2D growth. For the chemotherapy screens, we used two alkylating agents that are the most frequently clinically prescribed agents in GBM patients: temozolomide (TMZ) and bis-chloroethylnitrosourea (BCNU). Cytotoxicity assays of 2D cultures of 827 and 923 GSCs revealed a dose-dependent decrease in cell viability when cells were treated with TMZ or BCNU. At 7 days post-treatment, TMZ (1 mM) reduced cell viability by more than 80% in both 827 and 923 2D GSCs (Figure S5A). Similarly, BCNU (100 μM) reduced cell viability by more than 90% in both GSC lines (Figure S5A). Despite this dramatic effect in vitro, TMZ (1 mM) treatment in 827 and 923 GLICOs resulted in only 24% and 43% reductions in tumor growth, respectively (Figure 3A). Moreover, BCNU (100 μM) treatment attenuated tumor growth by 91% in 827 GLICOs but only 5% in 923 GLICOs (Figure 3A).
Figure 3. GLICO Tumors Exhibit Differential Response to Therapy and Preserve Key Genetic Changes of Parental Tumor.

(A) Representative fluorescent microscopic images (left) and quantification of secreted luciferase activity (right) for 827 and 923 GLICOs treated with temozolomide (TMZ) or bis-chloroethylnitrosourea (BCNU); n = 4–6 organoids per group; **p < 0.01 and ***p < 0.001; scale bar, 500 μm.
(B) Representative fluorescent microscopic images (left) and quantification of secreted luciferase activity (right) for 923 GLICOs treated with a single dose of 0, 5, or 10 Gy of ionizing radiation; n = 4–6 organoids per group; scale bar, 500 μm.
(C) Quantification of EGFR copy number variation (left) in 2D or GLICO samples from patients with EGFR amplification; ****p < 0.0001. Gender-mismatched 0607 GLICOs or 0810 GLICOS were generated; 0607 (from a female patient) was co-cultured with H1 (from a male embryo)-derived organoids, and 0810 (from a male patient) was co-cultured with H9 (from a female embryo)-derived organoids. Representative images of DNA FISH for EGFR/Cen7/ChrY (Y chromosome) in GLICOs are shown (right); red, EGFR; orange, Cen7; green, ChrY; white arrow indicates tumor cell; n = 5 organoid sections per patient line.
In order to address the effects of ionizing radiation on the growth of GLICO tumors, we first aimed to determine the radiation tolerance of normal cerebral organoids. Normal cerebral organoids were treated with a single dose of 0, 10, or 80 Gy (positive control) and analyzed for cleaved caspase-3 as a marker of apoptosis at 72 h post-irradiation (Figure S5D). Minimal cleaved caspase-3 was detected in non-irradiated organoids and those irradiated with 10 Gy. Conversely, organoids irradiated with 80 Gy as well as those organoids treated with 1 μM staurosporine (additional positive control for apoptosis) revealed high levels of cleaved caspase-3. With this knowledge, we then compared the radiosensitivity of isogenic GSC lines grown in 2D versus in the GLICO model. 923 GSCs were irradiated with 0, 5, or 10 Gy of ionizing radiation, and 72 h post-irradiation, the number of live cells was counted. Compared with the non-irradiated control, 5 and 10 Gy significantly reduced cell viability by more than 44% and 74%, respectively (Figure S5C). We next sought to determine the effects of ionizing radiation on 923 GSCs in the GLICO model. On the basis of the observation that 10 Gy was well tolerated in the normal cerebral organoids, we treated 923 GLICOs expressing secreted luciferase with 0, 5, or 10 Gy and analyzed tumor growth after 1 week. As evident by secreted luciferase activity as well as fluorescent imaging, GLICO tumors irradiated with 5 Gy exhibited similar levels of growth to that of the non-irradiated GLICOs (Figure 3B). Remarkably, 10 Gy slowed tumor growth by little more than 25% compared with 0 Gy.
Taken together, our data clearly demonstrate that, as is often seen in vivo, isogenic GSC lines are highly more resistant to drug and radiation-induced genotoxic stress when grown within the microenvironment of the cerebral organoid (GLICO) than when grown under traditional 2D conditions.
GLICOs Exhibit Similar Growth Rates in Organoids of Different Ages
In an attempt to define how other parameters of the GLICO model may influence tumor growth, we aimed to address whether the age of the organoid affects the growth rate of the GSCs. To do this, we co-cultured Cypridina luciferase-ex pressing 923 GSCs with 1- or 4-month-old H1 hESC-derived cerebral organoids. As evident by the secreted luciferase activity, there was no statistically significant difference in the GSCs’ growth rate within young versus old organoids (Figure 4B). We did, however, observe a difference in the growth patterns of GSCs in the different aged cerebral organoids. GLICO tumors from 1-month-old organoids exhibited large areas of regional proliferation, whereas GLICO tumors from older, 4-month-old organoids displayed a more infiltrative pattern of growth (Figure 4B). Whether this more highly infiltrative pattern in older cerebral organoids is related to the even more aggressive natural history of GBM in elderly patients, compared with younger patients, is unknown at this time.
Both hESC- and iPSC-Derived Cerebral Organoids Facilitate Growth of GLICO Tumors
Because cerebral organoids can be generated from hESCs or iPSCs, we also wanted to determine whether the organoids derived from each group could equally facilitate the growth and invasion of GLICO tumors. To address this important issue, we co-cultured Cypridina luciferase-expressing 923 GSCs with 1-month-old hESC (H1)- or iPSC (H6)-derived cerebral organoids and evaluated tumor growth. Interestingly, there was no statistically significant difference in tumor proliferation as assessed by secreted luciferase activity between hESC-derived versus iPSC-derived GLICOS, as both types of organoids fostered tumor growth (Figure 4C).
GSC Survival Is Attenuated in Absence of Cerebral Organoid Microenvironment
Although GSCs clearly infiltrate and proliferate inside our normal cerebral organoids as demonstrated above, we wanted to verify that GSC-derived tumor growth is not merely a result of pro-proliferative cues from the organoid differentiation medium but rather from the unique relationship between the tumor cells and the organoid’s host microenvironment. Accordingly, we cultured GSCs in vitro in either GSC medium (NBE) or organoid differentiation medium and analyzed cell growth after 7 days. Strikingly, organoid differentiation medium reduced cell growth by at least 70% in all GSC lines (Figure S6A and S6B, **p < 0.01), indicating that the GSCs are not simply proliferating within the organoid as a result of growth factors or nutrients in the organoid medium. To evaluate whether a 3D environment of extracellular matrix (Matrigel) would allow the GSCs to proliferate in the cerebral organoid differentiation medium in the same way they do in our cerebral organoids, we generated Matrigel-embedded pure 923 GSC-derived tumor organoids that express secreted luciferase. Representative images and corresponding quantitation of luciferase activity reveals that GSC-derived tumor organoids can survive within the organoid differentiation medium, but their growth is still substantially reduced compared with the tumor organoids grown in the GSC medium (NBE; Figure S6C). The morphology of the GSCs in the tumor organoids cultured in organoid differentiation medium, compared with that seen in the GSCs in cerebral organoids (GLICO), demonstrated many areas of single cells with punctate fluorescence, an indicator that many cells may be initiating apoptosis in some areas of the tumor organoid (Figure S6C). There was also a marked absence of the tumor microtubes that are routinely observed when the GSCs are cultured in the normal cerebral organoid, as described above. These findings indicate that the cerebral organoid provides a tumor microenvironment that is distinct from that of a tumor organoid, and this microenvironment is important for maintaining and enhancing the viability and growth of the GSCs.
GLICOs Preserve Key Genetic and Signaling Components of the Parental Tumor
In addition to the ability of the GLICO model to recapitulate the invasive phenotype of human GBM, we also aimed to investigate whether GLICO tumors maintain key genetic features and molecular signaling networks of the parental tumors. After informed consent was obtained, CLIA (Clinical Laboratory Improvement Amendments)-certified clinical next-generation sequencing (NGS) was performed on GBM tumor samples from patients undergoing surgical treatment at Weill Cornell Medicine/NewYork-Presbyterian Hospital. On the basis of NGS analysis, we isolated two GSC lines (0607 and 0810) from patients with confirmed EGFR amplification in their respective parental tumors. We then generated gender-mismatched 0607 GLICOs or 0810 GLICOS; 0607 (from a female patient) was co-cultured with H1 (from a male embryo)-derived organoids, and 0810 (from a male patient) was co-cultured with H9 (from a female embryo)-derived organoids. We then performed triple DNA fluorescence in situ hybridization (FISH) for EGFR/Cen7/ChrY. The Y chromosome was used as a method to distinguish tumor cells from normal organoid cells within intact 0607 and 0810 GLICOs. As shown in Figure 3C, both 0607 and 0810 GLICO tumor cells exhibited EGFR amplification compared with the normal organoid-derived cells from their respective GLICOs (****p < 0.0001). In addition, as it has been well described that EGFR amplification is often rapidly lost once GBM cells are cultured in 2D (Humphrey et al., 1988; Pandita et al., 2004), we also assessed EGFR amplification in 2D samples of 0607 and 0810. Our findings revealed that 0810 maintains high levels of EGFR amplification when cultured in 2D, but EGFR amplification is lost in 0607 GSCs (Figure 3C). Thus, the ability of the GLICO model to maintain EGFR amplification, even when such amplification is lost in 2D cultures, suggests that the GLICO may provide a distinct microenvironment that preserves the genetic landscape of the parental tumor.
To determine whether GLICO tumors reflect the same patterns of signaling activation as their respective parental tumors, we simultaneously interrogated the phosphorylation of 49 different receptor tyrosine kinases (RTKs) in patient GBMs and their corresponding GLICOs. As illustrated in Figure S7, phosphorylation of EGFR, related to RTK, and ephrin type-B receptor 3 (EphB3) was observed in both the parental tumor and the corresponding GLICO for GSC lines 0517 and 0810. Furthermore, for sample 0517, phosphorylation of the following kinases was also observed in both the parental tumor and GLICO: tyrosine kinase with immunoglobulin-like and EGF-like domain 1 (Tie-1), TEK RTK (Tie-2), ephrin type-B receptor 2 (EphB2), ephrin receptor A 10 (EphA10), tyrosine-protein kinase Dtk (Dtk), Axl RTK (Axl), and RTK-like orphan receptor 2 (ROR2) (Figure S7). Thus, the signaling profiles of the GLICO tumors are highly reflective of the signaling patterns that are found in the parental tumors.
DISCUSSION
Cancer is not a cell-autonomous disease but rather one in which the biology of the cancer cell and host cell is intimately connected. This is especially true for GBM, which does not metasta-size but instead propagates and ultimately kills patients through diffuse invasion and infiltration into surrounding normal cerebral tissue. Thus, 2D cultures and traditional tumor organoids do not model this critically important cell-cell interaction and tumor microenvironment. Although patient-derived mouse xenograft models address issues of host-tumor cell interactions, the marked interspecies differences at both the gross neuroanatomical (e.g., underdeveloped murine neocortex) and cellular level (e.g., astrocytic dendritic complexity and transmission speed of calcium transients in murine versus human astrocytes) (Oberheim et al., 2009) introduce additional variables. Finally, expensive, labor-intensive mouse models prevent real-time genetic and molecular studies and raise numerous ethical issues limiting their utility for both mechanistic studies and high-throughput drug screening.
The GLICO model addresses a number of the limitations of prior models for it allows one to study patient-specific GBMs ex vivo within a microenvironment similar to that of a primitive human brain. The biological behavior and histopathological features of patient-derived GBMs growing within the cerebral organoids, in a manner that closely phenocopies surgical and autopsy specimens, attest to the clinical relevance of the model. This is further substantiated by the GLICO’s maintenance of patient-specific EGFR amplification and phospho-RTK signaling, as well as the spontaneous formation of GLICO microtubes, microscopic structural features also found in situ. Furthermore, because the model is grown ex vivo, it is amenable to experimental manipulation, drug treatment, and precise control of physiological and environmental variables. Additionally, the model is scalable, enabling one to generate hundreds of patient-specific GLICOs for high-throughput drug screening in a way not currently possible for any in vivo model.
To this end, the ability to successfully screen tumor cells in vitro for clinically active drugs and other interventions has historically been extremely limited, particularly for GBM. Although multiple reasons exist for the poor predicative power of 2D screens for identifying clinically active agents, one undoubtedly important factor has been the failure to model the profound effects of tumor and normal tissue microenvironment and cell-to-cell interactions on tumor cell drug sensitivity. The ability of the GLICO to model these variable drug and radiation responses is encouraging and illustrates the potential of the GLICO to improve upon the predictive efficiency of in vitro and ex vivo therapeutic screens; however, further studies comparing drug sensitivity in GLICO with in vivo tumor drug sensitivities will be required to know for certain. These future studies will also allow us to evaluate how the tumor heterogeneity varies when the same GSCs are grown in GLICO versus orthotopic xenograft models.
The GLICO model is neither complete nor will likely ever be complete, as the technology is expanded to make the model an ever closer representative of the human clinical disease. The model is amenable to new bioengineering methodologies as evidenced by the recent demonstration that pluripotent stem cell self-organization around a microfilament scaffold (Lancaster et al., 2017) may reduce intra-organoid neuroanatomical variability and induce a component of organoid patterning. We and our colleagues are also using novel bioengineering approaches to introduce a perfused vasculature (with blood-brain barrier characteristics) and an immunologic niche given the potential autologous nature of the model.
In summary, the human cerebral organoid represents an excellent opportunity to explore the biological consequences of human CNS tissue on human glioma growth through a model system that is easily manipulated both genetically and pharmacologically. Capable of real-time imaging at the microscopic level, cerebral organoids and GSCs offer a powerful tool for investigating GBM biology in a primitive human brain environment and for modeling diverse therapeutic interventions.
STAR★METHODS
CONTACT FOR REAGENT AND RESOURCE SHARING
Further information and requests for reagents may be directed to and will be fulfilled by the Lead Contact, Howard A. Fine (haf9016@med.cornell.edu).
EXPERIMENTAL MODEL AND SUBJECT DETAILS
Patient-Derived GSCs
Following informed consent, tumor samples classified as glioblastoma, based on the World Health Organization (WHO) criteria, were obtained from patients undergoing surgical treatment at the National Institutes of Health (NIH) or from Weill Cornell Medicine/New York Presbyterian Hospital in accordance with the appropriate Institutional Review Boards. Within 1–3 hours after surgical removal, tumors were washed in PBS and enzymatically dissociated into single cells. Tumor cells were cultured in NBE medium consisting of neurobasal medium (Thermo Fisher Scientific), N2 and B27 supplements (Thermo Fisher Scientific), and human recombinant bFGF and EGF (25 ng/mL each; R&D Systems) plus Heparin sodium and L-Glutamine. Regular mycoplasma screening was performed using the MycoAlert Detection Kit (Lonza Inc.).
hESCs and Induced Pluripotent Stem Cells
NIH-registered human H1 (WA01) or H9 (WA09) embryonic stem cells were purchased from WiCell Research Institute, Inc. and maintained in mTeSR1 medium (STEMCELL Technologies). H6 induced pluripotent stem cells were a generous gift from the Laboratory of Todd Evans at Weill Cornell Medicine.
METHOD DETAILS
Cerebral Organoid Generation
Once hESC colonies reached 80% confluency, cells were plated in low-attachment 96-well plates (9,000 cells per 150 μL of STEMdiff Neural Induction Medium (STEMCELL Technologies)). Embryoid bodies were fed every other day for 6–7 days; medium contained 50 mM Rho-associated protein kinase (ROCK) inhibitor for the first 4 days. To initiate neural rosette formation, embryoid bodies were transferred to Matrigel-coated (Corning #354277) 6-well plates where they received daily medium changes (STEMdiff Neural Induction, STEMCELL Technologies) for 6–7 days. Neural rosettes were then replated a second time to increase purity for an additional 5–7 days. Following the second round of formation, neural rosette clusters were transferred to droplets of Matrigel (Corning #356234) by pipetting into cold Matrigel on a sheet of Parafilm. Droplets were solidified at 37°C and were subsequently grown without agitation for 4 days in differentiation medium containing a 1:1 mixture of DMEM/F12 and Neurobasal, 1:200 N2 supplement (Thermo Fisher Scientific), 1:100 B27 supplement without vitamin A (Thermo Fisher Scientific), 87.5 μL of 1:100 2-mercaptoethanol, 1:4,000 insulin (Sigma), 1:100 Glutamax (Thermo Fisher Scientific) and 1:200 MEM-NEAA. Following this stationary growth phase, the tissue droplets were transferred to a spinning bioreactor or orbital shaker containing differentiation medium as described above except a B27 supplement with vitamin A (Thermo Fisher Scientific) was used.
Co-Culture of GSCs and Cerebral Organoids
To establish cells that stably express GFP, GSCs were transfected with pLenti PGK GFP Blast (w510–5) (Campeau et al., 2009) (Addgene) and were cultured under blasticidin selection in NBE medium. For co-culture experiments, individual organoids were transferred to a 24-well plate (one organoid per well). Excess medium was removed, and 10,000 stable GFP-expressing GSCs were plated in each organoid-containing well (10,000 GSCs/2 mL of NBE per well). Plates were incubated at 37°C for 24 hr with no agitation. Each organoid was subsequently washed in PBS and transferred to a clean well with 2 mL of organoid differentiation medium. Tumor-bearing organoids were maintained on an orbital shaker for up to 14 days at 37°C.
Two-Photon Microscopy
For two-photon imaging of tumor volume and tumor microtubes, stable GFP-expressing 923 or RFP-expressing 827 GSCs were co-cultured with cerebral organoids for 24 hr. GLICO tumors were allowed to grow for 10 days prior to imaging. All images were acquired using an Olympus FluoView FVMPE-RS multi-photon microscope and a Mai Tai DeepSee ultrafast laser (Spectra Physics) tuned to 920 nm for GFP excitation. For optimal spatial resolution, image stacks were acquired in dual galvanometer scanning mode using a high-sensitivity gallium arsenide phosphide (GaAsP) detector with a green-light filter cube and a 25X, 1.05 numerical aperture (NA) objective with a 2-mm working distance (Olympus). Each high-resolution image stack (640×640 pixels, 4 μs dwell time, 3 μm step size) spanned ~525×525 μm (XY) and up to 600 μm in Z. The images in Figure 3B are max projections over the Z axis through 100–250 μm of tissue. All image analysis was produced by ImageJ/Fiji software. The number of organoids used per experiment is stated for each individual figure.
Bioluminescence Imaging of GLICO Tumors
To establish cells that stably express firefly luciferase, 923 GSCs were transfected with pGL4.50[luc2/CMV/Hygro] (Promega) and were cultured under hygromycin selection in NBE medium. Luciferase-expressing 923 GSCs were co-cultured with cerebral organoids for 24 hours. GLICO tumors were allowed to form for 8 days with gentle shaking. GLICO tumors containing parental GSCs that did not express luciferase were used as negative controls for imaging. Luciferin was added to the organoid medium 1 hour prior to imaging (100 mM in 2 mL medium). Using a 24-well black-walled plate, GLICO tumors were imaged on an IVIS SpectrumCT imaging platform (PerkinElmer). Luminescent images were generated using Living Image software. For studies in which tumor growth was monitored using secreted luciferase, 827 or 923 GSCs were stably transduced with pLenti-TurboRFP-P2A-CLuc and cultured under neomycin selection in NBE medium. Luciferase-expressing GSCs were co-cultured with cerebral organoids for 24 hours. GLICO tumor growth was monitored by assaying the culture medium for secreted luciferase acitivity at Day 8 and Day 18 after co-culture. Tumor growth of pLenti-C-tRFP-expressing control GSCs was monitored in tandem. The number of organoids used per experiment is stated for each individual figure.
Light Sheet Microscopy of GLICO Tumors
Organoids were collected with ice cold PBS and transferred to 1X PBS/4% PFA at 4°C overnight with shaking and then left at room temperature for 1 hr. Organoids were then washed with 1X PBS with shaking 3 times and dehydrated in a series of methanol exposures. Samples were bleached in 5% H2O2, in 20% DMSO/methanol overnight at 4°C. Organoids were transferred to 30% H2O2 /1 volume DMSO/4 volumes methanol overnight at 4°C. Following methanol washes and rehydration, samples were embedded in 1% agarose prepared in TAE buffer. For immunolabeling, organoids were pretreated and incubated in 1X PBS/0.2%Triton X-10020%/DMSO/0.3M glycine at 37°C overnight. Samples were then blocked in 1X PBS/0.2% Triton X-100/10%/DMSO/6% Donkey Serum at 37°C for 3 days then washed again in 1X PBS/0.2%Tween-20 with 10ug/ml heparin (PTwH), at room temperature 1hr, 2 times. Organoids were incubated with primary antibody to target GFP expressing cells to reduce autofluorescence diluted in PTwH/5% DMSO/3%Donkey Serum at 37°C for 4 days. For sample clearing, organoid samples were incubated overnight in 50% Tetrahdrofuran/H2O (THF, Sigma) in a glass vial with silicon coated cap (Thermo Scientific). Samples were incubated for 1 hr in 80% THF, 2 times for 1 hr in 100% THF and then incubated in Dichloromethane (DCM, Sigma) for 5 min to 1 hr (until samples sank). Organoids were then incubated in DiBenzyl Ether (Sigma) until the sample was clear (20 min to 2 hr). All images were acquired with an Ultravision II La Biotec bidirectional triple light-sheet microscope. Stacks of 130 images with 1.04 μm between planes were acquired for the GFP signal and pseudocolored red. All image processing and analysis was done using Imaris software and where 3D rendering was appropriate.
Proliferation of GSCs in Organoid Differentiation Medium
GSCs were seeded in triplicate into 12 well plates (100,000 cells/well) with either GSC medium (NBE) or organoid differentiation medium. Live cells were counted after 7 days. A Student t test was performed, and statistical significance was defined as p < 0.05. Data are presented as mean values with 95% confidence intervals. For tumor organoid experiments, 100,000 luciferase-expressing GSCs were plated in 50 μL Matrigel and allowed to grow in either GSC medium (NBE) or organoid differentiation medium. Luciferase levels were measured after 7 days of tumor cell growth using the Cypridina Luciferase Glow Assay Kit (Pierce). The number of organoids analyzed is indicated in the figure legend.
Immunofluorescence and Histopathological Evaluation
Cerebral organoids were fixed in 4% paraformaldehyde for 45 minutes at room temperature followed by three PBS washes for 10 minutes each. Samples were incubated in 30% sucrose overnight and embedded in OCT for cryosectioning. Frozen sections (10 μm thickness) were stained with hematoxylin and eosin or used for immunostaining. Sections were blocked and permeabilized in 0.3% Triton X-100 and 3% normal goat serum in PBS. The following primary antibodies were used: N-cadherin (Cell Signaling, 13116S, 1:200), SOX2 (Cell Signaling, 3579S, 1:200), TUJ1 (BioLegend, 845502, 1:200), PAX6 (Santa Cruz, sc-81649, 1:200), TBR2 (Abcam, ab23345, 1:200), MAP2 (Cell Signaling, 4542S, 1:200), Musashi-1 (Cell Signaling, 85652S, 1:200), Nestin (BioLegend, 841801, 1:200), and GFAP (IHC: Cell Signaling, 12389S, 1:200; IF: Dako, ZO334, 1:1000). Secondary antibodies used were goat Alexa Fluor 488 and 594 conjugates (Thermo Fisher Scientific, 1:500). For immunofluorescence, DAPI (4, 6-diamidino-2 -phenylindole, dihydrochloride) was used as a counterstain at a concentration of 1.0 μg/mL in PBS. Histopathologic evaluation was performed by board-certified neuropathologist, Dr. Matija Snuderl (NYU Langone Medical Center).
Fluorescence In Situ Hybridization (FISH) for EGFR Amplification
Following informed consent, tumor samples classified as glioblastoma, based on the World Health Organization (WHO) criteria, were obtained from patients undergoing surgical treatment at the National Institutes of Health (NIH) or from Weill Cornell Medicine/New York Presbyterian Hospital in accordance with the appropriate Institutional Review Boards. Samples were then sent for targeted next generation sequencing (NGS) for > 300 cancer-related genes (FoundationOne, Foundation Medicine Inc., Cambridge, MA). Once the EGFR amplification status was verified by NGS, GSCs from two EGFR-amplified tumors (0607 and 0810) were used to generate gender-mismatched 0607 GLICOs or 0810 GLICOS; 0607 (from female patient) was co-cultured with H1 (from male embryo)-derived organoids, and 0810 (from male patient) was co-cultured with H9 (from female embryo)-derived organoids. We then performed triple DNA FISH for EGFR/Cen7/Y chromosome. The Y chromosome was used as a method to distinguish tumor cells from normal organoid cells within intact 0607 and 0810 GLICOs. After two weeks of incubation on an orbital shaker, GSCs from GLICO tumors were harvested and fixed in methanol:acetic acid (3:1) as per standard procedures. FISH analysis was performed on fixed cells using a home-brew EGFR/Cen7/ChrY probe. The probe mix consisted of PAC/BAC clones containing the full length EGFR gene (clones RP5–1019E12, and RP11–339F13; labeled with Red dUTP) and a centromeric repeat plasmid for chromosome 7 served as the control (clone p7t1; labeled with Orange dUTP). The ChrY probe detects the Y chromosome; labeled with Green dUTP. Probe labeling, hybridization, post-hybridization washing, and fluorescence detection were performed according to standard laboratory procedures. Slides were scanned using a Zeiss Axioplan 2i epifluorescence microscope equipped with a megapixel CCD camera (CV-M4+CL, JAI) controlled by Isis 5.5.9 imaging software (MetaSystems Group Inc, Waltham, MA). The entire hybridized area was first scanned through 63X or 100X objective to assess quality of hybridization and signal pattern. For each sample, a minimum of 100 discrete nuclei and 25 metaphases (when available) were scored. Amplification was defined as EGFR:Cen 7 ratio of ≥ 2.0, ≥ 6 copies of EGFR (independent of control locus) or at least one small cluster of Gene (≥4 signals resulting from tandem repeat/duplication). In cells with high-level amplification, signals ≥ 20 cannot be accurately counted and therefore given a score of 20.
Drug Treatment of GSCs and GLICOs
For 2D cultures, 827 and 923 GSCs were plated in triplicate at a density of 100,000 cells per well in 6-well plates. Cells were treated with either TMZ (200 μM, 500 μM, or 1 mM) or BCNU (10 μM, 25 μM, 50 μM, or 100 μM). 7 days post-treatment, live cells were counted using the trypan blue dye-exclusion assay. For GLICOs, cerebral organoids were co-cultured with 100,000 827 or 923 luciferase-expressing GSCs and allowed to grow for 5 days. GLICOs were then treated with 1 mM TMZ or 100 μM BCNU. Luciferase levels were measured at Day 0 and 7 days post-treatment using the
Cypridina Luciferase Glow Assay Kit (Pierce)
The number of organoids used per experiment is stated for each individual figure.
Irradiation of GSCs and GLICOs
For 2D cultures, 923 GSCs were plated in triplicate at a density of 300,000 per well in 6-well plates. 48 hours later, cells were irradiated with 0 Gy, 5 Gy, or 10 Gy using a Shepherd Mark-1 Cesium-137 Irradiator at a dose rate of 9.75 Gy/min. At 72 hours post-irradiation, live cells were counted using the trypan blue dye-exclusion assay. For irradiation of 923 GLICOs, cerebral organoids were co-cultured with 100,000 923 luciferase-expressing GSCs and allowed to grow for 5 days. GLICOs were then irradiated with 0, 10, or 80 Gy using a Shepherd Mark-1 Cesium-137 Irradiator at a dose rate of 9.75 Gy/min. Luciferase levels were measured at Day 0 and 7 days post-irradiation using the Cypridina Luciferase Glow Assay Kit (Pierce). The number of organoids used per experiment is stated for each individual figure.
Immunohistochemistry for Cleaved Caspase-3
Paraffin sections from cerebral organoids treated with 0 Gy, 10 Gy, 80 Gy or Staurosporine (Sigma, St. Louis, MO; 1 mM for 72 hr) were rehydrated and washed in phosphate buffered saline (PBS). Then, they were incubated in HistoReveal (Abcam, Cambridge, MA) for 5 min at room temperature. Sections were then washed in PBS and blocked with 3% goat serum with 0.3% Triton X-100 for 30 minutes at room temperature. Primary anti-cleaved caspase-3 antibody (Cell Signaling Technologies, Inc., Danvers, USA) was applied to the sections with overnight incubation at 4°C. Sections were washed in PBS and incubated with the Alexa 568 secondary antibody (Molecular Probes-Life Technologies, Grand Island, USA). Washed in PBS, nuclear counterstaining was done with NucBlue™stain solution (Molecular Probes-Life Technologies, Grand Island, USA) before microscopic analysis with an Evos FL Auto imaging system (Carlsbad, CA); n = 4 organoids per group.
Immunofluorescence for Ki67 and GFP
923 GFP-expressing GLICOs were fixed in 4% paraformaldehyde for 45 minutes at room temperature followed by three PBS washes for 10 minutes each and then embedded in paraffin. Sections of 5 μm were obtained using microtome on poly-lysine-coated slides. Following deparaffinization and rehydration, antigen retrieval was performed by submerging the slides in Trilogy solution (Sigma, 920P) by heat in a pressure cooker for 15 min. Sections were permeabilized for 20 min with PBS/0.5% Triton X-100 at R.T. and blocked 1 hr with PBS/3% BSA. Each section was incubated O.N. at 4°C with primary antibodies against GFP (Abcam, ab13970, 1:200) and Ki-67 (Cell Signaling, 9129, 1:200), followed by an incubation with the secondary antibodies coupled to Alexa 488 (Invitrogen, A11039, 1:200) and Alexa 568 (Invitrogen, A11036, 1:200) for 1h at RT. Nuclei were counterstained with DAPI. Images were obtained using an epifluorescence microscope, processed and analyzed using the Fiji software. The number of Ki67 and GFP positive cells was quantified and expressed as a percentage of the total GFP positive cells. At least 500 GFP positive cells were included from each sample over three different fields at 200x. The result is shown as the mean ± standard error of three independent experiments; n = 3 organoids.
EdU Labeling and Immunofluorescence
Cell proliferation was assessed in 923 GFP-expressing GLICOs using the 9129
Click-iT EdU Alexa Fluor 594 Imaging Kit (Thermo, C10339). Briefly, GLICOS were treated for 48h with 20 μM EdU (5-ethynyl-2′-deoxyuridine) and fixed in 4% paraformaldehyde for 45 minutes at room temperature, followed by three PBS washes for 10 minutes each and then embedded in paraffin. Sections of 5 μm were obtained using microtome on polylysine-coated slides. Following deparaffinization and rehydration, antigen retrieval was performed using HistoReveal solution (Abcam, ab103720) during 15 min at R.T. Sections were permeabilized for 20 min with PBS/0.5% Triton X-100 at R.T. The Click-iT reaction was conducted following manufacturer’s instructions. Next, antibody labeling for GFP was performed as described before. Nuclei were counterstained with DAPI. Images were obtained using an epifluorescence microscope, processed and analyzed; n = 3 organoids.
Quantitative RT-PCR (qPCR)
Total RNA was extracted from 827 GFP-expressing GLICO samples using RNeasy Mini Kit (QIAGEN) and reverse transcription reaction was carried out using High-Capacity RNA-to-cDNA Kit (Thermo Fisher Scientific), according to the manufacturer’s protocols. The resulting cDNA was amplified with gene-specific primers, eGFP F – ACGTAAACGGCCACAAGTTC; eGFP R – AAGTCGTGC TGCTTCATGTG; hGAPDH F – TGCACCACCAACTGCTTAGC; hGAPDH R – GGCATGGACTGTGGTCATGAG and quantified using QuantiFast SYBR Green PCR Kit (QIAGEN) on QuantStudio 6 Flex Real-Time PCR System (Applied Biosystems). Comparative Ct (ΔΔCt) method was used for performing relative quantitation of gene expression.
Human Phospho-RTK Arrays
Proteome Profiler human phospho-RTK antibody arrays (R&D Systems) were used according to the manufacturer’s instructions. A total of 50 μg of fresh protein lysates from 3–5 GLICO tumors and their corresponding parental tumor tissue were incubated overnight with nitrocellulose membranes dotted with duplicate spots for 49 anti-RTK and control antibodies. Bound phospho-RTKs were detected with a pan anti-phospho-tyrosine antibody conjugated to horseradish peroxidase using chemiluminescence.
Electron Microscopy
Cerebral organoids were fixed with 3.75% acrolein and 2% paraformaldehyde in 0.1M phosphate buffer (PB; pH7.4) overnight at 4°C(Milner et al., 2011). The next day, the sections were rinsed in PB. Two experiments were performed. Experiment 1: Normal Morphology-Following en bloc staining with uranyl acetate and graded ethanol dehydration, samples were embedded in an Epon analog resin. Ultrathin sections (65 nm) were contrasted with lead citrate for use in electron microscopy. Experiment 2: Connexin-43 Immunolabeling – Free-floating cerebral organoids were incubated with anti-connexin-43 (Sigma; 1:2000) and a goat-anti-rabbit IgG-biotinylated secondary antibody (Jackson Immunoresearch Laboratories; 1:400) using the avidin-biotin complex peroxidase method (Vectastain ABC-HRP Kit; Vector Laboratories) (Milner et al., 2011). Organoids were dehydrated and flat-embedded in EMBed-812. Organoids were sectioned (70 nm thick) on a Leica ultratome (Ultracut UCT) and collected on 400 mesh copper grids and then counterstained with uranyl acetate and Reynold’s lead citrate. For both experiments, grids were imaged on an FEI Tecnai BioTwin Transmission Electron Microscope. Elements were identified using morphological criteria defined in Peters et al. (1991). The number of organoids used per experiment is stated for each individual figure.
Calcium Imaging of Tumor Microtubes
The following small molecule calcium indicator, 5 μM Rhod-2AM (Life Technologies, R-1244), was applied to GFP-expressing 923 GSC tumor microtubes. Time-lapse microscopy of calcium signaling was recorded for 3 minutes.
QUANTIFICATION AND STATISTICAL ANALYSIS
Results were analyzed using GraphPad Prism 7. For 2D experiments, cells were plated in triplicate; results were verified from three independent experiments. Statistical data for all experiments was analyzed using two-tailed Student’s t tests. Figure legends define the sample size and significance. Data were judged to be statistically significant when p < 0.05; standard error bars correspond to 95% confidence intervals.
Supplementary Material
KEY RESOURCES TABLE
| REAGENT or RESOURCE | SOURCE | IDENTIFIER |
|---|---|---|
| Antibodies | ||
| Rabbit monoclonal anti-N-Cadherin | Cell Signaling | Cat#13116S; RRID: AB_2687616 |
| Rabbit monoclonal anti-SOX2 | Cell Signaling | Cat# 3579S; RRID: AB_2195767 |
| Mouse polyclonal anti-TUJ1 | BioLegend | Cat# 801201; RRID: AB_2313773 |
| Mouse monoclonal anti-PAX6 | Santa Cruz | Cat# sc-81649; RRID: AB_1127044 |
| Rabbit polyclonal anti-TBR2 | Abcam | Cat#ab23345; RRID: AB_778267 |
| Rabbit polyclonal MAP2 | Cell Signaling | Cat# 4542S; RRID: AB_10693782 |
| Rabbit monoclonal Musashi | Cell Signaling | Cat# 85652S; N/A |
| Rabbit polyclonal Nestin | BioLegend | Cat#841801; RRID: AB_2565467 |
| Rabbit monoclonal anti-GFAP | Cell Signaling | Cat# 12389S; RRID: AB_2631098 |
| Rabbit polyclonal anti-GFAP | Dako | Cat# ZO334; N/A |
| Rabbit polyclonal anti-Connexin-43 | Sigma Aldrich | Cat# C6219; RRID: AB_476857 |
| Chicken polyclonal anti-GFP | Abcam | Cat#ab13970; RRID: AB_300798 |
| Rabbit monoclonal anti-Ki67 | Cell Signaling | Cat#9129;N/A |
| Rabbit polyclonal Cleaved Caspase-3 | Cell Signaling | Cat#9661; RRID: AB_2341188 |
| Goat anti-mouse Alexa Fluor 488 | Thermo Fisher Scientific | Cat# A11001; RRID: AB_2534069 |
| Goat anti-rabbit Alexa Fluor 594 | Thermo Fisher Scientific | Cat# A11012; RRID: AB_2534079 |
| Goat anti-rabbit Alexa Fluor 568 | Thermo Fisher Scientific | Cat#A11036; RRID: AB_10563566 |
| Goat anti-chicken Alexa Fluor 488 | Thermo Fisher Scientific | Cat#A11039; RRID: AB_2534096 |
| Goat polyclonal anti-mouse IgG-HRP | Thermo Fisher Scientific | Cat# 31430; RRID: AB_228307 |
| Goat polyclonal anti-rabbit IgG-HRP | Thermo Fisher Scientific | Cat# 31460; RRID: AB_228341 |
| Goat polyclonal anti-rabbit IgG-Biotin | Jackson ImmunoResearch Laboratories | Cat# 111-065-003; RRID: AB_2337959 |
| Chemicals, Peptides, and Recombinant Proteins | ||
| ROCK inhibitor (Y-27632 2HCI) | Selleck Chemicals | Cat# S1049; N/A |
| Rhod-2AM | Invitrogen | Cat# R-1244; N/A |
| Staurosporine | Sigma-Aldrich | Cat#S6942; N/A |
| Critical Commercial Assays | ||
| VECTASTAIN Elite ABC-HRP Kit | Vector Laboratories | Cat# PK-7200; RRID:AB_2336828 |
| Proteome Profiler Array | R&D Systems | Cat# ARY001B; N/A |
| Click-iT EdU Alexa Fluor 594 Imaging Kit | Thermo Fisher Scientific | Cat#C10339; N/A |
| QuantiFast SYBR Green PCR Kit | QIAGEN | Cat#204054; N/A |
| Cypridina Luciferase Glow Assay Kit | Pierce; Thermo Fisher Scientific | Cat#16170; N/A |
| Experimental Models: Cell Lines | ||
| Patient-Derived Glioma Stem Cells: 827, 1228, 211, 923, 308, 0728, 0320, 0517, 0607, 0810, and 1206 | National Institutes of Health and Weill Cornell Medicine/NYU Presbyterian Hospital | N/A |
| NIH-registered human H1 (WA01) embryonic stem cells | WiCell Research Institute | Cat# WA01; RRID: CVCL_9771 |
| NIH-registered human H9 (WA09) embryonic stem cells | WiCell Research Institute | Cat# WA09; RRID: CVCL_9773 |
| Recombinant DNA | ||
| pLenti PGK GFP Blast (w510-5) | Campeau et al., 2009 | Addgene Plasmid# 19069 |
| pGL4.50[luc2/CMV/Hygro] | Promega | Cat# E1310; N/A |
| pLenti-C-tRFP | OriGene | Cat# PS100074 |
| pLenti-C-TurboRFP-P2A-CLuc | Constructed in Lab | N/A |
| Software and Algorithms | ||
| ImageJ | NIH | https://imagej.nih.gov/ij/; RRID: nif-0000-30467 |
| Living Image | Living Image | Cat# 128113; http://www.perkinelmer.com/product/li-software-for-spectrum-1-seat-add-on-128113 |
| GraphPad Prism 7 | GraphPad | RRID: SCR_000306 |
Highlights.
Glioma stem cells home toward, invade, and proliferate in human cerebral organoids
GLICO (cerebral organoid glioma) tumors phenocopy patient glioblastoma
Tumor microtubes promote the invasion of GLICO tumors into normal host tissue
The GLICO model is a tool to study GBM biology in a human brain environment
ACKNOWLEDGMENTS
We gratefully acknowledge Sushmita Mukherjee for her assistance with multi-photon microscopic analysis of tumor volume, as well as Arline Faustin and Luis Chiriboga for their assistance with immunohistochemistry. We thank the WCM Imaging Core and WCM Neuroanatomy EM Core in the Feil Family Brain and Mind Research Institute. We also thank the MSKCC Molecular Cytogenetics Core for their assistance with FISH. Work in H.F.’s laboratory is supported by an NIH Director Pioneer Award (1DP1CA228040–01).
Footnotes
SUPPLEMENTAL INFORMATION
Supplemental Information can be found with this article online at https://doi.org/10.1016/j.celrep.2019.02.063.
DECLARATION OF INTERESTS
The authors declare no competing interests.
REFERENCES
- Anisimov VN, Ukraintseva SV, and Yashin AI (2005). Cancer in rodents: does it tell us about cancer in humans? Nat. Rev. Cancer 5, 807–819. [DOI] [PubMed] [Google Scholar]
- Bao S, Wu Q, McLendon RE, Hao Y, Shi Q, Hjelmeland AB, Dewhirst MW, Bigner DD, and Rich JN (2006). Glioma stem cells promote radioresistance by preferential activation of the DNA damage response. Nature 444, 756–760. [DOI] [PubMed] [Google Scholar]
- Baysan M, Bozdag S, Cam MC, Kotliarova S, Ahn S, Walling J, Killian JK, Stevenson H, Meltzer P, and Fine HA (2012). G-cimp status prediction of glioblastoma samples using mRNA expression data. PLoS ONE 7, e47839. [DOI] [PMC free article] [PubMed] [Google Scholar]
- Baysan M, Woolard K, Bozdag S, Riddick G, Kotliarova S, Cam MC, Belova GI, Ahn S, Zhang W, Song H, et al. (2014). Micro-environment causes reversible changes in DNA methylation and mRNA expression profiles in patient-derived glioma stem cells. PLoS ONE 9, e94045. [DOI] [PMC free article] [PubMed] [Google Scholar]
- Campeau E, Ruhl VE, Rodier F, Smith CL, Rahmberg BL, Fuss JO, Campisi J, Yaswen P, Cooper PK, and Kaufman PD (2009). A versatile viral system for expression and depletion of proteins in mammalian cells. PLoS ONE 4, e6529. [DOI] [PMC free article] [PubMed] [Google Scholar]
- Dragunow M (2008). The adult human brain in preclinical drug development. Nat. Rev. Drug Discov. 7, 659–666. [DOI] [PubMed] [Google Scholar]
- Elkabetz Y, Panagiotakos G, Al Shamy G, Socci ND, Tabar V, and Studer L (2008). Human ES cell-derived neural rosettes reveal a functionally distinct early neural stem cell stage. Genes Dev. 22, 152–165. [DOI] [PMC free article] [PubMed] [Google Scholar]
- Gould SE, Junttila MR, and de Sauvage FJ (2015). Translational value of mouse models in oncology drug development. Nat. Med 21, 431–439. [DOI] [PubMed] [Google Scholar]
- Holland EC (2001). Gliomagenesis: genetic alterations and mouse models. Nat. Rev. Genet 2, 120–129. [DOI] [PubMed] [Google Scholar]
- Humphrey PA, Wong AJ, Vogelstein B, Friedman HS, Werner MH, Bigner DD, and Bigner SH (1988). Amplification and expression of the epidermal growth factor receptor gene in human glioma xenografts. Cancer Res. 48, 2231–2238. [PubMed] [Google Scholar]
- Huszthy PC, Daphu I, Niclou SP, Stieber D, Nigro JM, Sakariassen PO, Miletic H, Thorsen F, and Bjerkvig R (2012). In vivo models of primary brain tumors: pitfalls and perspectives. Neuro-oncol. 14, 979–993. [DOI] [PMC free article] [PubMed] [Google Scholar]
- Hutchinson L, and Kirk R (2011). High drug attrition rates—where are we going wrong? Nat. Rev. Clin. Oncol 8, 189–190. [DOI] [PubMed] [Google Scholar]
- John Lin CC, Yu K, Hatcher A, Huang TW, Lee HK, Carlson J, Weston MC, Chen F, Zhang Y, Zhu W, et al. (2017). Identification of diverse astrocyte populations and their malignant analogs. Nat. Neurosci 20, 396–405. [DOI] [PMC free article] [PubMed] [Google Scholar]
- Jucker M (2010). The benefits and limitations of animal models for translational research in neurodegenerative diseases. Nat. Med 16, 1210–1214. [DOI] [PubMed] [Google Scholar]
- Lancaster MA, Renner M, Martin CA, Wenzel D, Bicknell LS, Hurles ME, Homfray T, Penninger JM, Jackson AP, and Knoblich JA (2013). Cerebral organoids model human brain development and microcephaly. Nature 501, 373–379. [DOI] [PMC free article] [PubMed] [Google Scholar]
- Lancaster MA, Corsini NS, Wolfinger S, Gustafson EH, Phillips AW, Burkard TR, Otani T, Livesey FJ, and Knoblich JA (2017). Guided self-organization and cortical plate formation in human brain organoids. Nat. Biotechnol 35, 659–666. [DOI] [PMC free article] [PubMed] [Google Scholar]
- Lee J, Kotliarova S, Kotliarov Y, Li A, Su Q, Donin NM, Pastorino S, Purow BW, Christopher N, Zhang W, et al. (2006). Tumor stem cells derived from glioblastomas cultured in bFGF and EGF more closely mirror the phenotype and genotype of primary tumors than do serum-cultured cell lines. Cancer Cell 9, 391–403. [DOI] [PubMed] [Google Scholar]
- Lee J, Son MJ, Woolard K, Donin NM, Li A, Cheng CH, Kotliarova S, Kotliarov Y, Walling J, Ahn S, et al. (2008). Epigenetic-mediated dysfunction of the bone morphogenetic protein pathway inhibits differentiation of glioblastoma-initiating cells. Cancer Cell 13, 69–80. [DOI] [PMC free article] [PubMed] [Google Scholar]
- Lu P, Weaver VM, and Werb Z (2012). The extracellular matrix: a dynamic niche in cancer progression. J. Cell Biol. 196, 395–406. [DOI] [PMC free article] [PubMed] [Google Scholar]
- Masurkar AV, and Chen WR (2012). The influence of single bursts versus single spikes at excitatory dendrodendritic synapses. Eur. J. Neurosci 35, 389–401. [DOI] [PMC free article] [PubMed] [Google Scholar]
- Milner TA, Waters EM, Robinson DC, and Pierce JP (2011). Degenerating processes identified by electron microscopic immunocytochemical methods. Methods Mol. Biol 793, 23–59. [DOI] [PubMed] [Google Scholar]
- Oberheim NA, Takano T, Han X, He W, Lin JH, Wang F, Xu Q, Wyatt JD, Pilcher W, Ojemann JG, et al. (2009). Uniquely hominid features of adult human astrocytes. J. Neurosci 29, 3276–3287. [DOI] [PMC free article] [PubMed] [Google Scholar]
- Osswald M, Jung E, Sahm F, Solecki G, Venkataramani V, Blaes J, Weil S, Horstmann H, Wiestler B, Syed M, et al. (2015). Brain tumour cells interconnect to a functional and resistant network. Nature 528, 93–98. [DOI] [PubMed] [Google Scholar]
- Pandita A, Aldape KD, Zadeh G, Guha A, and James CD (2004). Contrasting in vivo and in vitro fates of glioblastoma cell subpopulations with amplified EGFR. Genes Chromosomes Cancer 39, 29–36. [DOI] [PubMed] [Google Scholar]
- Perrin S (2014). Preclinical research: Make mouse studies work. Nature 507, 423–425. [DOI] [PubMed] [Google Scholar]
- Peters A, Palay SL, and Webster H.d. (1991). The Fine Structure of the Nervous System: Neurons and Their Supporting Cells, Third Edition (Oxford University Press; ). [Google Scholar]
- Quail DF, and Joyce JA (2017). The microenvironmental landscape of brain tumors. Cancer Cell 31, 326–341. [DOI] [PMC free article] [PubMed] [Google Scholar]
- Rubenstein BM, and Kaufman LJ (2008). The role of extracellular matrix in glioma invasion: a cellular Potts model approach. Biophys. J 95, 5661–5680. [DOI] [PMC free article] [PubMed] [Google Scholar]
- Sansom SN, Griffiths DS, Faedo A, Kleinjan DJ, Ruan Y, Smith J, van Heyningen V, Rubenstein JL, and Livesey FJ (2009). The level of the transcription factor Pax6 is essential for controlling the balance between neural stem cell self-renewal and neurogenesis. PLoS Genet. 5, e1000511. [DOI] [PMC free article] [PubMed] [Google Scholar]
- Shroyer NF (2016). Tumor Organoids Fill the Niche. Cell Stem Cell 18, 686–687. [DOI] [PubMed] [Google Scholar]
- Sloan SA, Darmanis S, Huber N, Khan TA, Birey F, Caneda C, Reimer R, Quake SR, Barres BA, and Pasca SP (2017). Human astrocyte maturation captured in 3D cerebral cortical spheroids derived from pluripotent stem cells. Neuron 95, 779–790.e6. [DOI] [PMC free article] [PubMed] [Google Scholar]
- Son MJ, Woolard K, Nam DH, Lee J, and Fine HA (2009). SSEA-1 is an enrichment marker for tumor-initiating cells in human glioblastoma. Cell Stem Cell 4, 440–452. [DOI] [PMC free article] [PubMed] [Google Scholar]
- Stupp R, Mason WP, van den Bent MJ, Weller M, Fisher B, Taphoorn MJ, Belanger K, Brandes AA, Marosi C, Bogdahn U, et al. ; European Organisation for Research and Treatment of Cancer Brain Tumor and Radio-therapy Groups; National Cancer Institute of Canada Clinical Trials Group (2005). Radiotherapy plus concomitant and adjuvant temozolomide for glioblastoma. N. Engl. J. Med 352, 987–996. [DOI] [PubMed] [Google Scholar]
- Tentler JJ, Tan AC, Weekes CD, Jimeno A, Leong S, Pitts TM, Arcaroli JJ, Messersmith WA, and Eckhardt SG (2012). Patient-derived tumour xenografts as models for oncology drug development. Nat. Rev. Clin. Oncol 9, 338–350. [DOI] [PMC free article] [PubMed] [Google Scholar]
Associated Data
This section collects any data citations, data availability statements, or supplementary materials included in this article.