Abstract
Idiopathic REM sleep behavior disorder (iRBD) is now considered a prodromal stage of an α-synucleinopathy-related to neurodegenerative disease such as Parkinson’s diseases. Emerging evidence has shown that posttranslational glycosylation events are implicated in dynamic disease mechanisms and the onset of many pathological conditions. We hypothesized that the characterization of the glycosylation pattern of patients with RDB would be of great value to understand the pathophysiology and underlying mechanisms and represent potentially useful biomarkers for disease-associated molecular changes. To test this hypothesis, we assessed the serum glycome of patients with RBD and compared to that of healthy controls. NanoRPLC-MS was used to generate quantitative N-glycan profiles while high-temperature PGC-LC-MS platform was employed to generate quantitative isomeric N-glycan profiles. By analyzing permethylated glycans derived from human blood sera on C18-LC-MS/MS, we identified 59 N-glycan structures in healthy (control) cohort, 56 N-glycans in RBD cohort. Sixteen N-glycans structures were found to be significantly altered in the RBD cohort (p<0.05). N-glycans with the composition of HexNAc4Hex5Fuc1, HexNAc5Hex5, and HexNAc4Hex5Fuc1NeuAc1 presented the most substantial difference between controls and RBD patients (p <0.01). HexNAc4Hex5Fuc1NeuAc1 showed a relatively high abundance (3.1±0.7% in the control cohort vs. 4±3% in the idiopathic RBD cohort). These N-glycans can be potential diagnostic biomarker candidates and provide a window into underlying neurodegenerative processes in patients with idiopathic RBD. In addition, 7 N-glycan isomers were significantly different between controls and RBD patients (p<0.05). HexNAc4Hex5Fuc1NeuAc1 (4511-2) and HexNAc4Hex5Fuc1 NeuAc2 (4512-2) showed the most substantial difference between the control and idiopathic RBD cohorts (p <0.001). Levels of both these two isomeric structures were higher in the idiopathic RBD cohort. Further larger studies are required to assess the reproducibility of these findings and to elucidate the role played by the changes in glycan structures in the pathogenetic mechanisms of RBD. This information will be instrumental in developing molecular therapeutic targets to promote neuroprotection and prevention of neurodegeneration.
Keywords: Idiopathic RBD, N-glycans, LC-MS/MS
1. Introduction
Rapid eye movement (REM) sleep behavior disorder (RBD) is a parasomnia characterized by patients physically acting out dreams vividly and often with REM-related dream content [1-3]. Idiopathic RBD occurs in the absence of other neurologic syndromes or comorbidities. Recently multiple reports have shown that idiopathic RBD is associated with a high risk of progression into an over α-synucleinopathy-related neurodegenerative disease, including Parkinson’s disease and dementia with Lewy bodies, indicating that it can represent a prodromal phase and a potential early marker of such condition [2, 3]. Thus, the properties of idiopathic RBD provide a unique opportunity to study and understand the pathology of neurodegenerative diseases and for timely initiation of disease-modifying therapies.
Sensitive, objective, noninvasive biomarkers to increase the accuracy of RBD diagnosis, shed light on the pathogenic pathways and mechanisms, and predict progression, would be instrumental in informing clinical management and guiding early targeted therapeutic intervention. Recently, adopting a proteomics-driven discovery analysis combined with network-based approach we have identified novel potential actionable protein biomarkers embedded in RBD pathogenesis and molecular pathways [4], However, there is now substantial evidence that glycosylation, an important post-translational modification, influences the standard stability and functions of many proteins and alter their downstream biological processes. As such, it has also been implicated in dynamic disease mechanisms and the onset of many pathological conditions [5-10], but no data are available for RBD. We hypothesized that the characterization of the glycosylation pattern of patients with RDB would be of great value to understand the pathophysiology and underlying mechanisms and represent potentially useful biomarkers for disease-associated molecular changes.
Mass spectrometry (MS) based quantitative analysis has been recently proved to be a reliable and sensitive tool in for comparative glycomic analyses [11, 12], and is often applied coupled with liquid chromatography (LC) to decrease the chemical noise existed in complex samples and to enhance quantitative sensitivity and reliability [13-16], and with permethylation to prevent the loss of acidic glycans and increase the ionization efficiency of glycans because of the enhanced hydrophobicity of glycan molecules [17-19]. Still, while permethylation provides sensitive quantitative analysis of glycan profile on a reverse phase (RP) LC-MS, its ability to separate isomers is limited.
To address these issues, our group has adopted a sophisticated and advanced approach to optimize isomeric separation by using porous graphitized carbon (PGC) stationary phase under high temperature (75°C) [15, 20, 21], permitting reliable identification and characterization of glycan structures as well as precise and accurate quantitation of isomeric structures [15, 20, 21]. Using this approach, in the present study, we performed comparative glycomic analyses in serum samples from nine patients with a clinical diagnosis of idiopathic RBD and ten healthy controls and obtained an accurate separation, identification, and quantification of isomeric glycans.
2. Material and Methods
2.1. Study Participants.
Human blood sera of patients diagnosed of idiopathic RBD and healthy individuals were provided by the Department of Neurology and Sleep Medicine, Oasi Research Institute (IRCCS), and the Department of Neurology, University of Bologna, Italy. Patients who received the diagnosis of idiopathic RBD met the international diagnostic criteria of the American Academy of Sleep Medicine [22]. Patients were excluded if they were younger than 18 years and they were taking any medications. Healthy adult subjects without any neurological or medical conditions served as controls. All participants provided consent for research, and the study was approved by the local ethics committees.
2.2. Materials and Reagents
PNGase F, G7 buffer (50mM sodium phosphate buffer, pH 7.5) were from New England Biolabs (Ipswich, MA, USA). Ammonium-borane complex, CH3I iodomethane, Dimethyl sulfoxide (DMSO), NaOH beads were purchased from Sigma-Aldrich (St. Louis, MO, USA), ethanol was from PHARMCO-AAPER, HPLC grade methanol, Acetonitrile (ACN), Formic Acid, HPLC water were obtained from Fisher Scientific (Fair Lawn, New Jersey, USA).
2.3. Sample preparation
The digestion and purification of N-glycans followed our previously published protocol [14]. Briefly, 10 μl human blood serum of each patient with idiopathic RBD and the healthy individual was mixed with 10 times diluted sodium phosphate buffer and denatured in a 90°C water bath for 20 min. Next, 1.2 μl PNGase F was added into the mixture and digested overnight in a 37°C water bath. Released N-glycans were than suspended in 90% icy ethanol, and after centrifugation, the supernatant containing N-glycans were collected, dried and reduced with the ammonium-borane complex at 60°C reaction temperature for 1h. Reduced N-glycans were washed with methanol to remove excess reducing reagent.
2.4. Solid-phase permethylation of N-glycans
The purified reduced N-glycans were solid-phase permethylated as previously described [11, 14, 17]. Sodium hydroxide beads were packed in spin columns with DMSO solution and washed with DMSO. The dried N-glycans were resuspended in 30 μl DMSO, 20 μl iodomethane and a trace amount of water (ca. 1.2 μl). The sample solution was then loaded into spin columns and incubated for 25 min at room temperature. Additional 20 μl iodomethane was added into the spin column. After incubation of 15min, spin columns were centrifuged at 1.8krpm. The collected solutions were dried overnight in a vacuum drier.
2.5. LC-MS conditions
All samples of control and idiopathic RBD cohorts were analyzed with both C18 and PGC-LC-MS conditions for glycan profiles and isomeric quantitative analysis.
2.5.1. C18-LC-MS condition
Reduced and permethylated N-glycans extracted from human blood sera were reconstituted in 20% ACN containing 0.1% formic acid and analyzed by 3000 nano-LC systems (Dionex, Sunnyvale, CA, USA) coupled with LTQ Orbitrap Velos (Thermo Scientific, San Jose, CA, USA). Glycan profiles were achieved under 55°C separation with optimized LC conditions [13, 14, 18], on reversed phase Acclaim PepMap capillary column (150 mm× 75μm i.d.) packed with 100 Å C18 bounded phase (Dionex). The mobile phase for separation was composed of 98% HPLC water, 2% ACN, 0.1% formic acid, on the other hand, mobile phase B consisted of 100% ACN and 0.1% formic acid. The flow rate was 0.35 μl/min with a gradient elution of 20% mobile phase B over 10 minutes, then increased to 42% B (10-11min), 42% to 55% B (11-48min), 55% to 90% B (48-49min), 90% B (49-54min), 90% to 20% B (54-55min), 20% B (55-60min). Full MS spectra were obtained in the mass range of 700-2000 m/z using positive ionization mode. The resolution of the instrument was set to 100,000 while mass accuracy was 5 ppm.
2.5.2. PGC-MS/MS condition
Isomeric analysis was conducted with high-temperature PGC separation coupled with MS, as we previously reported [20, 21]. Optimized separation was performed with a HyperCarb PGC column (75 μm × 100 mm, 5 μm particle size; Thermo Scientific, Pittsburgh, PA) using oven temperature at 75°C. The same compositions of mobile phases were employed as in C18 separation. The flow rate was set to 0.75 μl/min. Elution gradient began with 20% of mobile phase B for 10 min, 20% to 60% B (10-30 min), 60% to 95% B (30-40 min), and 95% B was maintained for 20 min. MS settings were the same as mentioned above for C18-LC-MS method.
2.6. Data processing and quantitation by MultiGlycan-ESI Quantification
The raw files obtained on the C18 column were imported into MultiGlycan software [23, 24] for quantitative analysis. Glycan compositions were identified by searching the experimental m/z value of monoisotopic peaks of N-glycan ions against the default database built in the software. Mass accuracy of 5 ppm was employed, isotopic envelope tolerance was set to 6 ppm. All possible charge states and adducts of a glycan composition were considered and added as the output quantitation results. Data acquired on PGC column was identified by searching experimental m/z value against theoretical m/z value in the default database and quantified with Xcalibur by calculating peak area of glycan ions of all charge states and adduct ions.
2.7. Statistical analysis
Student’s t-tests were applied to absolute intensities acquired on C18-LC-MS and PGC-LC-MS to compare glycans and N-glycan isomers between control and idiopathic RBD cohorts. Two-tailed t-tests were performed, similar to what we have used in our previous studies using Markerview™ software (AB Sciex, Framingham, MA) [15, 25, 26].
2.8. Principal component analysis (PCA)
The group properties of nine blood serum samples with idiopathic RBD and ten healthy control samples were subjected to PCA. Unsupervised PCA was performed on absolute intensities acquired on C18-LC-MS and PGC-LC-MS with Markerview™ software. All data points from control and idiopathic RBD cohorts were analyzed without designation, as reported in our previous biomarker study [15].
3. Results and Discussion
3.1. N-glycan profile of control and idiopathic RBD cohorts
The N-glycan profile of all human blood sera from individuals in both control and idiopathic RBD cohorts were acquired on the nanoRPLC-ESI-MS platform, using 55°C for a C18 column, as shown in Figure 1. The peak area of all adducts and charge state ions under the extracted ion chromatogram (EIC) of an N-glycan structure was summed up as total peak area, and which was reported as a relative abundance percentage relative to the total glycan structures identified in one individual. EICs of N-glycans representing the glycan profile derived from human serum samples of one control and one idiopathic RBD patient are shown in Figure 2a and 2b, respectively. Relative abundances of N-glycans in all individuals of the control cohort, the average and standard deviation of the control cohort are listed in Table S1 and S2. We identified 59 N-glycan structures in controls and 56 N-glycan structures in the idiopathic RBD cohort. As shown in Table S1 and S2, the relative abundance of some N-glycan structures in the same cohort varied from subject to subject; however, on average 60% N-glycans are sialylated structures, 20% are fucosylated structures, and 20% are high mannose structures. In the control cohort, the most abundant two N-glycan structures were HexNAc4Hex5NeuAc2 and HexNAc4Hex5NeuAc1, whereas, in the idiopathic RBD cohort, were HexNAc4Hex3Fuc1 and HexNAc4Hex4Fuc1.
Figure 1.
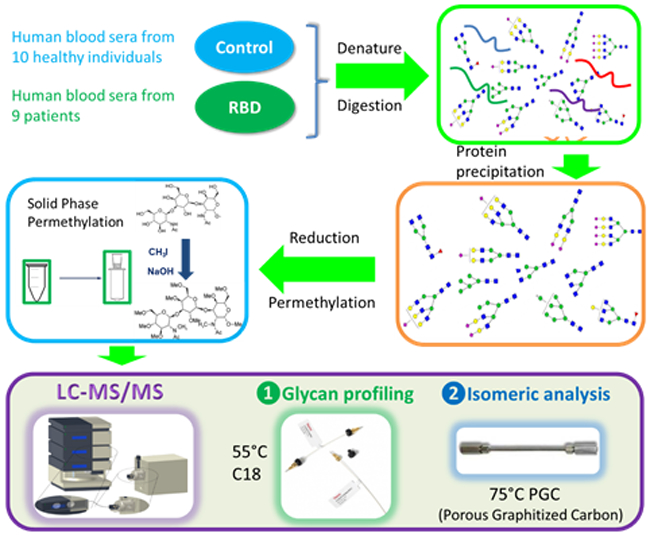
A flowchart summarizing sample preparation and analysis.
Figure 2.
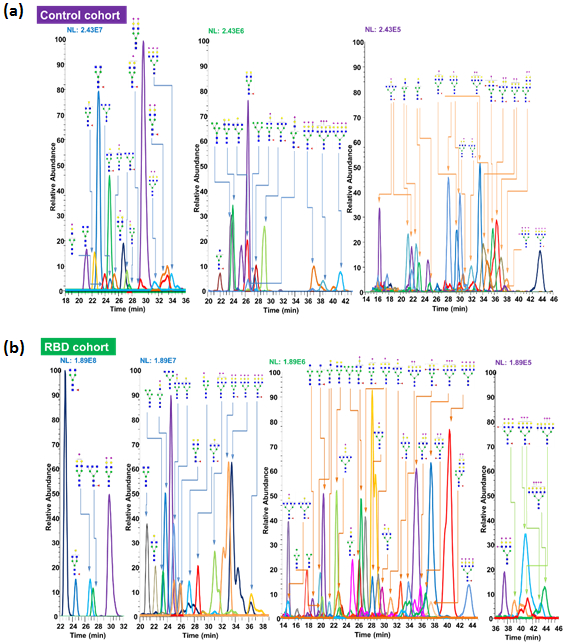
Extracted Ion Chromatogram (EIC) of permethylated glycans derived from bloodsamples of (a) control and (b) patient with idiopathic RBD. Symbols:  , N-acetylglucosamine (GlcNAc);
  , Galactose (Gal);
  , Fucose (Fuc);
  , Mannose (Man);
  , Glucose (Glc);
  , N-acetylneuraminic acid (NeuAc/Sialic Acid);
3.2. Statistical analysis of quantitative results of control and idiopathic RBD cohorts
Sixteen N-glycan structures showed significant differences between controls and the RBD patient group (p<0.05). Quantitative data are shown as bar graphs in Figure 3 and listed in Table S3. Eight of these differently expressed N-glycan structures were sialylated, and nine structures contained fucose moieties. Consistently, our previous study on neurodegenerative diseases showed differences in sialylation and fucosylation between patients and healthy subjects [10]. N-glycans with the composition of HexNAc6Hex6, HexNAc4Hex5Fuc2, and HexNAc7Hex8Fuc1NeuAc2 were only found in the idiopathic RBD cohort, while the hexnac2hex3fuc1 structure was only detectable in the control cohort. Six of the structures with a statistically significant difference were overexpressed in idiopathic RBD patients. N-glycans with the composition of HexNAc4Hex5Fuc1, HexNAc5Hex5, and HexNAc4Hex5Fuc1NeuAc1 showed a substantial difference between controls and RBD patients (p<0.01). Moreover, the monosialylated N-glycan HexNAc4Hex5Fuc1NeuAc1 showed a relatively high abundance (3.1±0.7% in controls vs. 4±3% in idiopathic RBD patients). These N-glycans could represent potential candidate biomarkers of idiopathic RBD.
Figure 3.
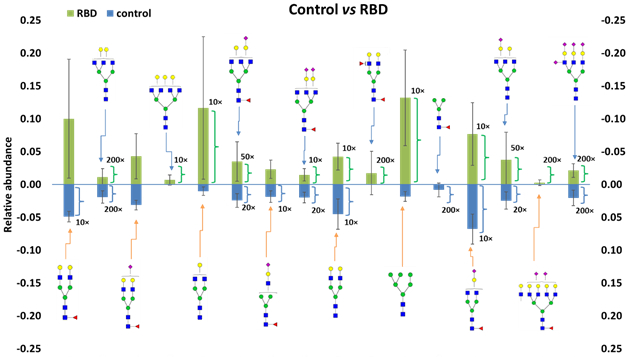
Bar graphs of the LC-MS relative abundances of permethylated N-glycan with significant differences (p<0.05) between control and idiopathic RBD cohorts. Symbols: see Figure 2.
We also conducted PCA to investigate significant differences in the comprehensive glycomic profile between idiopathic RBD patients and controls (Table S1 and S2). The PCA plot for the comprehensive N-glycan profiles derived from serum samples of control individuals and RBD patients is shown in Figure 4a. In the PCA plot, data points of the control cohort displayed similarity and clustered together, data points of idiopathic RBD cohort clustered into two areas in the plot. Five sample individuals were separated from the control cohort; however, the remaining 4 idiopathic RBD individuals overlapped with the control cohort region. This result display that N-glycan profile in human blood serum of idiopathic RBD patients and healthy individuals are similar to some extent. Other factors such as age and gender have been reported to be associated with the onset of idiopathic RBD. It is likely that these or other factors [27, 28] might in part explain the partial overlap and separation observed in the PCA plot. Nonetheless, our limited sample size and distribution of age span precluded further meaningful investigation of the observed data clustering. When N-glycan structures with statistically significant differences (p<0.05) were only employed to acquire PCA score plot, as shown in Figure 4b, the clustering and separation of data points between control and idiopathic RBD cohorts become more obvious.
Figure 4.
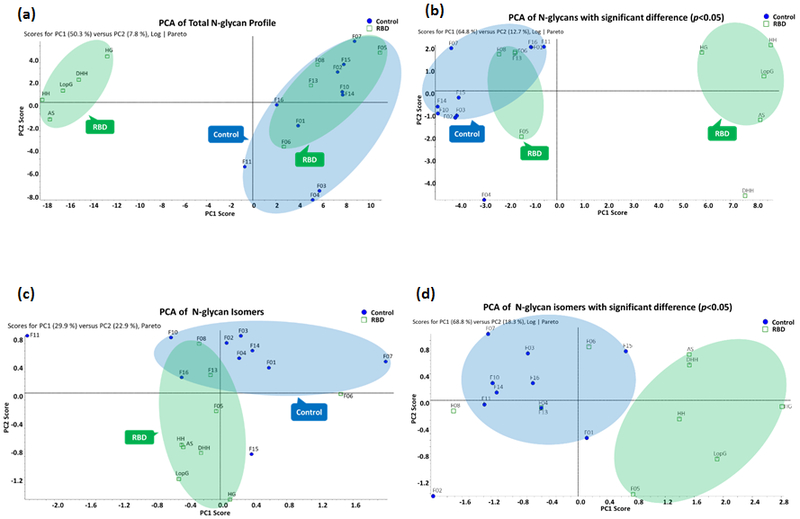
(a) The PCA plot of total N-glycan profile. (b) The PCA plot of N-glycans with significant difference (p<0.05). (c) The PCA plot of N-glycan isomers. (d) The PCA plot of N-glycan isomers with significant difference (p<0.05).
3.3. Isomeric quantitation of control and idiopathic RBD cohorts
Isomeric structures such as α2-3 and α2-6 linked sialic acids are often associated with different biological functions in cells and the human body [8, 15, 20, 21]. Thus, we analyzed the permethylated N-glycans of the control and idiopathic RBD cohorts on PGC-ESI-MS platform under 75°C separation condition to further separate and quantify the isomeric structures in human blood serum [15, 21]. Thirteen N-glycans with isomeric structures were found significantly different between the control and idiopathic RBD cohorts have. Among those, 11 structures contain at least one sialic acid moiety. In addition, 34 N-glycans including isomeric structures were identified. The relative distribution of each isomer that has the same composition was quantitated and listed in Table S4 and Table S5.
3.4. Statistical analysis of isomeric quantitative results of the control and idiopathic RBD cohorts
All quantitative data points of the isomeric structures (Table S4 and Table S5) were used to generate a PCA plot to visualize the distribution tendency of the comprehensive N-glycan isomeric profile in the control and idiopathic RBD cohorts (Figure 4c). The majority of the data points in the control cohort clustered at the top area in the plot with the exceptions of data points F11 and F15 which deviated from the major data points. On the other hand, all data points in the idiopathic RBD cohort were located on the bottom part of the plot, with the exception of point F06 that was far away from the other clustered data points, and F08 and F13 which overlapped the control cohort points. This result matched those observed in the PCA of the total N-glycan profile (Figure 4a). As discussed previously, this partial overlap of idiopathic RBD and control cohorts in PCA might be explained by other factors that require further investigation. If isomeric structures that only show statistically significant differences (p<0.05) were only utilized for PCA, better clustering of data points in control and idiopathic RBD cohorts were achieved (Figure 4d).
Bar graph displaying isomeric structures with a significant difference between the control and idiopathic RBD cohorts is shown in Figure 5. Three isomeric structures with composition HexNAc4Hex5Fuc1NeuAc1, two isomeric structures with composition HexNAc4Hex5Fuc1NeuAc2, and two isomeric structures with composition HexNAc6Hex7NeuAc3 showed a significant difference (p<0.05). The second eluted isomer of HexNAc4Hex5Fuc1NeuAc1 (4511-2) and the second eluted isomer of HexNAc4Hex5Fuc1 NeuAc2 (4512-2) showed the most substantial difference between control and idiopathic RBD cohorts (p<0.001). Levels of both these isomeric structures were higher in idiopathic RBD patients than in the controls.
Figure 5.
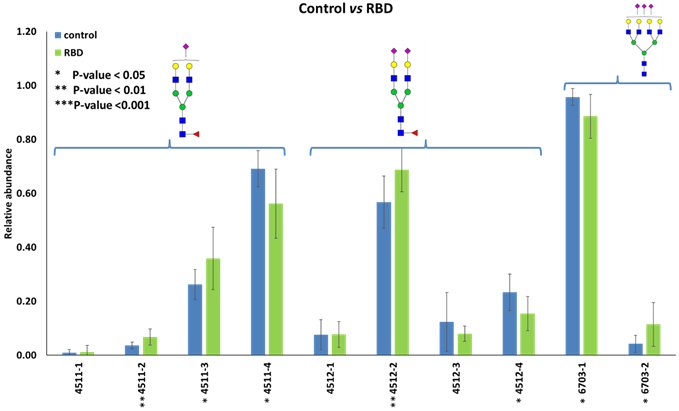
Bar graphs of the LC-MS relative abundances of permethylated N-glycan isomers with significant differences (p<0.05) between control and idiopathic RBD cohorts. Symbols: see Figure 2.
4. Concluding remarks
In the present study, by analyzing permethylated glycans derived from human blood sera on C18-LC-MS/MS, we identified 59 N-glycan structures in healthy controls and 56 N-glycans in RBD cohort. Sixteen N-glycans structures were found significantly different between controls and RBD patients (p<0.05). N-glycans with the composition of HexNAc4Hex5Fuc1, HexNAc5Hex5, and HexNAc4Hex5Fuc1NeuAc1 showed the most substantial difference between controls and RBD patients (p<0.01). HexNAc4Hex5Fuc1NeuAc1 showed a relatively high abundance (3.1±0.7% vs. the control cohort vs. 4±3% in the idiopathic RBD cohort). These N-glycans could be potential diagnostic biomarkers for idiopathic RBD be used to provide information about the underlying pathophysiological processes associated with this condition.
In addition, 7 N-glycan isomers were found significantly different between the control and RBD cohorts (p<0.05). HexNAc4Hex5Fuc1NeuAc1 (4511-2) and HexNAc4Hex5Fuc1NeuAc2 (4512-2), in particular, showed the most substantial difference between the control and idiopathic RBD cohorts (p<0.001). Levels of both these two isomeric structures were higher in the idiopathic RBD cohort. Further studies with more significant numbers of patients are needed to assess the reproducibility of these findings and to elucidate the role played by the changes in glycan structures in the pathogenetic mechanisms. This information will be instrumental in developing molecular therapeutic targets to promote neuroprotection and prevention of neurodegeneration.
Supplementary Material
Acknowledgment
This work was supported by NIH grant (1R01GM112490-04).
Footnotes
Supporting Information: Additional supporting information may be found in the online version of this article at the publisher’s web-site
The authors have declared no conflict of interest.
5 References
- [1].Boeve BF, Ann. N. Y. Acad. Sci. 2010, 1184, 15–54. [DOI] [PMC free article] [PubMed] [Google Scholar]
- [2].Iranzo A, Tolosa E, Gelpi E, Molinuevo JL, Valldeoriola F, Serradell M, Sanchez-Valle R, Vilaseca I, Lomeña F, Vilas D, Lladó A, Gaig C, Santamaria J, Lancet Neurol. 2013, 12, 443–453. [DOI] [PubMed] [Google Scholar]
- [3].Kim S, Park JM, Moon J, Choi HJ, Exp. Neurol. 2014, 252, 63–74. [DOI] [PubMed] [Google Scholar]
- [4].Mondello S, Kobeissy F, Mechref Y, Zhao J, Talih F, R., , Cosentino F, Antelmi E, Moresco M, Plazzi G, Ferri R, Neurology 2018, In press. [DOI] [PubMed] [Google Scholar]
- [5].Abd Hamid UM, Royle L, Saldova R, Radcliffe CM, Harvey DJ, Storr SJ, Pardo M, Antrobus R, Chapman CJ, Zitzmann N, Robertson JF, Dwek RA, Rudd PM, Glycobiology 2008, 18, 1105–1118. [DOI] [PubMed] [Google Scholar]
- [6].Meany DL, Chan DW, Clin. Proteomics 2011, 8, 7. [DOI] [PMC free article] [PubMed] [Google Scholar]
- [7].Wooding KM, Peng W, Mechref Y, Curr. Pharm. Biotechnol. 2016, 17, 788–801. [DOI] [PMC free article] [PubMed] [Google Scholar]
- [8].Veillon L, Huang Y, Peng W, Dong X, Cho BG, Mechref Y, Electrophoresis 2017, 38, 2100–2114. [DOI] [PMC free article] [PubMed] [Google Scholar]
- [9].Goulabchand R, Vincent T, Batteux F, Eliaou JF, Guilpain P, Autoimmun. Rev. 2014, 13, 742–750. [DOI] [PubMed] [Google Scholar]
- [10].Abou-Abbass H, Abou-El-Hassan H, Bahmad H, Zibara K, Zebian A, Youssef R, Ismail J, Zhu R, Zhou S, Dong X, Nasser M, Bahmad M, Darwish H, Mechref Y, Kobeissy F, Electrophoresis 2016, 37, 1549–1561. [DOI] [PMC free article] [PubMed] [Google Scholar]
- [11].Dong X, Zhou S, Mechref Y, Electrophoresis 2016, 37, 1532–1548. [DOI] [PMC free article] [PubMed] [Google Scholar]
- [12].Kailemia MJ, Ruhaak LR, Lebrilla CB, Amster IJ, Anal. Chem. 2013, 86, 196–212. [DOI] [PMC free article] [PubMed] [Google Scholar]
- [13].Hu Y, Desantos-Garcia JL, Mechref Y, Rapid Commun. Mass Spectrom. 2013, 27, 865–877. [DOI] [PMC free article] [PubMed] [Google Scholar]
- [14].Hu Y, Mechref Y, Electrophoresis 2012, 33, 1768–1777. [DOI] [PMC free article] [PubMed] [Google Scholar]
- [15].Huang Y, Zhou S, Zhu J, Lubman DM, Mechref Y, Electrophoresis 2017, 38, 2160–2167. [DOI] [PMC free article] [PubMed] [Google Scholar]
- [16].Mechref Y, Zhou S, Hu Y, Hussein A, Tang H, Encycl. Anal. Chem. 2014, 10.1002/9780470027318.a9780470029400 [DOI] [Google Scholar]
- [17].Mechref Y, Kang P, Novotny MV, Methods Mol. Biol. 2009, 534, 53–64. [DOI] [PubMed] [Google Scholar]
- [18].Zhou S, Hu Y, Mechref Y, Electrophoresis 2016, 37, 1506–1513. [DOI] [PMC free article] [PubMed] [Google Scholar]
- [19].Zhou S, Veillon L, Dong X, Huang Y, Mechref Y, Analyst 2017, 142, 4446–4455. [DOI] [PMC free article] [PubMed] [Google Scholar]
- [20].Zhou S, Huang Y, Dong X, Peng W, Veillon L, Kitagawa DAS, Aquino AJA, Mechref Y, Anal. Chem. 2017, 89, 6590–6597. [DOI] [PMC free article] [PubMed] [Google Scholar]
- [21].Zhou S, Dong X, Veillon L, Huang Y, Mechref Y, Anal. Bioanal. Chem. 2017, 409, 453–466. [DOI] [PMC free article] [PubMed] [Google Scholar]
- [22].Sateia MJ, Chest 2014, 146, 1387–1394. [DOI] [PubMed] [Google Scholar]
- [23].Hu Y, Zhou S, Yu CY, Tang H, Mechref Y, Rapid Commun. Mass Spectrom. 2015, 29, 135–142. [DOI] [PMC free article] [PubMed] [Google Scholar]
- [24].Yu CY, Mayampurath A, Hu Y, Zhou S, Mechref Y, Tang H, Bioinformatics 2013, 29, 1706–1707. [DOI] [PMC free article] [PubMed] [Google Scholar]
- [25].Abou-Abbass H, Bahmad H, Abou-El-Hassan H, Zhu R, Zhou S, Dong X, Hamade E, Mallah K, Zebian A, Ramadan N, Mondello S, Fares J, Comair Y, Atweh S, Darwish H, Zibara K, Mechref Y, Kobeissy F, Electrophoresis 2016, 37, 1562–1576. [DOI] [PMC free article] [PubMed] [Google Scholar]
- [26].Wildburger NC, Zhou S, Zacharias LG, Kroes RA, Moskal JR, Schmidt M, Mirzaei P, Gumin J, Lang FF, Mechref Y, Nilsson CL, J. Proteome Res. 2015, 14, 3932–3939. [DOI] [PMC free article] [PubMed] [Google Scholar]
- [27].Barber TR, Lawton M, Rolinski M, Evetts S, Baig F, Ruffmann C, Gornall A, Klein JC, Lo C, Dennis G, Bandmann O, Quinnell T, Zaiwalla Z, Ben-Shlomo Y, Hu MTM, Sleep 2017, 40. [DOI] [PMC free article] [PubMed] [Google Scholar]
- [28].Zhou J, Zhang J, Li Y, Du L, Li Z, Lei F, Wing YK, Kushida CA, Zhou D, Tang X, Sleep Med. 2015, 16, 414–418. [DOI] [PubMed] [Google Scholar]
Associated Data
This section collects any data citations, data availability statements, or supplementary materials included in this article.


