Abstract
Sulfane sulfur species are newly recognized signaling molecules that play physiological roles in many biological events. The development of new technologies for the detection of sulfane sulfurs is important. Point-of-care (POC) devices are in-field rapid and low-cost detectors that are more convenient to use than bulky and expensive standard instruments. In this report, a new fluorescent probe (SSP5) was designed to detect sulfane sulfurs using a POC sulfane sulfur smartphone spectrum apparatus (S4A). This probe proved to be sensitive and selective for sulfane sulfur species over other biologically relevant sulfur species such as cysteine and H2S. The low-cost and compact S4A has achieved comparable performance to standard laboratory equipment in both a standard buffer system and a synthetic urine system. The proposed system (SSP5 + S4A) has the potential for high accuracy and rapid detection of sulfane sulfur species in remote and low resource settings.
Keywords: Fluorescence, Point-of-care device, Sulfane sulfur species
1. Introduction
Reactive sulfur species (RSS) are a family of sulfur-containing molecules that play regulatory roles in biological systems. RSS include thiols (RSH), hydrogen sulfide (H2S), polysulfides, as well as S-modified cysteine derivatives (such as S-nitrosothiols and S-sulfenic acids). Recently, the studies of H2S in the RSS family have attracted much attention because H2S has been recognized as an NO-like signaling molecule [1,2]. It has been shown to play important roles in cardiovascular, neuronal, immune, renal, respiratory, gastrointestinal, reproductive, liver, and endocrine systems. As an example of its importance, low levels of H2S have been associated with neurodegenerative diseases like Alzheimer’s, and Parkinson’s [3,4]. H2S has also shown cardioprotective, anti-inflammatory, and vasorelaxation properties [5]. It is likely that many more important functions of H2S are still to be discovered. Nevertheless, the production of endogenous H2S and the exogenous administration of H2S have been demonstrated to exert protective effects in many pathologies [6–9].
While research on H2S is still actively ongoing, a hot new topic in this field has recently emerged focusing on a series of H2S -related reactive sulfane sulfur species. Sulfane sulfur refers to a sulfur atom with six valence electrons but no charge (represented as S0). Persulfides (R-S-SH), polysulfides (R-S-Sn-S-R), hydrogen polysulfides (H2Sn), and protein-bound elemental sulfur (S8) are representative H2S-related sulfane sulfur compounds. These molecules have a unique reactivity to attach reversibly to other sulfur atoms and exhibit regulatory effects in diverse biological systems. Some studies even suggest that sulfane sulfurs derived from H2S may be the actual signaling molecules [10–13].
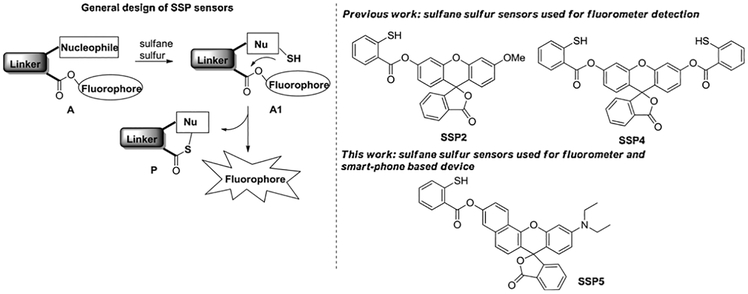
Because of the importance of H2S and related sulfane sulfurs, the development of new technologies to better identify and study these species in live cells, tissues, and whole animals is critical to gaining a more holistic understanding of how these molecules contribute to physiology and pathology. In this regard, fluorescence-based assays can be very useful due to their high sensitivity and convenience. Fluorescent methods are suitable for noninvasive detection of bio-targets in live cells or tissues with readily available instruments. In the past several years, our lab and several others have been exploring the fundamental reactivity of sulfane sulfurs and developing novel fluorescent sensors for sulfane sulfurs [14–25]. A common characteristic of sulfane sulfurs is that these molecules can act as electrophiles and be attacked by certain nucleophiles. Based on this property, we first developed several fluorescence ‘turn-on’ sensors [14]. As shown in Scheme 1, sulfane sulfurs can react with the nucleophilic component of the sensor A to form an SH containing intermediate A1. If a pseudo-fluorescent group (like the ester shown in A1) is present at a suitable position, the SH undergoes a spontaneous and fast cyclization to release the fluorophore. As such the non-fluorescent sensor will be ‘turned-on’ by sulfane sulfurs. The sensors based on this strategy, e.g. SSP2 and SSP4, have shown high sensitivity and specificity for sulfane sulfurs and have been used by many researchers [26–31].
Scheme 1.
The design of SSP sensors.
While our sensors like SSP2/SSP4 have found nice applications in the detection of sulfane sulfurs in biological samples, the need for a standard fluorimeter or fluorescence microscope in a laboratory setting could limit their applications. Point-of-care (POC) sensing devices integrated with mobile devices, such as smartphones or tablets, for in-field rapid and low-cost detection represents a trend in recent years and in the future. Traditional laboratory equipment (e.g. fluorimeters and fluorescence microscopes) are highly sensitive but at the same time are expensive, bulky, and require well-trained professionals to operate. A rapid and low-cost detection of RSS at the patient side could greatly increase healthcare quality and even save lives. In recent years, numerous smartphone based POC devices have been developed and validated for various applications such as medical, chemical, biological, environmental, food safety, etc. [32–36].
In this work, a compact, filter-less, and low-cost sulfane sulfur smartphone spectrum apparatus (S4A), and a new fluorescent sensor (SSP5, shown in Scheme 1) were designed for the proposed POC device. The desired excitation wavelength for S4A was in the purple and violet region (~500–580 nm), so SSP5 was designed for the portable device. The fluorophore rhodol was chosen for this sensor because of its purple color and the main SSP template was maintained because of its proven efficiency. Herein we report the design, preparation, and evaluation of SSP5. In conjunction with the smartphone-based spectrum apparatus, the sensor showed satisfactory sensitivity and specificity for sulfane sulfurs in both buffers and urine systems.
2. Materials and methods
2.1. Reagents and apparatus
For the synthesis of SSP5, all solvents were reagent grade. Reactions were magnetically stirred and monitored by thin layer chromatography (TLC) with 0.25 mm pre-coated silica gel plates. Flash chromatography was performed with silica gel 60 (particle size 0.040–0.062 mm). Proton NMR spectra was recorded on a 400 MHz spectrometer and carbon-13 NMR spectra was recorded on a 600 MHz spectrometer. Chemical shifts are reported relative to chloroform (δ 7.26) for 1H NMR and chloroform (δ 77.0) for 13C NMR. Fluorescence excitation and emission spectra were measured on a Cary Eclipse fluorescence spectrophotometer. The synthetic route of SSP5 is shown in Scheme 2.
Scheme 2.
Synthesis of SSP5.
Compound 3: to a solution of 2-(pyridin-2-yldisulfaneyl)benzoic acid 2 (394.9 mg, 1.5 mmol) [37], EDC (287.5 mg, 1.5 mmol), and DMAP (45.8 mg, 0.375 mmol) in 38 mL of CH2Cl2, a rhodol derivative 1 (328.1 mg, 0.75 mmol) [38] was added. The reaction was stirred at room temperature overnight. The reaction solution was then concentrated. The crude material was purified by flash column chromatography (25% ethyl acetate/hexanes) to afford compound 3 as a pink solid (375.6 mg, 73%).
2.1.1. SSP5
A solution of compound 3 (300 mg, 0.44 mmol) in 7.3 mL of water nd 14.7 mL of THF was stirred at room temperature. To this mixture, 0.1 mL of HCl (1.0 M) was added followed by triphenyl phosphine (346.2 mg, 1.32 mmol). The reaction was stirred for two hours and then diluted with CH2Cl2. The organic layer was separated, dried over magnesium sulfate, and concentrated via rotary evaporator. The crude material was purified by flash column chromatography (25% ethyl acetate in hexanes) to give the product as a red solid (154.1 mg, 61%). mp ~190°C (decomp), 1H NMR (400 MHz, CDCl3) δ 8.68 (d, J = 9.1 Hz, 1 H), 8.33 (d, J = 7.5 Hz, 1 H), 8.06 (d, J = 8.0 Hz, 1 H), 7.68 − 7.59 (m, 3 H), 7.51 (dd, J = 11.4 Hz, 1 H), 7.44 − 7.38 (m, 3 H), 7.31 − 7.22 (m, 1 H), 7.17 (d, J = 7.1 Hz, 1 H), 6.81 (s, 1 H), 6.67 (d, J = 8.8 Hz, 2 H), 6.44 (d, J = 7.5 Hz, 1 H), 4.72 (s, 1 H), 3.41 (q, J = 7.1 Hz, 4 H),1.21 (t, J = 7.1 Hz, 6 H). 13C NMR (151 MHz, CDCl3) δ 169.72, 165.15, 153.66, 152.41, 149.88, 149.60, 147.49, 139.65, 135.01, 134.90, 133.23, 132.31, 131.16, 129.53, 128.93, 126.99, 125.19, 124.89, 124.24, 124.07, 122.62, 122.09, 121.47, 118.79, 112.86, 108.95, 105.01, 97.70, 84.28, 44.49, 12.54. MS (ESI) m/z 574.0 (M+H+).
2.1.2. Persulfide donor
(PSD shown in Scheme 3). Prepared following the previous report [39]. In aqueous buffers, PSD undergoes an acyl transfer reaction to spontaneously produce persulfide (Scheme 3). PSD was used as a sulfane sulfur model compound in our studies.
Scheme 3.
Persulfide donor PSD.
2.1.3. Artificial urine
The artificial urine was prepared using a reported procedure [40]. The solution contains 1.1 mM lactic acid, 2.0 mM citric acid, 25 mM sodium bicarbonate, 170 mM urea, 2.5 mM calcium chloride, 90 mM sodium chloride, 2.0 mM magnesium sulfate, 7.0 mM potassium dihydrogen phosphate, 7.0 mM dipotassium hydrogen phosphate, 10 mM sodium sulfate, and 25 mM ammonium chloride in deionized water. Following preparation, the pH was adjusted to 6.0 using 1.0 M hydrochloric acid.
2.2. Preparation of the solutions and fluorescence spectrophotometer measurements in PBS
The stock solution of SSP5 (1 mM) was prepared in DMSO. The stock solutions of various testing species were prepared from cysteine (Cys, 50 mM), glutathione (GSH, 5 mM), homocysteine (Hcy, 10 mM), Na2S·9H2O (10 mM), Na2SO3 (10 mM), Na2S2 (10 mM), Na2S3 (10 mM), and PSD (10 mM) in DI water. The stock solution of cetrimonium bromide (CTAB, 5 mM) and S8 (10 mM) were prepared in EtOH. All the test solutions needed to be freshly prepared.
All the measurements were carried out for 10 min at room temperature in 50 mM PBS buffer (pH 7.4) according to the following procedure: in a test tube, 3.5 mL of 50 mM PBS buffer (pH 7.4) and 80 μL of the stock solution of CTAB were mixed. This was followed by the addition of a requisite volume of testing species sample solution. To this, 40 μL of SSP5 was added. The final volume of the reaction solution was adjusted to 4 mL with 50 mM PBS buffer (pH 7.4). After mixing and then standing for 10 min at room temperature, a 4-mL portion of the reaction solution was transferred into a 1-cm quartz cell to measure fluorescence with λex = 582 nm. PMT detector voltage = 500 V. In the meantime, a blank solution containing no testing species sample was prepared and measured under the same conditions for comparison. All the measurements were repeated three times and data reported were normalized averages.
2.3. Preparation of the solutions and fluorescence spectrophotometer measurements in urine
The stock solution of SSP5 (1 mM) was prepared in DMSO. The solution of PSD was prepared in DI water. The stock solution of cetrimonium bromide (CTAB, 5 mM) was prepared in EtOH. All the test solutions needed to be freshly prepared. All the measurements were carried out for 10 min at room temperature in 50 mM PBS buffer (pH7.4) according to the following procedure: In a test tube, 2.5 mL of 50 mM PBS buffer (pH 7.4), 1 mL of the urine stock solution and 80 μL of the stock solution of CTAB were mixed. This was followed by the addition of a requisite volume of PSD. To this, 40 μL of SSP5 was added. The final volume of the reaction solution was then adjusted to 4 mL with 50 mM PBS buffer (pH 7.4). The same testing conditions as the buffered samples were then applied for the standard fluorimeter and smartphone-based device tests.
2.4. Smartphone device preparation
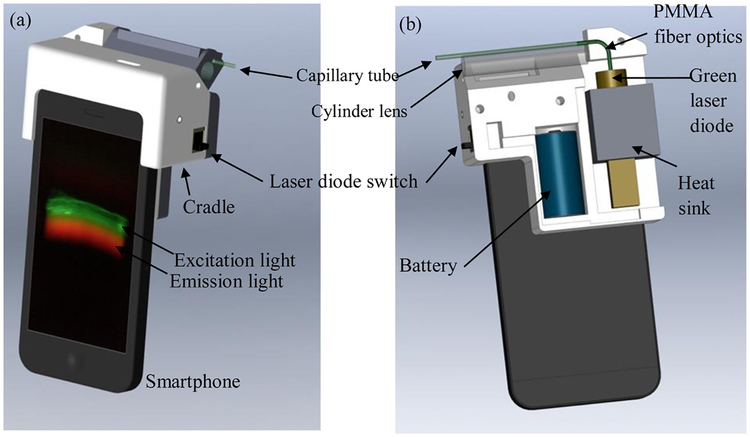
The sulfane sulfur smartphone spectrum apparatus (S4A) was developed as shown in Fig. 1. A low-cost diffraction grating from a digital versatile disc (DVD) was used to separate the incoming light and to generate the optical spectrum. The details of the fabrication of the low-cost grating can be found in the paper by Wang et al [41]. A disposable capillary glass tube (75 mm by 1.1 mm, 41A2502, Kimble Chase) was used as the sample solution container. A green laser diode (532 nm, 10 mW) was used as the excitation light source. As shown in Fig. 1-b, which is the back side of S4A, the excitation light was guided into the capillary glass tube through a Poly(methyl methacrylate) (PMMA) fiber optic (0.75 mm diameter). One end of the optical fiber was glued to the exit window of the laser diode by using an optical adhesive (NOA72, Norland Products, USA) to collect the maximum amount of excitation light. The other end of the optical fiber fits into the capillary glass tube. When the green laser light goes through the capillary tube, fluorescent molecules in the tube will be excited. An 8.5 mm diameter glass rod was used as a low-cost cylinder lens to collect emission light from the sample in the vertical direction of the excitation light. A half-cylinder mirror (not shown in Fig. 1-b) was used on the top of the capillary tube to reflect the upward emission light back to the smartphone camera and at the same time to block the ambient light. The diffraction grating was placed behind the smartphone camera and below the cylinder lens. The normal direction of the diffraction grating is aligned with the smart-phone camera and has a 45° angle with the incoming emission light. This low-cost, compact, and simple optical design allows us to collect as much emission light as possible and avoids using expensive beam expansion optics, filters, and lenses.
Fig. 1.
(a) Front view of S4A, (b) back view of S4A (the back cover, capillary tube holder, and half-cylinder mirror are removed for a clear view).
The laser diode was installed in an aluminum heat sink to prevent overheating. A 3.7 V rechargeable battery (16340) was used as the power supply for the laser diode. All the components were fit into a 3D printed cradle (70 mm by 70 mm by 33 mm) by using polylactide (PLA). The total weight of the device is 137 g (not including the smart phone) and the total cost is about $30 (not including the smartphone).
2.5. Smartphone based fluorescence measurements
For fluorescence measurement, an Apple Iphone 5S smartphone was inserted into the device as shown in Fig. 1a. The rear-facing camera of the smartphone was designed to be aligned with the diffraction grating. A capillary tube with the sample solution was then inserted into the cradle through the opening on top of the device (Fig. 1a). The sample volume in the capillary tube is about 20 microtiters, which provides a fluorescent zone of 20 mm to cover the aperture of S4A. The other end of the capillary tube was directly coupled with the PMMA fiber optics (Fig. 1b) to bring in the excitation light in the horizontal direction. After turning on the laser diode, both the excitation and emission light can be seen through the smartphone camera (Fig. 1a). A free Application (Yamera, AppMadang) was used to control the image acquisition conditions. The conditions that were consistently used through all tests are listed in Table 1. For each sample, five pictures were taken and the average of the five pictures was used as the result of that sample.
Table 1.
Parameters used in the Yamera App for image acquisition.
| Focus | Shutter (second) | ISO | Tint | Temp |
|---|---|---|---|---|
| 0.5 | 1/15 | 2176 | 11 | 3283 |
To determine the fluorescence signals, all pictures were transferred to a desktop computer and analyzed using Matlab. In the homebuilt Matlab script, two regions-of-interest (ROI) were selected. One ROI (gROI) is for the green excitation light measurement and the other ROI (rROI) is for the red emission light measurement. The average green light intensity of the gROI and the average red-light intensity of the rROI were calculated for each sample. The green light intensity is used for correcting the variation of the excitation light. The cross-section view of the optical system was shown in Fig. S1.
2.6. Determination of the Limit of Detection (LOD) and the Limit of Quantification (LOQ)
Because SSP-5 is a new probe, the LOD and LOQ were determined with respect to PSD for both the standard fluorimeter and S4A. The equation utilized in order to determine the LOD and LOQ is as follows: and
SD refers to the standard deviation of ten blank samples. K refers to the slope of the line as the concentration of PSD was increased (1 μM ~ 40 μM).
3. Results and discussion
Our previous SSP sensors (SSP2 and SSP4) were designed using fluorescein as the fluorophore, which has λex ≈ 490 nm and λem = 515 nm. It should be noted that the ideal excitation wavelengths for the cellphone based optical devices in this experiment are in the region of 500–580 nm because of the green laser used in the device. As such, a new sensor with an appropriate fluorophore that specifically fits this smart-phone based device was needed. With these considerations, a rhodol based fluorophore (1, Scheme 2) was selected to build the new sensor. This fluorophore has excellent optical properties, such as excellent photostability and fluorescence quantum yield. Its maxima excitation wavelength is at 582 nm. Its far-red emission (> 600 nm) is suitable for fluorescence imaging because of the merit of decreasing auto-fluorescence. Additionally, the spirolactone ring structure changes of this fluorophore can trigger obvious color change, which is easily observed by the naked-eye and used for visual detection. The new sensor SSP5 was prepared in two steps from compound 1 (shown in Scheme 2). Its structure was fully characterized by NMR and MS.
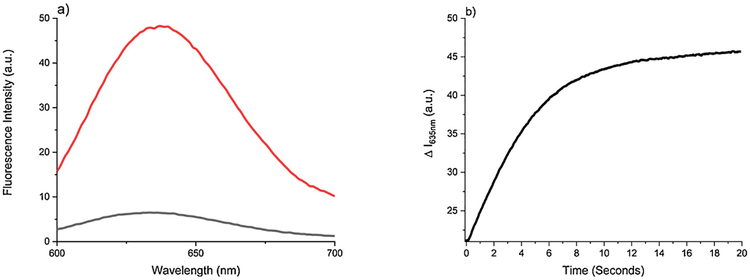
With SSP5 in hand, we first tested its fluorescence property. As shown in Fig. 2-a, the sensor itself showed very low fluorescence in physiological condition. However, in the presence of sulfane sulfurs (using PSD as the donor), very strong fluorescence was observed. We also found that the fluorescence ‘turn-on’ by PSD was a fast process. The maximum intensity was reached in about 10 min (Fig. 2-b). We also studied the effects of different pH for the fluorescence response of SSP5 with PSD. It worked effectively under the range of pH 7–11 (Fig. S2).
Fig. 2.
a) Fluorescent emission spectra of SSP5 (10 μM) by itself (black) and with 50 μM PSD (red). b) The time-dependent fluorescence responses of SSP5 (10 μM) to PSD (50 μM). Data was acquired at 635 nm and excited at 582 nm. (For interpretation of the references to colour in this figure legend, the reader is referred to the web version of this article).
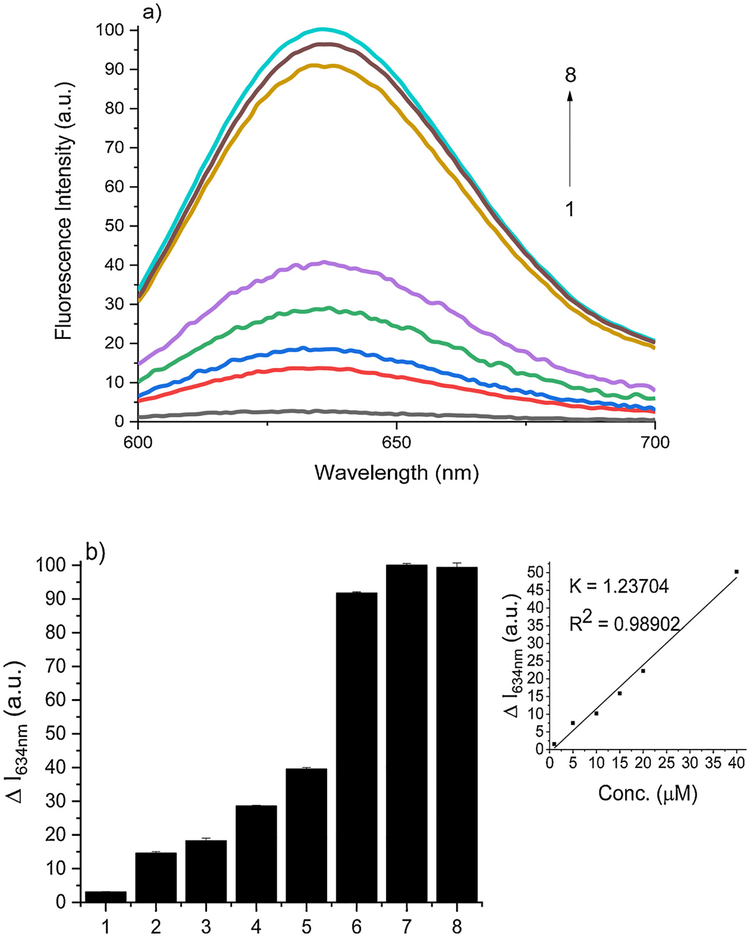
To demonstrate the efficiency of SSP5 in determining sulfane sulfur concentration, varying concentrations of PSD (0–100 μM) were tested using SSP5 (10 μM). For the purpose of reproducibility, a reaction time of 10 min was employed in these experiments. The fluorescence intensity increased linearly as the concentration of PSD was changed up to 80 μM, and, thereafter, reached a steady state (Fig. 3-a). Fig. 3-b, depicting the intensity of the probe at its max intensity (Em = 634 nm), was also provided for later comparison to the cell-phone based device. This depiction will be continued throughout the paper. Additionally, the detection limit was found to be 0.73 μM and the quantification limit was found to be 2.45 μM. This suggests that SSP5 was very sensitive and should be suitable for detecting sulfane sulfurs in biological systems.
Fig. 3.
(a) Fluorescence emission spectra of SSP5 (10 μM) with varied concentrations of PSD (1, 5, 10, 15, 20, 40, 80, 100 μM) for curves 1–8, respectively (b) The fluorescence intensity changes (ΔI) of SSP5 at 634 nm with the same respective PSD concentrations.
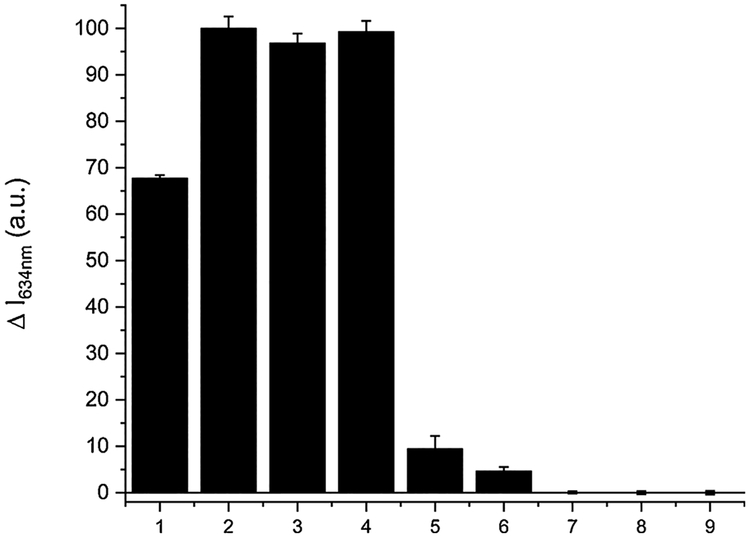
We next examined the selectivity of SSP5 for sulfane sulfurs over other reactive sulfur species. Four representative sulfane sulfur compounds, i.e. H2S2, H2S3, PSD, and elemental sulfur (S8) were first tested (Fig. 4). All these sulfane sulfurs (at 50 μM) showed significant fluorescence responses towards the sensor. In contrast, other biologically relevant sulfur species including cysteine (Cys), glutathione (GSH), homocysteine (Hcy), H2S (using Na2S as the equivalent), and sulfite did not show significant fluorescence enhancement even under much higher concentrations (up to 5 mM). In addition, SSP5 did not produce significant fluorescence responses toward metal ions (Fig. S3). These results demonstrated good selectivity of SSP5 toward sulfane sulfurs.
Fig. 4.
The fluorescence intensity changes (ΔI) of SSP5 (10 μM) in the presence of various RSS. (1) 50 μM S8; (2) 50 μM H2S2; (3) 50 μM H2S3; (4) 50 μM PSD; (5) 100 μM H2S; (6) 100 μM Na2SO3; (7) 100 μM HCys; (8) 1 mM Cys; (9) 5 mM GSH.
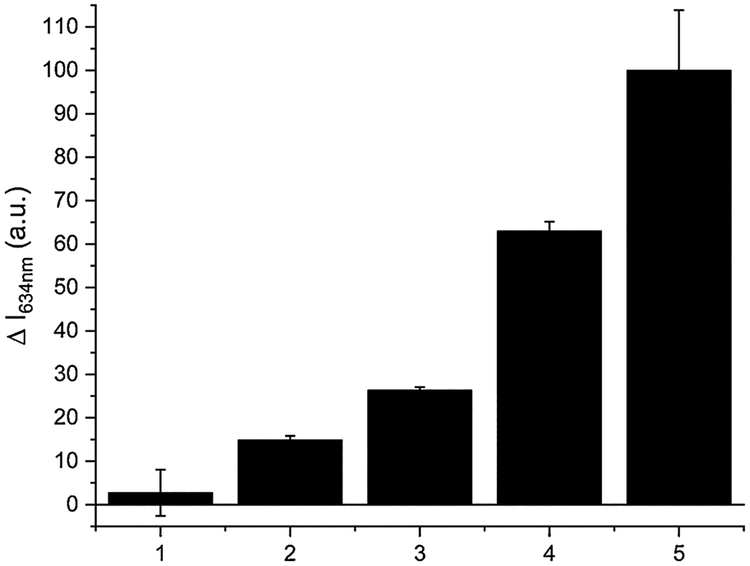
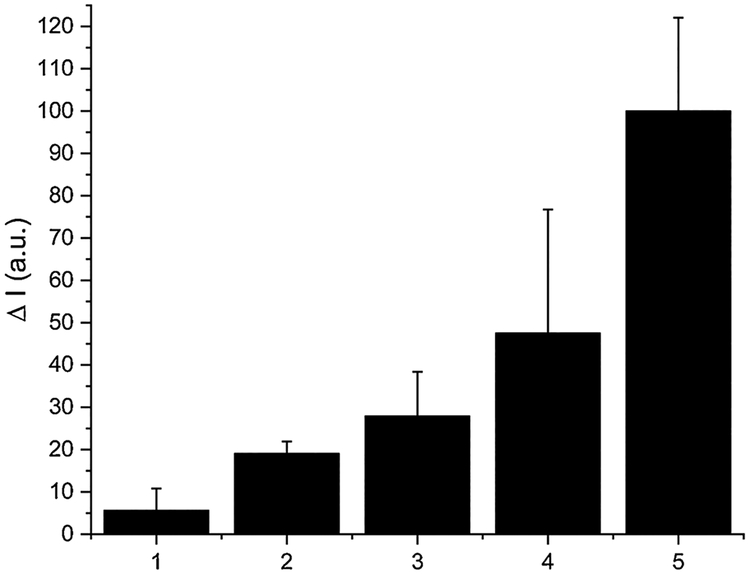
Finally, SSP5 was used to detect sulfane sulfurs in a buffered synthetic urine system. It has been shown that sulfane sulfur species like dimethyl trisulfide (DMT) could be detected in urine [42]. The detection of DMT is important because lower levels of the molecule in urine have been correlated with breast cancer [43]. To demonstrate the efficiency of SSP5 in determining sulfane sulfur concentrations in a buffered urine system, varying concentrations of PSD (0–40 μM) were tested using SSP5 (10 μM). Maintaining consistency with previous tests, a reaction time of 10 min was employed in these experiments. Again, we observed that the fluorescence intensity increased linearly as the concentration of PSD was changed (Fig. 5). The detection limit and the quantification limit were also determined to be 0.27 μM and 0.91 μM respectively.
Fig. 5.
The fluorescence intensity changes (ΔI) of SSP5 (10 μM) in a buffered urine system. PSD concentrations were: (1) 1 μM; (2) 5 μM; (3) 10 μM; (4) 20 μM; (5) 40 μM.
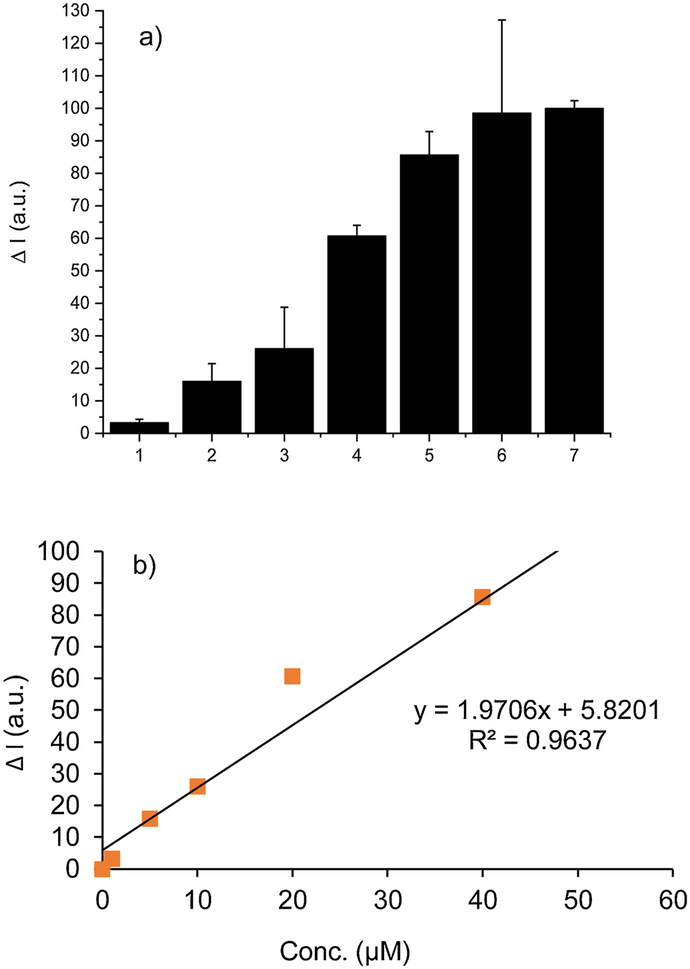
After testing SSP5 using a fluorescence spectrophotometer, the same tests were performed on the smartphone-based device. After obtaining all pictures of all samples using S4A, the corrected red-light intensity of all samples was calculated. The normalized intensities were then obtained by using the intensity of the blank sample as 0 and by using the intensity of 80 μM PSD as 100. The results of the concentration tests in buffer, using S4A, are shown in Fig. 6-a. These results showed similar trends to those in Fig. 3b, indicating there is a good intensity-concentration correlation using the smartphone device. The main differences between the smartphone device and the fluorimeter include (1) the data from the smartphone device has larger variation, which is mainly due to the fluctuation of the low-cost laser diode, (2) the smartphone device has a smaller dynamic range compared to the fluorimeter. As can be seen in Fig. 6, the normalized intensity of sample 4 (concentration 20 μM) is more than half of the total measurable intensity. While in Fig. 3b, the normalized intensity of sample 5 (concentration 20 μM) is just 40. The fitted slope of the smartphone device, as shown in Fig. 6b, is 2.20 while the slope of the desktop reader is 1.27, which means the smartphone device becomes saturated much faster. Additionally, the detection limit was found to be 2.96 μM and the quantification limit was found to be 9.86 μM.
Fig. 6.
(a) S4A based concentration tests in PBS. The fluorescence intensity changes (ΔI) of SSP5 (10 μM) in the presence of PSD. PSD concentrations were: (1) 1 μM; (2) 5 μM; (3) 10 μM; (4) 20 μM; (5) 40 μM; (6) 80 μM; (7) 100 μM. (b) Correlation of the normalized intensity vs. concentration by using the smartphone device.
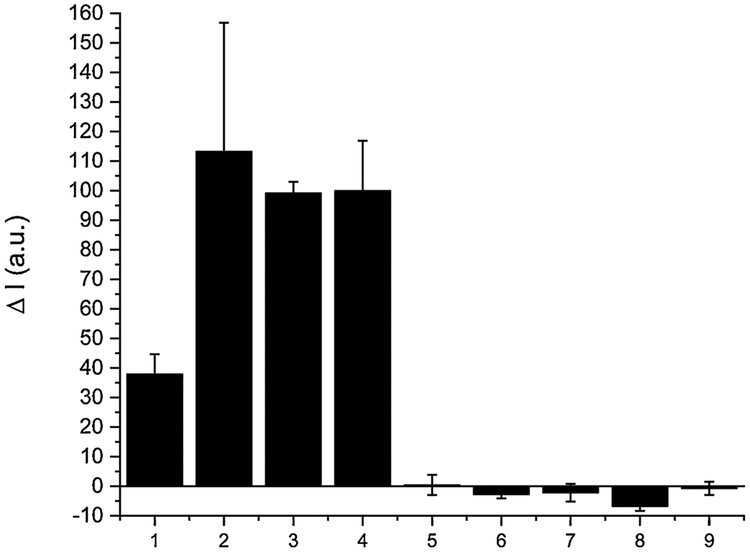
Fig. 7 shows the selectivity test results using S4A. The results indicate that the smartphone device can successfully differentiate sulfane sulfurs from other samples. Similar to Fig. 6a, the smartphone device has a larger variation due to the fluctuation of the laser diode.
Fig. 7.
S4A based selectivity tests in PBS. The change in fluorescence intensity (ΔI) of SSP5 (10 μM) in the presence of various RSS. (1) 50 μM S8; (2) 50 μM H2S2; (3) 50 μM H2S3; (4) 50 μM PSD; (5) 100 μM H2S; (6) 100 μM Na2SO3; (7) 100 μM HCys; (8) 1 mM Cys; (9) 5 mM GSH.
Fig. 8 depicts the sulfane sulfur concentrations in a urine system, using the smartphone device. The results have a good linear relationship between intensity and concentration. The determination of PSD content in urine samples was demonstrated. The results show satisfactory recovery of PSD even with a low content (12 μM) can be obtained (Table S1). All together we conclude that the smartphone device, together with the new fluorescent sensor SSP5, can be used for remote, in-filed applications to replace expensive and bulky desktop equipment and can obtain compatible results to the desktop equipment.
Fig. 8.
S4A based concentration tests in urine system. The fluorescence intensity changes (ΔI) of SSP5 (10 μM) in the presence of PSD. PSD concentrations were: (1) 1 μM; (2) 5 μM; (3) 10 μM; (4) 20 μM; (5) 40 μM.
4. Conclusions
In summary, we reported here a new fluorescent probe (SSP5) that is suitable for smartphone based sulfane sulfur detection. The fluorophore of SSP5 was a rhodol derivative (λex 582 nm; λem 634 nm). Its photophysical property makes it appropriate for the detection using the smartphone based device S4A. This probe was proved to be selective and sensitive for representative sulfane sulfur species including persulfides, polysulfides, and elemental sulfur. It did not show responses to other biologically relevant sulfur species such as cysteine, glutathione, homocysteine, H2S, and sulfite. The efficiency of SSP5 was demonstrated in aqueous buffers and synthetic urine, by using both a standard fluorimeter and S4A. The low-cost and compact smartphone device S4A has achieved comparable performance with the standard fluorimeter. The larger standard deviation of the S4A is mainly due to the fluctuation of the low-cost laser diode, which can be improved in the future by using high quality laser or high intensity light emitting diodes (LEDs). The proposed system (SSP5 + S4A) has proven to be an effective combination for rapid and high accuracy detection applications in remote and low-resource settings. Further optimization on both the device design/apparatus functionality and probe’s fluorophore sensitivity are currently on-going in our laboratory.
Supplementary Material
Acknowledgements
This work was supported by NIH (R21DA046386) and NSF (CHE1738305) to M.X.; and Washington State University Gap Fund to L.L. Yu-Chung Chang and Lei Li would like to acknowledge Shining 3D, Zhejiang Province, China for supporting of 3D printer and filament.
Footnotes
Appendix A. Supplementary data
Supplementary material related to this article can be found, in the online version, at doi:https://doi.org/10.1016/j.snb.2019.04.099.
References
- [1].Wang R, Physiological implications of hydrogen sulfide: a whiff exploration that blossomed, Physiol. Rev 92 (2012) 791–896. [DOI] [PubMed] [Google Scholar]
- [2].Wang R, Gasotransmitters: growing pains and joys, Trends Biochem. Sci 39 (2014) 227–232. [DOI] [PubMed] [Google Scholar]
- [3].Moore PK, Bhatia M, Moochhala S, Hydrogen sulfide: from the smell of the past to the mediator of the future? Trends Pharmacol. Sci 24 (2003) 609–611. [DOI] [PubMed] [Google Scholar]
- [4].Hu L-F, Lu M, Tiong CX, Dawe GS, Hu G, Bian J-S, Neuroprotective effects of hydrogen sulfide on parkinson’s disease rat models, Aging Cell 9 (2010) 135–146. [DOI] [PubMed] [Google Scholar]
- [5].Li L, Moore P, Putative biological roles of hydrogen sulfide in health and disease: a breath of not so fresh air? Trends Pharmacol. Sci 29 (2008) 84–90. [DOI] [PubMed] [Google Scholar]
- [6].Lynn EG, Austin RC, Hydrogen sulfide in the pathogenesis of atherosclerosis and its therapeutic potential, Expt. Rev. Clin. Pharmacol 4 (2011) 97–108. [DOI] [PubMed] [Google Scholar]
- [7].Polhemus DJ, Lefer DJ, Emergence of hydrogen sulfide as an endogenous gaseous signaling molecule in cardiovascular disease, Circ. Res 114 (2014) 730–737. [DOI] [PMC free article] [PubMed] [Google Scholar]
- [8].Szabó C, Hydrogen sulphide and its therapeutic potential, Nat. Rev. Drug Disco 6 (2007) 917. [DOI] [PubMed] [Google Scholar]
- [9].Predmore BL, Lefer DJ, Gojon G, Hydrogen sulfide in biochemistry and medicine, Antioxid. Redox Sig 17 (2012) 119–140. [DOI] [PMC free article] [PubMed] [Google Scholar]
- [10].Greiner R, Pálinkás Z, Bäsell K, Becher D, Antelmann H, Nagy P, Dick TP, Polysulfides link H2S to protein thiol oxidation, Antioxid. Redox Signal 19 (2013) 1749–1765. [DOI] [PMC free article] [PubMed] [Google Scholar]
- [11].Ida T, Sawa T, Ihara H, Tsuchiya Y, Watanabe Y, Kumagai Y, Suematsu M, Motohashi H, Fujii S, Matsunaga T, et al. , Reactive cysteine persulfides and S-polythiolation regulate oxidative stress and redox signaling, Proc. Natl. Acad. Sci 111 (2014) 7606–7611. [DOI] [PMC free article] [PubMed] [Google Scholar]
- [12].Kimura Y, Mikami Y, Osumi K, Tsugane M, Oka J, Kimura H, Polysulfides are possible H2S-derived signaling molecules in rat brain, FASEB J. 27 (2013) 2451–2457. [DOI] [PubMed] [Google Scholar]
- [13].Toohey JI, Sulfur signaling: is the agent sulfide or sulfane? Anal. Biochem 413 (2011) 1–7. [DOI] [PubMed] [Google Scholar]
- [14].Chen W, Liu C, Peng B, Zhao Y, Pacheco A, Xian M, New fluorescent probes for sulfane sulfurs and the application in bioimaging, Chem. Sci 4 (2013) 2892. [DOI] [PMC free article] [PubMed] [Google Scholar]
- [15].Chen W, Rosser EW, Zhang D, Shi W, Li Y, Dong W-J, Ma H, Hu D, Xian M, A specific nucleophilic ring-opening reaction of Aziridines as a unique platform for the construction of hydrogen polysulfides sensors, Org. Lett 17 (2015) 2776–2779. [DOI] [PMC free article] [PubMed] [Google Scholar]
- [16].Chen W, Rosser EW, Matsunaga T, Pacheco A, Akaike T, Xian M, The development of fluorescent probes for visualizing intracellular hydrogen polysulfides, Angew. Chem. Int. Ed 54 (2015) 13961–13965. [DOI] [PMC free article] [PubMed] [Google Scholar]
- [17].Chen W, Pacheco A, Takano Y, Day JJ, Hanaoka K, Xian M, A single fluorescent probe to visualize hydrogen sulfide and hydrogen polysulfides with different fluorescence signals, Angew. Chem. Int. Ed 55 (2016) 9993–9996. [DOI] [PMC free article] [PubMed] [Google Scholar]
- [18].Gao M, Yu F, Chen H, Chen L, Near-infrared fluorescent probe for imaging mitochondrial hydrogen polysulfides in living cells and in vivo, Anal. Chem 87 (2015) 3631–3638. [DOI] [PubMed] [Google Scholar]
- [19].Han X, Song X, Li B, Yu F, Chen L, A near-infrared fluorescent probe for sensitive detection and imaging of sulfane sulfur in living cells and in vivo, Biomater. Sci 6 (2018) 672–682. [DOI] [PubMed] [Google Scholar]
- [20].Kawagoe R, Takashima I, Uchinomiya S, Ojida A, reversible ratiometric detection of highly reactive hydropersulfides using a FRET-based dual emission fluorescent probe, Chem. Sci 8 (2017) 1134–1140. [DOI] [PMC free article] [PubMed] [Google Scholar]
- [21].Takano Y, Hanaoka K, Shimamoto K, Miyamoto R, Komatsu T, Ueno T, Terai T, Kimura H, Nagano T, Urano Y, Development of a reversible fluorescent probe for reactive sulfur species, sulfane sulfur, and its biological application, Chem. Commun 53 (2017) 1064–1067. [DOI] [PubMed] [Google Scholar]
- [22].Umezawa K, Kamiya M, Urano Y, A reversible fluorescent probe for real-time live-cell imaging and quantification of endogenous hydropolysulfides, Angew. Chem. Int. Ed 57 (2018) 9346–9350. [DOI] [PubMed] [Google Scholar]
- [23].Shimamoto K, Hanaoka K, Fluorescent probes for hydrogen sulfide (H2S) and sulfane sulfur and their applications to biological studies, Nitric Oxide 46 (2015) 72–79. [DOI] [PubMed] [Google Scholar]
- [24].Gao M, Wang R, Yu F, Li B, Chen L, Imaging of intracellular sulfane sulfur expression changes under hypoxic stress via a selenium-containing near-infrared fluorescent probe, J. Mater. Chem. B Mater. Biol. Med 6 (2018) 6637–6645. [DOI] [PubMed] [Google Scholar]
- [25].Gao M, Wang R, Yu F, Chen L, Evaluation of sulfane sulfur bioeffects via a mitochondria-targeting selenium-containing near-infrared fluorescent probe, Biomaterials 160 (2018) 1–14. [DOI] [PubMed] [Google Scholar]
- [26].Ihara H, Kasamatsu S, Kitamura A, Nishimura A, Tsutsuki H, Ida T, Ishizaki K, Toyama T, Yoshida E, Hamid HA, et al. , Exposure to electrophiles impairs reactive persulfide-dependent redox signaling in neuronal cells, Chem. Res. Toxicol 30 (2017) 1673–1684. [DOI] [PubMed] [Google Scholar]
- [27].Marutani E, Sakaguchi M, Chen W, Sasakura K, Liu J, Xian M, Hanaoka K, Nagano T, Ichinose F, Cytoprotective effects of hydrogen sulfide-releasing N-methyl-d-aspartate receptor antagonists mediated by intracellular sulfane sulfur, Med. Chem. Res 5 (2014). [DOI] [PMC free article] [PubMed] [Google Scholar]
- [28].Olson KR, Gao Y, Arif F, Arora K, Patel S, DeLeon ER, Sutton TR, Feelisch M, Cortese-Krott MM, Straub KD, Metabolism of hydrogen sulfide (H2S) and production of reactive sulfur species (RSS) by superoxide dismutase, Redox Biol. 15 (2018) 74–85. [DOI] [PMC free article] [PubMed] [Google Scholar]
- [29].Sakaguchi M, Marutani E, Shin H, Chen W, Hanaoka K, Xian M, Ichinose F, Sodium thiosulfate attenuates acute lung injury in mice, Anesthesiology 121 (2014) 1248–1257. [DOI] [PMC free article] [PubMed] [Google Scholar]
- [30].Takahashi N, Wei F-Y, Watanabe S, Hirayama M, Ohuchi Y, Fujimura A, Kaitsuka T, Ishii I, Sawa T, Nakayama H, et al. , Reactive sulfur species regulate TRNA methylthiolation and contribute to insulin secretion, Nucleic Acids Res. 45 (2017) 435–445. [DOI] [PMC free article] [PubMed] [Google Scholar]
- [31].Yadav PK, Martinov M, Vitvitsky V, Seravalli J, Wedmann R, Filipovic MR, Banerjee R, Biosynthesis and reactivity of cysteine persulfides in signaling, J. Am. Chem. Soc 138 (2016) 289–299. [DOI] [PMC free article] [PubMed] [Google Scholar]
- [32].Friedrichs A, Busch JA, van der Woerd HJ, John C, Zielinski O, Measuring fluorescence by means of smartphones with the new citclops-application, Ocean Opt. XXII (2014) 26–31. [Google Scholar]
- [33].Grasse EK, Torcasio MH, Smith AW, Teaching UV–Vis spectroscopy with a 3D-printable smartphone spectrophotometer, J. Chem. Educ 93 (2016) 146–151. [Google Scholar]
- [34].Hossain A, Canning J, Ast S, Rutledge PJ, Teh Li Yen A Jamalipour, Lab-in-a-phone: smartphone-based portable fluorometer for PH measurements of environmental water, IEEE Sens. J 15 (2015) 5095–5102. [Google Scholar]
- [35].Hussain I, Ahamad KU, Nath P, Low-cost, robust, and field portable smartphone platform photometric sensor for fluoride level detection in drinking water, Anal. Chem 89 (2017) 767–775. [DOI] [PubMed] [Google Scholar]
- [36].Long KD, Woodburn EV, Le HM, Shah UK, Lumetta SS, Cunningham BT, Multimode smartphone biosensing: the transmission, reflection, and intensity spectral (TRI)-analyzer, Lab Chip 17 (2017) 3246–3257. [DOI] [PMC free article] [PubMed] [Google Scholar]
- [37].Peng B, Chen W, Liu C, Rosser EW, Pacheco A, Zhao Y, Aguilar HC, Xian M, Fluorescent probes based on nucleophilic substitution-cyclization for hydrogen sulfide detection and bioimaging, Chem. Eur. J 20 (2014) 1010–1016. [DOI] [PMC free article] [PubMed] [Google Scholar]
- [38].Song X, Dong B, Kong X, Wang C, Zhang N, Lin W, A sensitive and selective red fluorescent probe for imaging of cysteine in living cells and animals, Anal. Methods 9 (2017) 1891–1896. [Google Scholar]
- [39].Artaud I, Galardon EA, Persulfide analogue of the nitrosothiol SNAP: formation, characterization and reactivity, ChemBioChem 15 (2014) 2361–2364. [DOI] [PubMed] [Google Scholar]
- [40].Liu Y, Deng C, Tang L, Qin A, Hu R, Sun JZ, Tang BZ, Specific detection of d-glucose by a tetraphenylethene-based fluorescent sensor, J. Am. Chem. Soc 133 (2011) 660–663. [DOI] [PubMed] [Google Scholar]
- [41].Wang L-J, Chang Y-C, Ge X, Osmanson AT, Du D, Lin Y, Li L, Smartphone optosensing platform using a DVD grating to detect neurotoxins, ACS Sens. 1 (2016) 366–373. [Google Scholar]
- [42].Scheffler L, Sauermann Y, Heinlein A, Sharapa C, Buettner A, Detection of volatile metabolites derived from garlic (Allium sativum) in human urin, Metabolites 6 (2016) 43. [DOI] [PMC free article] [PubMed] [Google Scholar]
- [43].Silva CL, Passos M, Câmara JS, Solid phase microextraction, mass spectrometry and metabolomic approaches for detection of potential urinary cancer bio-markers—a powerful strategy for breast cancer diagnosis, Talanta 89 (2012) 360–368. [DOI] [PubMed] [Google Scholar]
Associated Data
This section collects any data citations, data availability statements, or supplementary materials included in this article.


