Abstract
Monitoring of in vivo drug release from nan by non-invasive approaches Remains very challenging. Herein we report on novel redox-responsive polymeric magnetosomes (PolyMags) with tunable magnetic resonance imaging (MRI) properties for in vivo drug release monitoring and effective dual-modal cancer therapy. The encapsulation of doxorubicin (DOX) significantly decreased PolyMags’ T2 contrast enhancement and transverse relaxation rate R2, depending on the drug loading level. The T2 enhancement and R2 could be recovered once the drug was released upon PolyMags’ disassembly. T2 & T2* MRI and diffusion-weighted imaging (DWI) were utilized to quantitatively study the correlation between MRI signal changes and drug release, and discover the MR tuning mechanisms. We visualized the in vivo drug release pattern based on such tunable MRI capability via monitoring the changes in T2-weighted images, T2 & T2* maps and R2 & R2* values. Interestingly, the PolyMags possessed excellent photothermal effect, which could be further enhanced upon DOX loading. The PolyMags were highly efficacious to treat breast tumors on xenograft model with tumor-targeted photothermal-and chemo-therapy, achieving a complete cure rate of 66.7%. The concept reported here is generally applicable to other micellar and liposomal systems for image-guided drug delivery & release applications toward precision cancer therapy.
Keywords: Drug release, magnetic resonance imaging, nanoparticles, cancer therapy
Graphical Abstract
1. Introduction
Nanotheranostics are emerging as a promising paradigm towards personalized cancer diagnosis and therapy[1, 2, 3]. Due to their excellent drug-loading capacity and biocompatibility, several organic nanoparticles, such as doxorubicin-loaded liposomes and paclitaxel-loaded polymeric micelles have been clinically approved or in clinical trials for cancer therapy. However, these organic nanoparticles have mainly been applied to drug delivery, but lacked imaging monitoring for drug release and treatment outcomes. The integration of therapeutic functions and molecular imaging functions such as magnetic resonance imaging (MRI) into a single nanoparticle allows precise multimodal treatment of tumor, real-time imaging monitoring of drug delivery & release in vivo, and evaluation of treatment efficacy[4, 5, 6, 7, 8, 9]. So far, great attention has been paid to inorganic materials as MRI contrast agents[10, 11, 12, 13], such as manganese-based materials[14, 15, 16], gadolinium chelation[17, 18], and superparamagnetic iron oxide nanoparticles (SPIO)[19, 20], etc. One of the promising and clinically relevant inorganic materials is SPIO that has been used extensively for MRI contrast agents and tumor thermotherapy due to their excellent biocompatibility and superparamagnetic properties.[21]
Development of activatable MR imaging associated with disease diagnosis and treatment would greatly advance molecular imaging of disease at in vivo level. Responsive T1 or T2 contrast agents result in changes of either R1 or R2 (relaxation rate) in tumor-microenvironment related factors, such as redox stress (GSH) [27, 28], enzymatic activity[29, 30], and pH activity[31, 32] associated with cancer, enabled high sensitivity and high signal-to-noise ratio imaging with low background. Monitoring the drug release from nanoparticles in vivo has been a longstanding challenge for the research community. Fluorescence-based approaches such as Förster resonance energy transfer (FRET) have been utilized to monitor the drug release from nanoparticles based on FRET signal changes depending on the distance between the drug and nanocarrers[33, 34, 35, 36, 37, 38]. However, the in vivo applications of such approaches were limited by their tissue penetration. Nanocarriers and drugs dually labeled with two distinct radiotracers have been prepared so that the drug release could be monitored by radioautography based on the co-localization or separation of the two radio signals[39]. However, such nano-constructs were rather complicated and there was radiation involved. Due to the excellent tissue penetration, there have been attempts to use MRI to monitor the drug release in vivo [40, 41, 42, 43, 44]. For instance, recent study[40] showed that the transverse T2 MR relaxation time of clinically approved iron oxide nanoparticles (Ferumoxytol) could be increased due to the inaccessibility to water protons caused by the carried hydrophobic drugs, but could be decreased upon the release of the drug cargos. This unique MRI property could potentially be used to non-invasively monitor the drug release from nanoparticles in vivo in a real-time manner.
Drug resistance and recurrence are common problems for mono-modal cancer therapy as the tumors are very heterogeneous. To achieve more effective therapeutic effect, preclinical strategy may focus on different targets concurrently. Photothermal therapy is an intriguing cancer therapeutic strategy, which employs photo-absorbing materials that can convert light energy to hyperthermia to controllably and in situ “burn” the tumor tissues[22, 23]. By comparing with other traditional therapeutic approaches, PTT is superior due to its high specificity, controllability, minimal invasiveness and high spatiotemporal selectivity. The combination therapy of PTT and chemotherapy provided much more effective efficacy in the treatment of cancer, as the PTT could synergistically improve the chemotherapeutic effect[24, 25]. In recent research, SPIO has recently been proposed as agents to transform near-infrared fluorescence (NIRF) to hyperthermia for PTT against cancer[26], which may synergistically improve the therapeutic effect of other treatments.
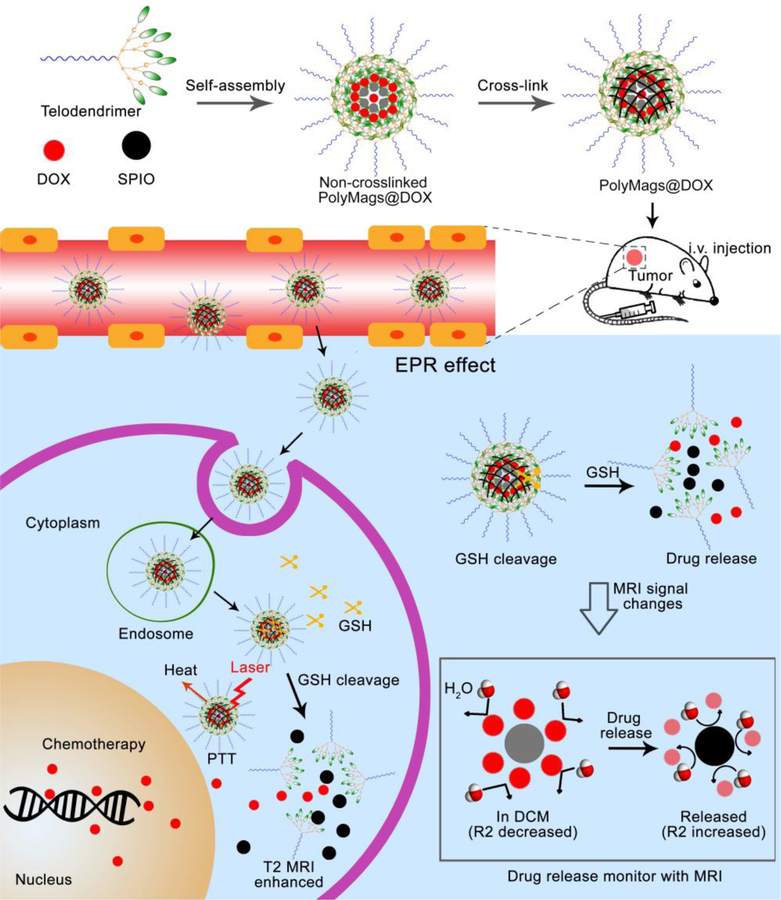
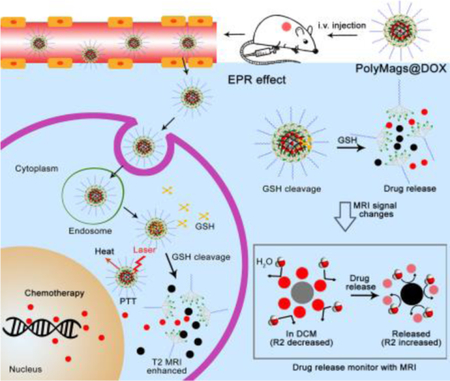
In this study, we developed responsive polymeric magnetosomes (PolyMags) nanoplatform, which not only integrated the merits of nanotechnology, such as multifunctionality, tumor selectivity, tumor micro-environment responsiveness, but also enabled to non-invasively monitor the in vivo drug release by MRI via changes of T2-weighted images, T2 & T2* maps and R2 & R2* values in the tumors. As shown in Figure 1, the responsive PolyMags were constructed by concurrent encapsulation of T2 contrast agents (SPIO) and a chemotherapeutic drug (DOX) into a disulfide cross-link micelle (DCM)[45]. In the PolyMags, the SPIO (considered as an ‘enhancer’ in T2 MRI signal) and DOX were locked within micelle core, resulting in significant decrease in T2 MRI contrast and transverse relaxation rate (R2) because the hydrophobic DOX molecules expel the water molecules from contacting with SPIO, as discovered by MR diffusion-weighted imaging (DWI). Upon interaction with biological stimuli, such as GSH, the payloads in the PolyMags could be responsively released, and T2 MRI contrast and R2 could be increased accompanied by the disassembly of the micelles. Moreover, the hydrophobic DOX molecules allowed the core of the micelle packed tighter, which could significantly enhance the photothermal effect of encapsulated SPIO nanoparticles, leading to a superior anti-tumor effect. Our results highlight the PolyMags with great biocompatibility as newly developed activatable image-guided drug delivery nanoplatform useful for theranostic applications of cancers.
Figure 1.
Schematic illustrated the design of MRI based theranostic polymeric magnetosomes (PolyMags).
2. Results and Discussion
2.1. Fabrication and Characterization of the PolyMags
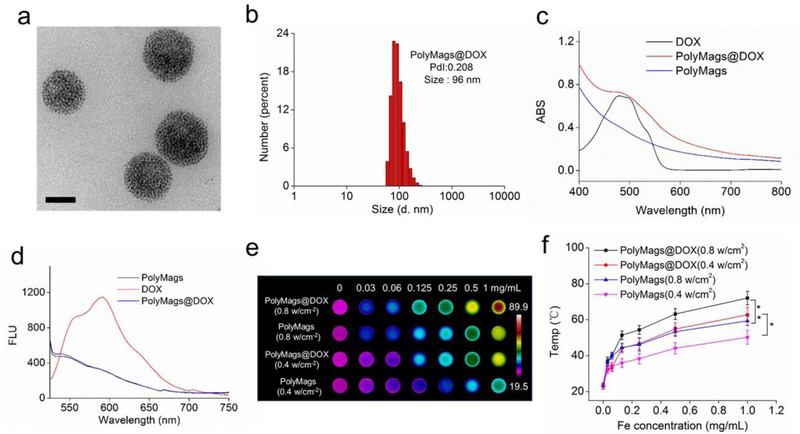
The thiolated telodendrimers, building blocks of DCM were synthesized based on our published methods[45, 47, 48]. Then, the T2 MRI contrast agent (SPIO) and a chemotherapeutic drug (DOX) were co-encapsulated in DCM, and formed DOX-loaded PolyMags (PolyMags@DOX). The morphology of PolyMags@DOX was observed by TEM. As shown in Figure 2a, the nanoparticles showed uniform spherical morphology, and hundreds of small SPIO nanoparticles were evenly constrained in a well-defined area, indicating the DCM acted as a perfect enclosure that effectively held the SPIO nanoparticles in a nanoscale structure. The DLS results indicated the hydrodynamic diameter of the PolyMags@DOX was around 96 nm (Figure 2b). The empty PolyMags (w/o DOX) were also fabricated as a control, as shown in Figure S1 in the Supporting Information. The PolyMags exhibited similar morphology as compared to the PolyMags@DOX. Then, the optical properties of the nanoparticles were investigated. The UV-vis absorbance (Figure 2c) of DOX showed obvious absorbance at around 480 nm, while that of empty PolyMags exhibited full-spectrum absorption. The pattern of the absorbance spectra of PolyMags@DOX was similar to that of empty PolyMags except that an obvious peak at around 480 nm could be observed at DOX’s absorbance band, supporting that the PolyMags@DOX contained both SPIO and DOX. In fluorescence spectra (Figure 2d), the free DOX exhibited strong fluorescence at around 590 nm, and empty PolyMags almost showed no distinguishable fluorescence. While encapsulating DOX and SPIO together in DCM, the fluorescence of DOX was quenched. The fluorescence quenching of DOX was ascribed to the “π~π” stacking among the planar chemical structures of DOX. The above result confirmed that SPIO and DOX were successfully co-encapsulated in the DCM to form the PolyMags@DOX. Since the cross-linked DCM could reinforce the stability of the nanoparticles, we incubated the PolyMags@DOX and empty PolyMags with 10% and 100% serum, and monitored the size distribution by DLS. As shown in Figure S2 in the Supporting Information, both nanoparticles kept in the stable size range even in 100% serum for up to 10 days, indicating the excellent stability of our cross-linked PolyMags in physiological conditions.
Figure 2.
Self-assembly and characterizations of the PolyMags@DOX (DOX loading: 2 mg/mL). a) TEM micrograph of the PolyMags@DOX nanoparticles. Scale bar is 50 nm. b) Size distributions of the PolyMags@DOX nanoparticles measured by dynamic light scattering (DLS). c) UV-vis absorbance and d) fluorescence spectra of empty PolyMags, free DOX and the PolyMags@DOX. Excitation was 480 nm. e) Thermal images and f) quantitative temperature change (n=3). The results were shown as the mean ± s.d. The temperature of PolyMags and PolyMags@DOX (Iron concentration ranges from 0.03 to 1.0 mg/mL) was monitored by a thermal camera after irradiation with NIR laser (680 nm) at 0.4 w/cm2 and 0.8 w/cm2 for 3 min. Statistical analysis was performed with a two-tailed Student’s t-test, ** p<0.01, * p<0.05.
2.2. Photothermal effect of PolyMags@DOX
As the PolyMags@DOX showed full-spectrum of UV-vis to near infrared (NIR) absorbance (Figure 2c), we hypothesized that the nanoparticles could absorb light energy and may exhibit photothermal effect. To attest this hypothesis, we measured the calorigenic property of empty PolyMags and the PolyMags@DOX with different iron concentrations (from 0 to 1 mg/mL) after being irradiated with 680 nm laser. As shown in Figure 2e, the temperature of empty PolyMags increased from 23.2 to 50.4 oC and from 23.8 to 59.2 oC upon irridation with a laser power level at 0.4 w/cm2 and 0.8 w/cm2, respectively, as the concentration increased from 0 to 1.0 mg/mL. Interestingly, the temperature of the PolyMags@DOX increased up to 72.3 oC at 0.8 w/cm2 with the same level of irradiation and SPIO concentration, suggesting that the co-loaded DOX was beneficial to the photothermal effect (Figure 2f). In comparison, Milli Q water showed imperceptible photothermal effect even at high light dose (0.8 w/cm2) (Figure S4, Supporting Information). The increase in temperature values may be caused by the tighter SPIO aggregation in the presence of hydrophobic DOX than SPIO only in the core the micelles.
2.3. GSH-and Laser-responsive payloads release
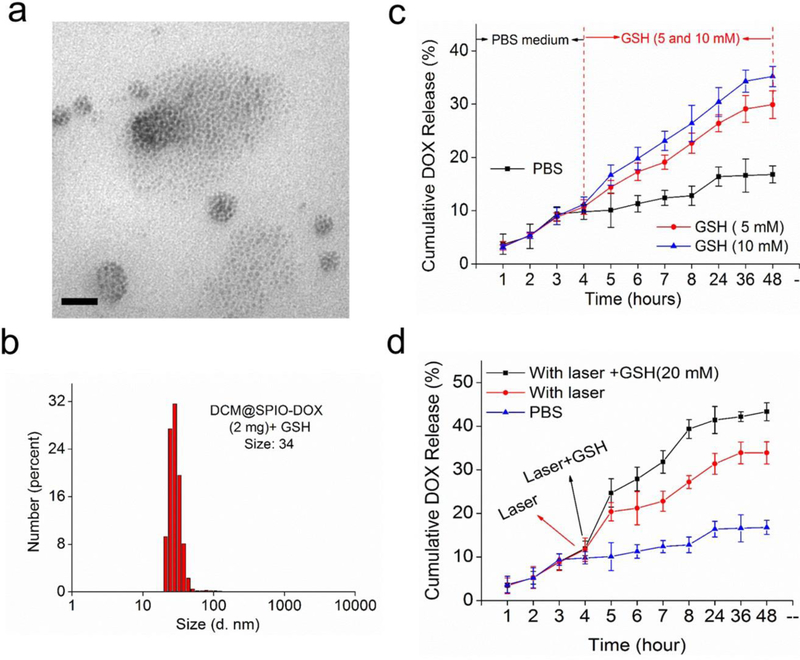
We then investigated the stimuli-responsive payloads release of the PolyMags@DOX. Firstly, the SPIO release was directly observed by TEM. As shown in Figure 3a, the uniformly aggregated SPIO nanoparticles (Figure 2a) were disassembled into small SPIO nanoparticles in random alignments with GSH and sodium dodecyl sulfate (SDS) to break down the disulfide crosslinked PolyMags@DOX. The size distribution in DLS results (Figure 3b) dramatically decreased from 96 nm to 34 nm, indicating part of the nanoparticles was disassembled and collapsed in the presence of GSH and SDS. The stimuli-responsive DOX release of the PolyMags@DOX was also monitored. As shown in Figure 3c, the drug release could be extensively expedited by the addition of GSH. The higher GSH concentration, the faster drug release rate was reached. The drug release behaviors upon laser irradiation and/or GSH incubation were shown in Figure 3d. In PBS buffer, the nanoparticles showed slow drug release profile with only 15% DOX released within 48 h. Upon irradiated by 680 nm laser, the drug release rate was dramatically increased (Figure 3d, red line), indicating the laser enabled to effectively trigger payloads release from the nanoparticles. This may be mainly caused by the photo-induced hyperthermia leading to the increased diffusion rate of the drug. The combination of laser irradiation and GSH incubation could further accelerate the drug release (Figure 3d, black line). The release patterns suggested that the PolyMags@DOX possessed dual-stimuli responsive drug release. Intracellular GSH level is higher than that in the cellular exterior in many malignancies, which may render the disulfide cross-linking reversible and could disassemble the micelles[48, 49, 50]. Therefore, the PolyMags@DOX may not only response to specific high GSH region in tumor cells, but also subjected to the external stimulus, like laser treatment, to achieve tumor-specific drug release.
Figure 3.
The payloads release of the PolyMags@DOX (DOX loading: 2 mg/mL). a) TEM micrograph and b) DLS results showed the disassembly of the PolyMags@DOX after being treated with 20 mM GSH for 24 h in the presence of 3 mg/mL SDS. Scale bar, 50 nm. c) DOX release profiles of the PolyMags@DOX with or without the addition of different GSH concentrations (5 and 10 mM) at a specific release time (4 h). d) DOX release profiles of the PolyMags@DOX in PBS without or with laser irradiation (680 nm, 0.4 w/cm2 for 3 min) and/or 20 mM concentration of GSH at 4 h.
2.4. Payloads-dependent T2 magnetic resonance quenching
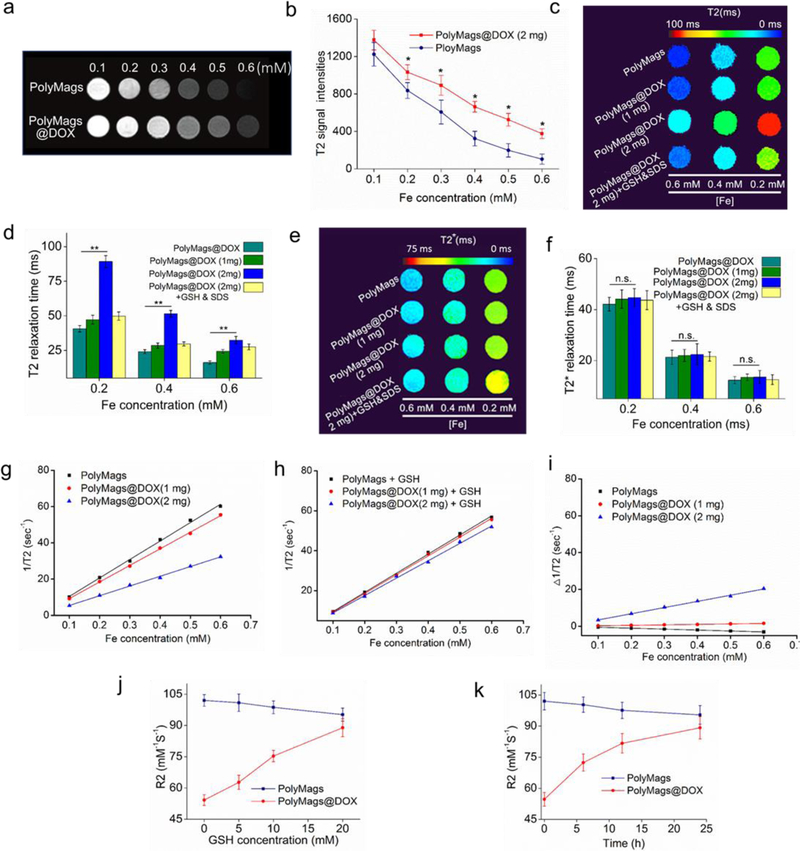
The T2 MRI properties of the PolyMags@DOX were investigated in comparison with empty PolyMags. As shown in Figure 4a, empty PolyMags showed concentration-dependent T2-MRI contrast enhancement. Interestingly, after loading DOX (2 mg/mL), the T2-MRI contrast of the PolyMags@DOX showed significant quenching (less darkness) compared to that of empty PolyMags at equivalent Fe concentrations (Figure 4a). This observation was consistent with the fact that the loading of DOX into PolyMags changed their T2 signal intensity (Figure 4b). To elucidate the impact of the loading level of DOX molecules on the T2 MR properties of loaded SPIO, we prepared a PolyMags@DOX formulation only with half of the DOX concentration (1 mg/mL). The TEM micrograph and size distributions of the PolyMags@DOX (1 mg/mL) could be found in Figure S3 in the Supporting Information. The PolyMags@DOX (1 mg/mL) showed similar morphology and slightly larger size compared to the PolyMags@DOX (2 mg/mL). We then recorded the Fe concentration-dependent T2-map of the PolyMags@DOX in comparison with empty PolyMags (Figure 4c). At equivalent Fe concentrations, empty PolyMags and the PolyMags@DOX (1 mg/mL) exhibited similar patterns in T2 map with lower T2 values compared to the PolyMags@DOX (2 mg/mL) (Figure 4d). However, the DOX payload at 1 mg/mL and 2 mg/mL into the PolyMags had neglectable effect on their T2* map and T2* relaxation time (Figure 4e, 4f), which solely depended on the SPIO content and particle concentration[40]. Then, we investigated the Fe concentration-dependent R2 relaxation rate changes of our nanoparticles. The R2 relaxation rate of empty PolyMags, the PolyMags@DOX (1 mg/mL) and PolyMags@DOX (2 mg/mL) were shown in Table. 1 and Figure 4g. Empty PolyMags and the PolyMags@DOX (1mg/mL) exhibited similar R2 relaxation rate. When the DOX concentration was increased to 2 mg/mL, the R2 relaxation rate of the PolyMags@DOX (2 mg/mL) was dramatically decreased (Table 1 and Figure 4g). Collectively, the above results demonstrated that encapsulation of DOX at contain concentration (e.g. 2 mg/mL) in the PolyMags could affect their R2 relaxation rate, which is likely due to the loss of access to water molecules from SPIO once surrounded by hydrophobic DOX molecules [40].
Figure 4.
The T2 MR signal changes accompanied with the payload release and dis-/assembly of the PolyMags@DOX. a) T2 weighted MRI of empty PolyMags and the PolyMags@DOX; c) The T2 weighted MRI of empty PolyMags and PolyMags@DOX at different Fe concentrations. Values reported are mean ± s. d. (n=3). c) T2 map and d) T2 relaxation time of empty PolyMags, PolyMags@DOX (1 mg/mL), PolyMags@DOX (2 mg/mL) and PolyMags@DOX (2 mg/mL) treated with GSH and SDS. e) T2* map and f) T2* relaxation time of empty PolyMags, PolyMags@DOX (1 mg/mL), PolyMags@DOX (2 mg/mL) treated with and without GSH and SDS at different Fe concentrations. g) Initial 1/T2 values measurements of empty PolyMags and PolyMags@DOX. h) 1/T2 values measurements before and after the nanoparticles were disassembled by GSH and SDS. i) Differential 1/T2 relaxation rate values prior to and after incubation with GSH in the presence of SDS. j) GSH concentration-dependent R2 activation of PolyMags@DOX (2 mg/mL) incubated with different concentration GSH from 0 to 20 mM. k) Time-dependent R2 activation of PolyMags@DOX (2 mg/mL) incubated with 20 mM GSH at special time point (0, 6, 12 and 24 h). Statistical analysis was performed with a two-tailed Student’s t-test, ** p<0.01, * p<0.05, n.s. p>0.05.
Table 1.
R2 relaxation rate ofempty PolyMags, the PolyMags@DOX (1 mg/mL) and the PolyMags@DOX (2 mg/mL) before and after the payload release.
| NPs | R2 (mM−1s−1) | △R2 | △ (rate) | |
|---|---|---|---|---|
| 0 h | 24 h | |||
| Empty PolyMags | 101.7 | 95.7 | −5.1 | −5.01% |
| PolyMags@DOX (1 mg/mL) | 91.5 | 94.1 | 2.6 | 2.84% |
| PolyMags@DOX (2 mg/mL) | 53.6 | 87.2 | 33.5 | 62.50% |
Note: Transverse relaxation rate R2 measurements were performed using 7.0 T MRI Scanner (Bruker Biospec, USA.) with a series of SPIO concentrations. All measurements were conducted in triplicate. R2 values were the slope of the fitting line.
2.5. Relationship between the MR signal changes and payload release
We hypothesized the quenched T2 MR signal could be recovered upon the release of drug payload. Upon the addition of GSH and SDS to the PolyMags@DOX (2 mg/mL), their R2-relaxation rate increased dramatically to the similar level of empty PolyMags (Figure 4c-d, g-h and Table 1). In comparison, empty PolyMags and the PolyMags@DOX (1 mg/mL) only showed minor changes in MR signal in the presence of GSH and SDS. As expected, the T2* map and T2* relaxation time remained similar upon the addition of GSH and SDS (Figure 4e-f). In addition, we investigated the correlation between T2 and T2* relaxation time of PolyMags and the PolyMags@DOX (1 and 2 mg) with various Fe concentrations, observed that the T2 and T2* relaxation times were negatively correlated with the iron concentrations (Figur S5a-b, Supporting Informatione). We then calculated the changes of R2-relaxation times of each group (Figure 4g-i and Table 1). The R2 values of the PolyMags@DOX (2 mg/mL) showed 62.50% increase (53.6 to 87.2 mM−1s−1) before and after the treatment with GSH and SDS (Figure 4g-i and Table 1). The empty PolyMags showed 5.01% decrease in R2 values, reflecting that the elevation of T2 MRI signal upon the aggregation of SPIO in the micelle core was reduced when the empty PolyMags were dissociated[51, 52]. PolyMags@DOX (1 mg/mL) showed <3% increase in R2 values (Figure 4i and Table 1). These percentages of changes in R2 of empty PolyMags and the PolyMags@DOX (1 mg/mL) were neglectable compared to that for the PolyMags@DOX (2 mg/mL). The above data suggested that the recovery of the PolyMags@DOX (2 mg/mL) could be correlated to the drug release in response to reducing agent GSH, providing the foundation of using MRI to monitor the drug payload release from nanoparticles in vivo.
We further investigated the T2 recovery of the PolyMags@DOX in response to GSH at different concentrations. As shown in Figure 4j, rapid elevation of R2 values of the PolyMags@DOX (2 mg/mL) accompanied with DOX release as GSH concentration increased, which were in accordance with the fact that DOX release could be extensively expedited by GSH (Figure 3d). Similarly, time-dependent R2 activation of the PolyMags@DOX (2 mg/mL) was also observed after the drug release upon the disassembly of drug loaded nanoparticles (Figure 4k). Notably, the drug release did not affect the T2* (Figure S6a-b, Supporting Information) of the PolyMags@DOX (2 mg/mL), which was dependent on the iron concentration rather than GSH concentration. In comparison, empty PolyMags did not exhibit significant change in T2 (Figure 4j-k), indicating that T2 activation of the PolyMags@DOX (2 mg/mL) was attributed to drug release.
2.6. Correlation between the R2 quenching and ADC values of the PolyMags@DOX
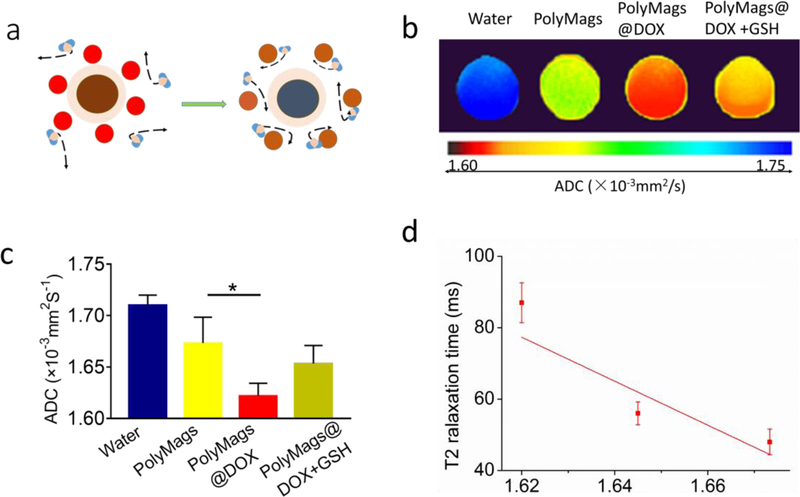
We hypothesized that the T2 quenching mechanism in the PolyMags@DOX (2 mg/mL) may be attributed to the surrounding hydrophobic DOX molecules that prevent SPIO from accessing water molecules. This may obstruct the free movement of water to the vicinity of the magnetic core (Figure 5a). To test this hypothesis, we performed diffusion-weighted imaging (DWI) to investigate if the hydrophobic DOX payload could reduce the diffusion of water molecules surrounding magnetic core. The apparent diffusion coefficient (ADC) map confirmed that the PolyMags@DOX (2 mg/mL) had lower diffusion coefficients than empty PolyMags at the same iron concentration, and their ADC values affected the T2 relaxation time (Figure5 b-d). Therefore, we believe the quenching effect of the T2 relaxivity may be due to payload DOX impairing the diffusion of water surrounding magnetic core rather than the aggregation of SPIOs in micelles and DOX itself exerting a direct effect.
Figure 5.
The diffusion-weighted imaging (DWI) of empty PolyMags and the PolyMags@DOX (2 mg/mL) treated with and without GSH and SDS. a) Schematic representation of the DOX payload in the PloyMags hinders the diffusion of water molecules, affecting the ability of SPIO to efficiently dephase water’s protons. b) The map and c) values of apparent diffusion coefficient (ADC) of empty PolyMags and the PolyMags@DOX (2 mg/mL) before and after treatment with GSH and SDS. d) ADC values of empty PolyMags (1.71×10⁻³mm2/S), the PolyMags@DOX (2 mg/mL) (1.65×10⁻³mm2/S) and the PolyMags@DOX (2 mg/mL) in the presence of GSH and SDS (1.67×10⁻³mm2/S) negatively correlated with the observed changes in T2 relaxation time (linear regression correlation coefficients R=0.93). Statistical analysis was performed with a two-sample t-test and Pearson correlation, * p<0.05.
2.7. Cell viability assessment
The antitumor efficacy of the nanoparticles was first evaluated in vitro. As shown in Figure S7, Supporting Information, empty micelle (DCM) and empty PolyMags exhibited neglectable toxicity towards MCF-7 cells, showing less than 10 % reduction of cell viability even at the highest concentration. All of the DOX containing formulations, including free DOX, DCM@DOX and PolyMags@DOX showed strong antitumor activities against MCF-7 breast cancer cells. The PolyMags@DOX groups showed more than 75% reduction of cell viability whereas DCM@DOX and free DOX groups showed 55% reduction of cell viability at a high concentration 100 μg/mL of DOX. The cell viability results supported that DOX, when encapsulated in the PolyMags, still kept its excellent anti-cancer efficacy.
2.8. In vivo drug release monitoring with MRI
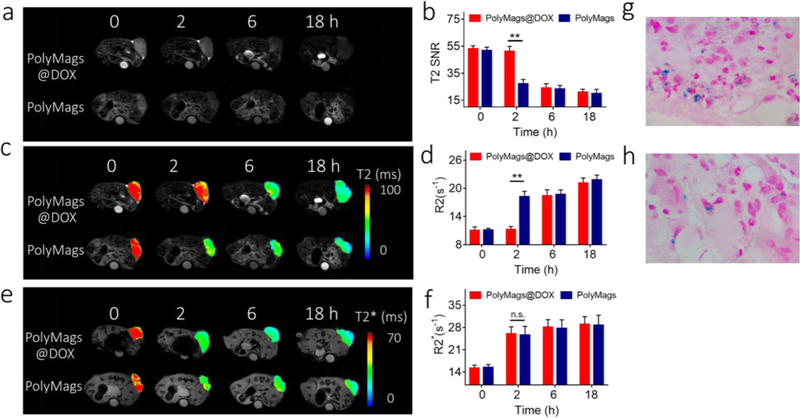
MRI offers much deeper tissue penetration over fluorescence-based approaches and therefore has greater potential to be used for monitoring the in vivo drug release from nanoparticles non-invasively. Previous studies reported that intracellular GSH level could be utilized to dissociate the disulfide cross-linked micelles and promote the payload release in many malignancies [48, 49, 50]. Given their tunable T2-MRI signal properties and GSH-responsive releasing feature, the PolyMags@DOX enabled to report the GSH-responsive payloads release in vivo by monitoring the T2-MRI signal changes. To prove this, the payload release of the PolyMags@DOX in mice bearing mammary cancer was monitored by MRI. The T2 signal changes at tumor sites could be attributed to the accumulation of the PolyMags@DOX and the subsequent payload release. To elucidate the accumulation caused T2 signal enhancement, we employed empty PolyMags with the same iron concentration and similar particle size as a control due to their non-tunable MR properties (Figure 4). In these experiments, T2 weighted images, T2 SNR, T2 & T2* maps and R2 & R2* values were obtained at various time points after injection of the PolyMags (Figure 6, and Table S1, Supporting Information). T2 SNR of tumors in mice treated with empty PolyMags decreased significantly at 2 h and reached an even lower value at 18 h post-injection, indicating the accumulation of these nanoparticles at tumor area (Figure 6a-b). In contrast, at 2 h post-injection, T2 SNR of tumors in mice bearing tumor treated with the PolyMags@DOX remained at a similar level to that of pre-injection, and was significantly higher than that treated with empty PolyMags (p<0.05) (Figure 6a&b and Table S1, Supporting Information). These results suggested the T2 MRI signal of the PolyMags@DOX in tumor was still quenched likely due to the non-significant drug release from such nanoparticles at tumor site at 2 h post-injection. However, T2 SNR of tumors treated with the PolyMags@DOX decreased dramatically at 6 h post-injection compared with that at 2 h post-injection, reaching a similar level compared to the group treated with empty PolyMags (Figure 6a-b and Table S1, Supporting Information), indicating the recovery of T2 MRI signal due to the increased drug release from the PolyMags@DOX at tumor site. Furthermore, we examined changes in T2 maps and T2 relaxation time (R2) of tumors at 2 h, 6 h, and 18 h after the administration of both nanoparticles. The study showed that the changes in T2 maps and R2 of were consistent with T2 SNR changes for the corresponding nanoparticle, and further highlighted the difference in T2 maps and R2 between empty PolyMags and the PolyMags@DOX groups from 2 h to 6 h post-injection (Figure 6c-d and Table S1, Supporting Information). In contrast, at all time-points, there were no significant differences in the T2* map and T2*relaxation rate (R2*) of tumors in nude mice treated with empty PolyMags and the PolyMags@DOX, indicating similar SPIO concentration in the tumors (Figure 6e-f and Table S1, Supporting Information). T2* weighted imaging is valued for the monitoring of SPIO depositions at the tumor and normal tissue because of its sensitivity to depositions of microiron. Based on the relationship between the MR signal changes and payload release (Figure 3–5), the changes in MRI signal at tumor site from 2 h to 6 h post-injection shown in Figure 6a-f could be attributed to the DOX release from the PolyMags@DOX occurred in vivo. Prussian blue staining further demonstrated the SPIO deposition in the tumors after being treated with the PolyMags@DOX and empty PolyMags (Figure 6 g-h). To summarize, the T2* map and T2* relaxation time (R2*) of the PolyMags@DOX that solely depended on the SPIO content and particle concentrations (Figure 4) could be considered as the baseline of SPIO accumulation at the tumor sites via EPR effect. The T2 map and T2 relaxation time (R2) of the PolyMags@DOX not only depended on the SPIO accumulation but was also affected by DOX loading and release. Therefore, we were able to assess and monitor the drug release by combining T2 and T2* MR sequences. In our animal experiments, we assigned the nude mice bearing MCF-7 breast cancer xenograft into two groups (experimental group: injection of the PolyMags@DOX, control group injection of empty PolyMags). MR imaging was acquired at different time points (0, 2, 6 and 18 h) before and after the injection of empty PolyMags and PolyMags@DOX. R2* values were no significant difference between two groups at the time points post-injection indicating the similar SPIO accumulation at the tumors sites due to EPR effect. The R2 values were significant different between the two groups and reflected the initial T2 quenching of the PolyMags@DOX (from 0 to 2 h) and subsequent T2 recovery (from 2 to 6 h) caused by the DOX release at the tumor sites. These results offer the promise for MR imaging of in vivo drug release in mice bearing mammary cancer and validate a general approach for monitoring drug delivery in vivo with MRI.
Figure 6.
In situ, non-invasive monitoring of the drug release from the PolyMags@DOX (2 mg/mL) by MRI. a) T2 weighted images, b) T2 SNR, c) T2 map, d) R2 values, e) T2* map and R2* values of the tumors of the nude mice bearing breast cancer at pre-injection, and 2 h, 6 h and 18 h post-injection of the PolyMags@DOX (2 mg/mL) and empty PolyMags. Injection volume: 300 µL, SPIO concentration: 100 µg/mL. The mean T2 signal intensities were measured for each tumor (Smean). Then the relative signal-to-noise ratio (SNR=Smean/NSD (standard deviation of the background signal)). Regions of interest (ROIs) had an area of 20–30 mm2 in the tumor. Prussian blue stain indicated the tumor accumulation of g) the PolyMags@DOX (2 mg/mL) and h) empty PolyMags. Statistical analysis was performed with a two-tailed Student’s t-test, ** p<0.01, * p<0.05, n.s. p>0.05. (n=3).
Photothermal effect of the nanoparticles
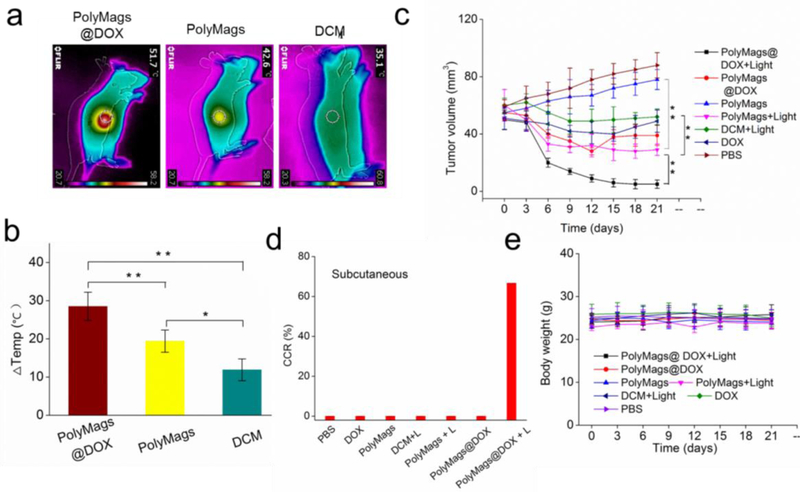
Laser-based treatment, such as photothermal therapy, may offer promising opportunities for tumor ablation[45]. Our PolyMags@DOX were proven to possess excellent photothermal capability (Figure 2e-f). For in vivo evaluation of their photothermal-chemotherapy efficiency, nude mice were subcutaneously transplanted with MCF-7 tumor cells to establish animal model bearing breast cancer xenograft. When the tumor size reached approximately 60 mm3, the mice were randomly assigned into 7 groups (n=6): PBS, free DOX, DCM, empty PolyMags, PolyMags@DOX, DCM with light, empty PolyMags with light and PolyMags@DOX with light groups. All groups were administered by intravenous injection. The light treated groups were irradiated with 680 nm at 0.8 W/cm2 for 3 min; the temperature of the tumors that were treated with the PolyMags@DOX and empty PolyMags rapidly increased due to hyperthermia generations from SPIO. As shown in Figure 7a-b, empty PolyMags also showed hyperthermia generation from 33.4 oCto 42.6 oC in the tumor. The PolyMags@DOX-treated tumors showed significantly higher temperature elevation than that were treated with empty PolyMags, from 33.2 oC to 51.7 oC, which was consistent with the in vitro photothermal assessments (Figure 2e-f). In comparison, the temperature in DCM treated tumor areas was not obviously affected by light irradiation, due to the absence of SPIO. The photothermal discrepancy illustrated that the PolyMags@DOX showed stronger PTT effect than empty PolyMags.
Figure 7.
PolyMags@DOX mediated dual-modal therapy in MCF-7 breast cancer animal models. a) Representative thermal images of tumors after light irradiation at 12 h post-injection of empty PolyMags, PolyMags@DOX and DCM. b) Temperature change in tumors of mice injected with empty PolyMags, PolyMags@DOX and DCM after irradiation (n=3). c) In vivo anti-tumor efficacy as of tumor volume, d) complete cure rate (CCR%) and e) body weight changes after intravenous treatment of different nanoparticles, free DOX and PBS control for a total of six doses with and without light irradation. For the above experiments, the light dose was 0.8 W cm−2 for 3 min, DOX dose was 5 mg/kg, (n=6). Statistical analysis was performed with a two-tailed Student’s t-test, ** p<0.01, * p<0.05.
2.9. In vivo dual-modal therapeutic effect of the PolyMags@DOX
To evaluate the photothermal and chemotherapeutic efficacy of each group, tumor volumes were measured over time after treatment (Figure 7c). In PBS control group and empty PolyMags group without irradiation, tumor volume increased rapidly, from approximately 60 mm3 to 90 mm3 over 18 days. Compared to the group treated with DCM (without SPIO) plus laser irradiation with limited tumor inhibition, the group treated with empty PolyMags and laser irradiation dramatically inhibited the growth of MCF-7 tumors, indicating their excellent in vivo photothermal effect. At 5 mg/kg dose level for DOX, PolyMags@DOX without irradiation appeared to be more effective than the free DOX group following intravenous administration. However, both chemotherapy groups at such dose level of DOX could not completely inhibit the tumor growth. Very interestingly, the combination therapy with PolyMags@DOX plus laser irradiation (0.8 W/cm2 for 3 min) achieved the best antitumor efficacy and totally inhibited tumor growth throughout the study (Figure 7c, Figure S8, Supporting Information). The above study results demonstrated that PolyMags@DOX mediated photothermal and chemotherapeutic treatment was more efficacious than either chemotherapy or photothermal therapy alone. The complete cure rate (CCR%) achieved by PolyMags@DOX+Light group was 66.7% while those for all other groups were 0% (Figure 7d). The potential synergism in PolyMags@DOX+Light treatment is likely due to 1) the enhanced photo-thermal effect of the PolyMags@DOX (Figure 7a-b), and 2) accelerated DOX release from the PolyMags@DOX upon irradiation, leading to a high drug concentration in the tumors and the promise of improving drug efficacy. There was no significant loss in body weight during treatment of the tumors for all groups (Figure 7e), indicating the systemic toxicity of our nanoparticles were neglectable.
2.10. Histology evaluations
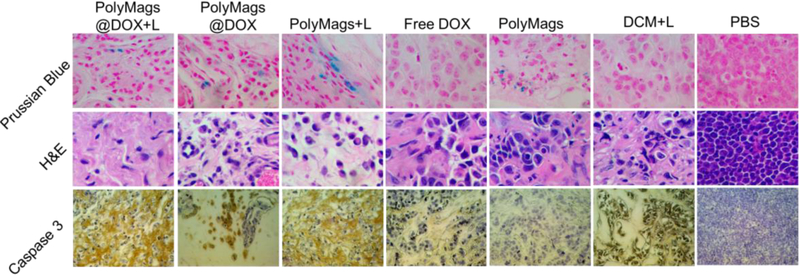
Histology analysis was performed to demonstrate the accumulation of SPIO at the tissue level and the changes to tumor tissue by the treatment of the PolyMags@DOX plus laser irradiation. As shown in Figure 8, Prussian blue stain demonstrated deposition of SPIO in tumor tissue in groups treated with the PolyMags@DOX and empty PolyMags, but not in the other non-SPIO treated group, indicating that our nanoparticles could accumulate in the tumor site. Furthermore, H&E staining of tumors was performed to verify the therapeutic effects after various ablation. The results from H&E showed that a higher level of necrotic areas in the PolyMags@DOX + L, PolyMags@DOX, free drug, PolyMags + L and DCM + L groups than that in the control group (PolyMags without light and PBS group). Correspondingly, caspase 3 staining of tumor slices also further discovered the higher percentage of apoptosis cells after the combination treated group (PolyMags@DOX + L) or single chemo-/photothermal-treated group compared with vehicle control group (PolyMags without light) and PBS control group.
Figure 8.
Prussian blue, H&E and caspase 3 stained slices of tumors collected from mice after various treatments indicated in the in vivo therapeutic studies.
3. Conclusion
In summary, we reported novel redox-responsive PolyMag based nanotheranostics with tunable MRI feature, which could act as self-reporting delivery vehicles for imaging agents and chemotherapeutic drugs. With the disulfide cross-linkage, our nanoparticles were highly stable in physiological condition, and enable to controllably release the payloads triggered by a reducing agent (GSH) and laser at tumor site. More importantly, the payloads release from these nanotheranostics could be correlated to the changes in T2 MRI signal. Based on such interesting tunable MRI property, the drug release at in vivo level in nude mice bearing breast cancer could be monitored by observing the changes of T2-weighted images, T2 SNR, T2 & T2* maps and R2 & R2* values with MRI. Activatable PolyMags have also been found to exhibit strong photothermal effects upon NIR laser irradiation and could be further enhanced after the co-encapsulation of DOX. The in vivo tumor ablation results suggested that the photothermal therapy was highly effective in MCF7 breast cancer mouse model. Under laser irradiation, the combination therapy with such multifunctional nanotheranostics was much more efficacious compared to free drug and single treatment alone. Therefore, the novel redox-responsive crosslinked nanotheranostics presented in this paper with tunable MRI property could be applied as smart nanotheranostic agents that can report the drug release, monitor the therapeutic process, and perform multimodal therapies on tumors. The ideas reported in this paper are generally applicable to other organic nanocarrier based drug delivery systems (e.g. liposomes and micelles) for image-guided drug delivery & release applications towards precision nanomedicine for disease-and patient-specific treatment.
4. Materials and methods
Synthesis of the building block for disulfide cross-linked micelle (DCM):
The thiolated telodendrimer for the synthesis of disulfide cross-linked micelles was established by our laboratory, and detailed synthesis procedures could be found in the previous publications[45, 46, 47, 48].
Preparations PolyMags:
Thiolated telodendrimer (10 mg) and SPIO (1.0 mg) were dissolved in methanol / chloroform (2 mL; vol/vol = 1:1). The mixed solution was then evaporated by a rotavapor to obtain a homogeneous dry film containing telodendrimer and SPIO. The thin film was reconstituted with water (1 mL) and sonicated for half an hour to form the PolyMags.
Preparation of drug loaded PolyMags:
Firstly, doxorubicin hydrochloride (DOX HCl) was stirred with 3 molar equivalents of triethylamine in methanol/chloroform (2 mL; vol/vol = 1:1) overnight to remove HCl. Then, 10 mg telodendrimer, 1 mg SPIO and 1 mg or 2 mg doxorubicin were dissolved in methanol/chloroform (2 mL; vol/vol = 1:1), evaporated, reconstituted in 1 mL water, and then sonicated for half hour for the fabrication of the PolyMags@DOX.
Characterizations of the nanoparticles:
The size distributions of all nanoparticles, including the PolyMags@DOX (1 and 2 mg/mL) and empty PolyMags, were performed by dynamic light scattering instrument (DLS, Nano ZS, Malvern) at 25 oC. The concentrations of the nanoparticles were kept at 0.5 mg/mL for DLS measurements. The morphology of the nanoparticles was observed by transmission electron microscopy (TEM, Philips CM-120). For TEM sample preparation, 10 µL aqueous solution of the nanoparticles (0.5 mg/mL) was deposited onto copper grids, and kept at room temperature to allow the samples dried naturally. The absorbance and fluorescence spectra were measured on a microplate reader (SpectraMax M3, USA).
Stability studies of the nanoparticles:
The empty PolyMags and the PolyMags@DOX nanoparticles were incubated with fetal bovine serum (FBS) (100% and 10%). The size distribution of the nanoparticles was carried out by DLS after incubating with FBS at different time. The concentrations of PolyMags@DOX were kept at 0.5 mg/mL for DLS measurements.
Relaxivity measurements of the nanoparticles:
The R2 values of empty PolyMags and the PolyMags@DOX were measured at 7.0 T MRI Scanner (Bruker Biospec, USA.) at 37 oC. The acquisition parameters were: T2WI: TR=1000 ms, TE=100 ms, slice thickness (1 mm), slice spacing (1 mm). A 100 mm square field of view(FOV)was used with an image matrix of 256 × 256. T2 map images: TR = 800–5000 ms, TE = 100 ms, FOV = 10 × 10 cm, matrix = 256 × 256. T2* images, TR/TE = (1500/4.0–61.5 ms), FOV = 10 × 10 cm, matrix = 256 × 256. For DWI, TR/TE=1000 ms / 60 ms, FOV=10 × 10 cm, matrix size=256 × 256, slice thickness=1 mm, slice number=3. We obtained images with two different b values (0 and 1000 s/mm2). The ADC values were measured using manufacture software.
Relaxivity measurements of the PolyMags@DOX in the presence of GSH and SDS:
The PolyMags@DOX (Fe concentrations was 10 mM) were incubated with GSH (0, 5, 10, 20 mM, 100 μL) in the presence of SDS (100 μL) before MRI scanning. Then, R2 values of the PolyMags@DOX were measured at different time point (0, 6, 12, 24 h) after incubation with GSH in the presence of SDS. The acquisition parameters were: T2WI: TR = 1000 ms, TE = 100 ms, slice thickness (1 mm), slice spacing (1 mm). A 100 mm square field of view (FOV) was used with an image matrix of 256 × 256. T2 map images: TR=800–5000 ms, TE=100 ms, FOV=10 × 10 cm, matrix=256 × 256. T2* images, the MRI parameters were TR/TE = (1500/4.0–61.5 ms), FOV = 10× 10 cm and matrix = 256 × 256.
Photothermal effect of the nanoparticles:
The photothermal property of empty PolyMags and the PolyMags@DOX nanoparticles (200 uL) with different Fe concentrations (0, 0.125, 0.25, 0.5, 1.0 mg/mL) was recorded with a FLIR thermal camera after light with NIR laser for 3 min (680 nm, 0.4 w cm−2 and 0.8 w cm−2). The photothermal property of Milli Q water as control group at different time point from 0 to 3 min was recorded with a FLIR thermal camera after light with NIR laser for 3 min (680 nm, 0.8 w cm−2).
DOX encapsulation efficiency and in vitro DOX release:
The PolyMags@DOX nanoparticles were placed in a 30,000 Da centrifugal dialysis tube and centrifuged at 5000 rpm for 10 min to remove residual DOX. The DOX encapsulation efficiency was determined from absorbance of free DOX by a microplate reader (SpectraMax M3, USA) and calculated according to the standard curve between the absorbance values and different DOX concentrations. For laser-triggered DOX release, the nanoparticles were placed in dialysis cartridges (Pierce Chemical Inc.) with a molecular weight cut-off (MWCO) of 3,500 Da to remove the released DOX. The dialysis cartridge was treated with or without NIR laser irradiation and GSH for 3 min (680 nm, 0.4 w cm−2) at 4 h. To investigate the GSH-responsive drug release, 1 mg/mL (0.5 mL) of the PolyMags@DOX with different GSH concentrations from 0 mM to 20 mM was injected into dialysis cartridges. The cartridges were dialyzed against 2 L PBS at 37oC. The DOX concentrations remained in the dialysis cartridge at various time points were calculated by the standard curve following absorbance measurements. The drug release was performed in triplicates to calculate the mean values.
MTT assay of the nanoparticles:
To evaluate the in vitro antitumor effect, the cytotoxicity of different concentrations of the PolyMags@DOX, empty PolyMags, DCM@DOX, DOX and DCM were incubated with MCF-7 breast cancer cells for 48 h, and analyzed by methyl thiazolyl tetrazolium (MTT) assay.
Animal and tumor models:
Nude mice with 4~5 weeks of age were ordered from Harlan (Livermore, CA) for tumor-bearing mice model establishment. All animal procedures were performed under the requirements of institutional guidelines and according to protocol No. 07–13119 approved by the Use and Care of Animals Committee at University of California, Davis. MCF-7 cells in a 200 µL mixture of PBS suspension and Matrigel (1:1 vol/vol) were injected subcutaneously into the right flank of nude mice. The tumor sizes for all nude mice were monitored and recorded weekly. Tumors reaching the dimensions of 0.6~1.0 cm3 were used for in vivo MR imaging to monitor drug release and for in vivo treatment.
Visualization of in vivo payloads release of PolyMags@DOX:
Nude mice bearing MCF-7 breast cancer xenograft were scanned on 7 T MRI equipped with a high-resolution animal coil, before and after injection of empty PolyMags and the PolyMags@DOX via tail vein (time points: 0, 2, 6 and 18 h; n=3). Mice received 300 µL of empty PolyMags and the PolyMags@DOX nanoparticles at a concentration of 100 µL/mL per mouse. All mice were imaged under the T2WI spin-echo sequence: TR/TE (2000/100 ms), matrix (256 × 256), FOV (64 cm2), slice thickness (1 mm), slice spacing (1 mm). For T2 map images, the MRI parameters were TR/TE = (800–5000/100 ms), FOV = 8 × 8 cm and matrix = 256 × 256. For T2* images, the MRI parameters were TR/TE = (1500/4.0–61.5 ms), FOV = 8 × 8 cm and matrix = 256 × 256. The mean T2-weighted signal intensities were measured for each tumor (Smean). Quantitative T2 & T2* maps were reconstructed from datasets using MATLAB software.
In vivo therapeutic studies:
Nude mice bearing MCF-7 breast cancer xenograft were used for the in vivo therapeutic studies (n=6). DOX, DCM, empty PolyMags, and the PolyMags@DOX (DOX dose: 5 mg/kg) were injected via tail vein for three doses, one dose per week, with PBS as the control group. After 24 h, tumors of the other sets of mice that treated with DCM, empty PolyMags, and the PolyMags@DOX were irradiated with a NIR laser system at 680 nm at 0.8 w cm−2 for 3 min. Tumor temperature enhancements in the central point of the illumination area were recorded continuously with a thermal camera. Tumor volume and body weight were measured at various time points. After 30 days, all mice were sacrificed, and the tumors were harvested for histopathology evaluation.
Statistical analysis:
All data was analyzed using SPSS 19.0 software; all results were presented as mean ± s.d. MRI signal intensity was compared using univariate Analysis of Variance, and SNK tests were used for binary comparison. P < 0.05 were considered statistically significant.
Supplementary Material
Acknowledgments
We thank the financial support from NIH/NCI (R01CA199668), NIH/NICHD (R01HD086195) and UC Davis Comprehensive Cancer Center Support Grant (CCSG) awarded by the National Cancer Institute (NCI P30CA093373).
Contributor Information
Zhongling Wang, Department of Radiology, Shanghai General Hospital, Shanghai Jiao Tong University School of Medicine, Shanghai 200080, China., Department of Biochemistry and Molecular Medicine, UC Davis Comprehensive Cancer Center, University of California Davis, Sacramento, CA 95817, USA..
Xiangdong Xue, Department of Biochemistry and Molecular Medicine, UC Davis Comprehensive Cancer Center, University of California Davis, Sacramento, CA 95817, USA..
Yixuan He, Department of Biochemistry and Molecular Medicine, UC Davis Comprehensive Cancer Center, University of California Davis, Sacramento, CA 95817, USA..
Ziwei Lu, Department of Radiology, the First Affiliated Hospital of Soochow University, Suzhou, Jiangsu 215006, China.
Bei Jia, Department of Biochemistry and Molecular Medicine, UC Davis Comprehensive Cancer Center, University of California Davis, Sacramento, CA 95817, USA..
Hao Wu, Department of Biochemistry and Molecular Medicine, UC Davis Comprehensive Cancer Center, University of California Davis, Sacramento, CA 95817, USA..
Ye Yuan, Department of Biochemistry and Molecular Medicine, UC Davis Comprehensive Cancer Center, University of California Davis, Sacramento, CA 95817, USA..
Yee Huang, Department of Biochemistry and Molecular Medicine, UC Davis Comprehensive Cancer Center, University of California Davis, Sacramento, CA 95817, USA..
Han Wang, Department of Radiology, Shanghai General Hospital, Shanghai Jiao Tong University School of Medicine, Shanghai 200080, China..
Hongwei Lu, Department of Biochemistry and Molecular Medicine, UC Davis Comprehensive Cancer Center, University of California Davis, Sacramento, CA 95817, USA..
Kit S. Lam, Department of Biochemistry and Molecular Medicine, UC Davis Comprehensive Cancer Center, University of California Davis, Sacramento, CA 95817, USA.
Tzu-yin Lin, Division of Hematology/Oncology, Department of Internal Medicine, University of California Davis, Sacramento, California 95817, USA.
Yuanpei Li, Department of Biochemistry and Molecular Medicine, UC Davis Comprehensive Cancer Center, University of California Davis, Sacramento, CA 95817, USA..
References
- [1].Mura S, Nicolas J, Couvreur P, Nat. Mater 2013, 12, 991. [DOI] [PubMed] [Google Scholar]
- [2].Cheng R, Meng F, Deng C, Klok H-A, Zhong Z, Biomaterials 2013, 34, 3647–3657. [DOI] [PubMed] [Google Scholar]
- [3].Stuart MAC, Huck WTS, Genzer J, Müller M, Ober C, Stamm M, Sukhorukov GB, Szleifer I, Tsukruk VV, Urban M, Winnik F, Zauscher S, Luzinov I, Minko S, Nat. Mater 2010, 9, 101. [DOI] [PubMed] [Google Scholar]
- [4].Chertok B, Moffat BA, David AE, Yu F, Bergemann C, Ross BD, Yang VC, Biomaterials 2008, 29, 487–496. [DOI] [PMC free article] [PubMed] [Google Scholar]
- [5].Mikhaylov G, Mikac U, Magaeva AA, Itin VI, Naiden EP, Psakhye I, Babes L, Reinheckel T, Peters C, Zeiser R, Bogyo M, Turk V, Psakhye SG, Turk B, Vasiljeva O, Nat. Nanotech 2011, 6, 594. [DOI] [PubMed] [Google Scholar]
- [6].Nasongkla N, Bey E, Ren J, Ai H, Khemtong C, Guthi JS, Chin S-F, Sherry AD, Boothman DA, Gao J, Nano Lett 2006, 6, 2427–2430. [DOI] [PubMed] [Google Scholar]
- [7].Hayashi K, Sakamoto W, Yogo T, Adv, Funct. Mater 2016, 26, 1708–1718. [Google Scholar]
- [8].Wu C, Xu Y, Yang L, Wu J, Zhu W, Li D, Cheng Z, Xia C, Guo Y, Gong Q, Song B, Ai H, Adv, Funct. Mater 2015, 25, 3581–3591. [Google Scholar]
- [9].Yuan H, Xu C, Zhao Y, Yu B, Cheng G, Xu FJ, Adv, Funct. Mater 2016, 26, 2855–2865. [Google Scholar]
- [10].Na HB, Song IC, Hyeon T, Adv. Mater 2009, 21, 2133–2148. [Google Scholar]
- [11].Chen R, Ling D, Zhao L, Wang S, Liu Y, Bai R, Baik S, Zhao Y, Chen C, Hyeon T, ACS Nano 2015, 9, 12425–12435. [DOI] [PubMed] [Google Scholar]
- [12].Santra S, Jativa SD, Kaittanis C, Normand G, Grimm J, Perez JM, ACS Nano 2012, 6, 7281–7294. [DOI] [PMC free article] [PubMed] [Google Scholar]
- [13].Ke K, Yang W, Xie X, Liu R, Wang L-L, Lin W-W, Huang G, Lu C-H, Yang H-H, Theranostics 2017, 7, 4763. [DOI] [PMC free article] [PubMed] [Google Scholar]
- [14].Pan D, Schmieder AH, Wickline SA, Lanza GM, Tetrahedron 2011, 67, 8431–8444. [DOI] [PMC free article] [PubMed] [Google Scholar]
- [15].Bock NA, Paiva FF, Silva AC, NMR Biomed 2008, 21, 473–478. [DOI] [PMC free article] [PubMed] [Google Scholar]
- [16].Bennewitz MF, Lobo TL, Nkansah MK, Ulas G, Brudvig GW, Shapiro EM, ACS Nano 2011, 5, 3438–3446. [DOI] [PMC free article] [PubMed] [Google Scholar]
- [17].Frangville C, Li Y, Billotey C, Talham DR, Taleb J, Roux P, Marty J-D, Mingotaud C, Nano Lett 2016, 16, 4069–4073. [DOI] [PubMed] [Google Scholar]
- [18].Liang X, Li Y, Li X, Jing L, Deng Z, Yue X, Li C, Dai Z, Adv, Funct. Mater 2015, 25, 1451–1462. [Google Scholar]
- [19].Wang Z, Qiao R, Tang N, Lu Z, Wang H, Zhang Z, Xue X, Huang Z, Zhang S, Zhang G, Li Y, Biomaterials 2017, 127, 25–35. [DOI] [PMC free article] [PubMed] [Google Scholar]
- [20].Wang Z, Zhu J, Chen Y, Geng K, Qian N, Cheng L, Lu Z, Pan Y, Guo L, Li Y, Gu H, RSC Adv 2014, 4, 7483–7490. [Google Scholar]
- [21].Huang J, Bu L, Xie J, Chen K, Cheng Z, Li X, Chen X, ACS Nano 2010, 4, 7151–7160. [DOI] [PMC free article] [PubMed] [Google Scholar]
- [22].Li L, Fu S, Chen C, Wang X, Fu C, Wang S, Guo W, Yu X, Zhang X, Liu Z, Qiu J, Liu H, ACS Nano 2016, 10, 7094–7105. [DOI] [PubMed] [Google Scholar]
- [23].Yang Y, Liu J, Liang C, Feng L, Fu T, Dong Z, Chao Y, Li Y, Lu G, Chen M, Liu Z, ACS Nano 2016, 10, 2774–2781. [DOI] [PubMed] [Google Scholar]
- [24].Cai Y, Liang P, Tang Q, Si W, Chen P, Zhang Q, Dong X, ACS Appl. Mater. Inter 2017, 9, 30398–30405. [DOI] [PubMed] [Google Scholar]
- [25].Topete A, Alatorre-Meda M, Iglesias P, Villar-Alvarez EM, Barbosa S, Costoya JA, Taboada P, Mosquera V, ACS Nano 2014, 8, 2725–2738. [DOI] [PubMed] [Google Scholar]
- [26].Deng L, Cai X, Sheng D, Yang Y, Strohm EM, Wang Z, Ran H, Wang D, Zheng Y, Li P, Ultrasound Med. Biol 2017, 43, S5. [Google Scholar]
- [27].Chang Y, Yang K, Wei P, Huang S, Pei Y, Zhao W, Pei Z, Angew. Chem. Int. Ed 2014, 53, 13126–13130. [DOI] [PubMed] [Google Scholar]
- [28].Kong F, Liang Z, Luan D, Liu X, Xu K, Tang B, Anal. Chem 2016, 88, 6450–6456. [DOI] [PubMed] [Google Scholar]
- [29].Li J, Liu F, Shao Q, Min Y, Costa M, Yeow EKL, Xing B, Adv. Healthc. Mater 2014, 3, 1230–1239. [DOI] [PubMed] [Google Scholar]
- [30].Lowik DWPM, Leunissen EHP, van den Heuvel M, Hansen MB, van Hest JCM, Chem. Soc. Rev 2010, 39, 3394–3412. [DOI] [PubMed] [Google Scholar]
- [31].Zhu Y-J, Chen F, Chem. Asian J 2015, 10, 284–305. [DOI] [PubMed] [Google Scholar]
- [32].Xue X, Jin S, Zhang C, Yang K, Huo S, Chen F, Zou G, Liang X-J, ACS Nano 2015, 9, 2729–2739. [DOI] [PubMed] [Google Scholar]
- [33].Lu J, Owen SC, Shoichet MS, Macromolecules 2011, 44, 6002–6008. [DOI] [PMC free article] [PubMed] [Google Scholar]
- [34].Savic R, Azzam T, Eisenberg A, Maysinger D, Langmuir 2006, 22, 3570–3578. [DOI] [PubMed] [Google Scholar]
- [35].Li Y, Xiao W, Xiao K, Berti L, Luo J, Tseng HP, Fung G, Lam KS, Angew. Chem. Int. Ed 2012, 124, 2918–2923 [DOI] [PMC free article] [PubMed] [Google Scholar]
- [36].Chen H, Kim S, He W, Wang H, Low PS, Park K, Cheng JX, Langmuir 2008, 24, 5213–5217. [DOI] [PubMed] [Google Scholar]
- [37].Park K, Chen HT, Kim SW, Li L, Wang SY, Cheng JX, P. Natl. Acad. Sci. USA 2008, 105, 6596–6601. [DOI] [PMC free article] [PubMed] [Google Scholar]
- [38].Li Y, Budamagunta MS, Luo J, Xiao W, Voss JC, Lam KS, ACS Nano 2012, 6, 9485–9495. [DOI] [PMC free article] [PubMed] [Google Scholar]
- [39].You J, Zhang R, Xiong C, Zhong M, Melancon M, Gupta S, Nick AM, Sood AK, Li C, Cancer Res 2012, 72, 4777–4786. [DOI] [PMC free article] [PubMed] [Google Scholar]
- [40].Kaittanis C, Shaffer TM, Ogirala A, Santra S, Perez JM, Chiosis G, Li Y, Josephson L, Grimm J, Nat. Commun 2014, 5, 3384. [DOI] [PMC free article] [PubMed] [Google Scholar]
- [41].Dong Z, Feng L, Zhu W, Sun X, Gao M, Zhao H, Chao Y, Liu Z, Biomaterials 2016, 110, 60–70. [DOI] [PubMed] [Google Scholar]
- [42].Viglianti BL, Abraham SA, Michelich CR, Yarmolenko PS, MacFall JR, Bally MB, Dewhirst MW, Magn. Reson. Med 2004, 51, 1153–1162. [DOI] [PubMed] [Google Scholar]
- [43].Tagami T, Foltz WD, Ernsting MJ, Lee CM, Tannock IF, May JP, Li S-D, Biomaterials 2011, 32, 6570–6578. [DOI] [PubMed] [Google Scholar]
- [44].Mäder K, Bacic G, Domb A, Elmalak O, Langer R, Swartz HM, J. Pharm. Sci 1997, 86, 126–134. [DOI] [PubMed] [Google Scholar]
- [45].Li Y, Lin T.-y., Luo Y, Liu Q, Xiao W, Guo W, Lac D, Zhang H, Feng C, Wachsmann-Hogiu S, Walton JH, Cherry SR, Rowland DJ, Kukis D, Pan C, Lam KS, Nat. Commun 2014, 5, 4712. [DOI] [PMC free article] [PubMed] [Google Scholar]
- [46].Kato J, Li Y, Xiao K, Lee JS, Luo J, Tuscano JM, O’Donnell RT, Lam KS, Mol. Pharm 2012, 9, 1727–1735. [DOI] [PMC free article] [PubMed] [Google Scholar]
- [47].Xiao K, Li Y-P, Wang C, Ahmad S, Vu M, Kuma K, Cheng Y-Q, Lam KS, Biomaterials 2015, 67, 183–193. [DOI] [PMC free article] [PubMed] [Google Scholar]
- [48].Li Y, Xiao K, Luo J, Xiao W, Lee JS, Gonik AM, Kato J, Dong TA, Lam KS, Biomaterials 2011, 32, 6633–6645. [DOI] [PMC free article] [PubMed] [Google Scholar]
- [49].Koo AN, Lee HJ, Kim SE, Chang JH, Park C, Kim C, Park JH, Lee SC, Chem. Commun 2008, 6570–6572. [DOI] [PubMed]
- [50].Yuan Y, Ge S, Sun H, Dong X, Zhao H, An L, Zhang J, Wang J, Hu B, Liang G, ACS Nano 2015, 9, 5117–5124. [DOI] [PubMed] [Google Scholar]
- [51].Gao Z, Hou Y, Zeng J, Chen L, Liu C, Yang W, Gao M, Adv. Mater 2017, 29, 1701095. [DOI] [PubMed] [Google Scholar]
- [52].Laurent S, Forge D, Port M, Roch A, Robic C, Vander Elst L, Muller RN, Chem. Rev 2008, 108, 2064–2110. [DOI] [PubMed] [Google Scholar]
Associated Data
This section collects any data citations, data availability statements, or supplementary materials included in this article.


