Abstract
Purpose
To develop and implement a fully automated approach to intensity modulated radiation therapy (IMRT) treatment planning.
Method
The optimization algorithm is developed based on a hierarchical constrained optimization technique and is referred internally at our institution as expedited constrained hierarchical optimization (ECHO). Beamlet contributions to regions‐of‐interest are precomputed and captured in the influence matrix. Planning goals are of two classes: hard constraints that are strictly enforced from the first step (e.g., maximum dose to spinal cord), and desirable goals that are sequentially introduced in three constrained optimization problems (better planning target volume (PTV) coverage, lower organ at risk (OAR) doses, and smoother fluence map). After solving the optimization problems using external commercial optimization engines, the optimal fluence map is imported into an FDA‐approved treatment planning system (TPS) for leaf sequencing and accurate full dose calculation. The dose‐discrepancy between the optimization and TPS dose calculation is then calculated and incorporated into optimization by a novel dose correction loop technique using Lagrange multipliers. The correction loop incorporates the leaf sequencing and scattering effects into optimization to improve the plan quality and reduce the calculation time. The resultant optimal fluence map is again imported into TPS for leaf sequencing and final dose calculation for plan evaluation and delivery. The workflow is automated using application program interface (API) scripting, requiring user interaction solely to prepare the contours and beam arrangement prior to launching the ECHO plug‐in from the TPS. For each site, parameters and objective functions are chosen to represent clinical priorities. The first site chosen for clinical implementation was metastatic paraspinal lesions treated with stereotactic body radiotherapy (SBRT). As a first step, 75 ECHO paraspinal plans were generated retrospectively and compared with clinically treated plans generated by planners using VMAT (volumetric modulated arc therapy) with 4 to 6 partial arcs. Subsequently, clinical deployment began in April, 2017.
Results
In retrospective study, ECHO plans were found to be dosimetrically superior with respect to tumor coverage, plan conformity, and OAR sparing. For example, the average PTV D95%, cord and esophagus max doses, and Paddick Conformity Index were improved, respectively, by 1%, 6%, 14%, and 15%, at a negligible 3% cost of the average skin D10cc dose.
Conclusion
Hierarchical constrained optimization is a powerful and flexible tool for automated IMRT treatment planning. The dosimetric correction step accurately accounts for detailed dosimetric multileaf collimator and scattering effects. The system produces high‐quality, Pareto optimal plans and avoids the time‐consuming trial‐and‐error planning process.
Keywords: automated planning, hierarchical optimization, IMRT
1. Introduction
Radiotherapy seeks to deliver dose distributions that maximize the likelihood of cancer eradication while holding normal tissue damage, and the impact on the patient, to the lowest level possible. Despite advances, radiotherapy treatment planning is often, still, a complex, time‐consuming, and labor‐intensive task with the plan quality often being dependent on the planners' experiences and skills.1 Typically, the problem is formulated as a single objective function, itself composed of additive terms representing dosimetric quality of the target and normal tissue regions. This formulation, however, involves many weights that are commonly manipulated iteratively through graphical user interfaces. Extensive research has been devoted in the last decade to facilitate this trial‐and‐error process.2, 3, 4, 5, 6, 7, 8, 9, 10, 11, 12, 13, 14 More recently, techniques have been developed to address shortcomings of IMRT planning, including: (a) so‐called “knowledge‐based planning” (KBP),2, 3, 4, 5, 6 (b) multiple criteria optimization (MCO),7, 8 and (c) constrained hierarchical optimization (also known as prioritized optimization or lexicographic optimization).9, 10, 11, 12, 15
The main idea in KBP is to extract a prediction model of appropriate planning goals from a database of previously planned patients. Using a database of the treated patients, KBP builds a model to map the patients' geometry onto the expected final DVH. The expected DVH is used to formulate the planning optimization problem on the new patient's geometry. MCO, in contrast, generates a pool of Pareto optimal plans based on a small number of key clinical objectives that require a trade‐off. A user then navigates among the Pareto plans, selecting a preferred plan.
Constrained hierarchical optimization (also called prioritized optimization or lexicographic optimization) is a classic optimization technique used to tackle many complex multicriteria optimization problems, and its applicability in radiotherapy optimization has been introduced in Deasy.16, 17 The key idea is to define the inviolable clinical criteria as hard constraints and then prioritize desirable clinical objectives and optimize them in order. Later, Wilkens et al.10 and Clark et al.11 have proposed their four‐step optimization models to maximize tumor coverage, minimize the high priority OARs doses, minimize the rest of OARs doses, and smooth out the fluence map respectively. The four‐step proposed models have been evaluated on six head‐and‐neck10 and 10 prostate11 cases, but without comparison to the clinical plans. Similar approaches have been also proposed.9, 18, 19 While this work, called ECHO (Expedited Constrained Hierarchical Optimization), is also based on constrained hierarchical optimization, it has some significant differences with the previous works, including: one‐fewer steps (three steps) and no need for a predefined prioritization of the OARs, two‐a novel correction step to provide the plan quality and planning time needed for the clinical implementation, three‐clinical validation by comparing to the 75 treated paraspinal plans, and four‐a fully automated push‐button clinical workflow using API scripting capabilities of an FDA‐approved TPS.
The ECHO approach consists of three constrained optimization steps plus an additional correction step. In Step‐1, ECHO seeks for the best possible target coverage/homogeneity over the reduced search space defined by the hard constraints. Step‐2 seeks for the further improvement of clinical criteria, beyond the clinical requirements expressed as hard constraints, searching over an even smaller search space. Step‐3 smooths out the fluence map for delivery efficiency. We have decided to put all the OARs in one step since their priorities are not very clear in clinic, and on the other hand, the further improvement in OARs doses is not very sensitive to the order that they have been optimized or the weights or the objective functions that they are assigned to at Step‐2 due to the reduced search space imposed by the hard constraints and the constraints added to preserve the results of Step‐1. ECHO is also equipped with a correction step (Step‐C) to incorporate leaf sequencing and scattering contributions into optimization. Step‐C speeds up the optimization process by ignoring scattering contributions initially and correcting them subsequently. It can also speed up the pre‐calculation of the influence matrix (the dose matrix used in the optimization) by initially employing a fast and less accurate dose calculation algorithm and correcting the inaccuracies afterwards. The correction step also improves the plan quality by incorporating the leaf motion impacts into optimization.
A different flavor of constrained hierarchical optimization, named 2‐phase .‐constrained (), has been proposed in Breedveld et al.12 This approach is based on the so‐called wish‐list prescription which contains a set of hard constraints and, for each organ, one‐an objective function, two‐a goal, and 3‐ a priority level. The objective functions are optimized sequentially based on their priorities in two phases where the first phase tries to meet the pre‐specified goals, if possible, and the second phase seeks for the further possible improvement. technique has been later extended to include the beam angle optimization and referred thereafter to as iCycle and has been subsequently evaluated on different disease sites.20, 21 While both ECHO and iCycle solve a series of constrained optimization problems sequentially, they are fairly different techniques. iCycle typically includes 5–10 steps which are solved in two phases whereas ECHO has three steps and does not involve any prioritization of the OARs.
On the implementation side, this work shows how a home‐grown optimization technique can become part of the clinical workflow using API scripting. To the best of our knowledge, this is the first work that creates automated plans without employing a TPS optimization engine and by fully integrating a home‐grown optimization technique with a FDA‐approved TPS system using API scripting. Furthermore, we retrospectively evaluate ECHO on 75 SBRT paraspinal plans and compare the fully automated ECHO plans with the manually created plans used to treat the patients. The patient cohort represents a diverse set of SBRT paraspinal plans with tumor located in different spine regions and includes a set of clinically challenging re‐irradiation plans.
2. Materials and methods
2.A. Hierarchical optimization model: a high‐level description
We solve three constrained optimization problems plus an optimization problem to incorporate the leaf sequencing and final dose calculations. Figure 1 illustrates the optimization steps as well as the high‐level description of the objective functions and constraints. At the first step (Step‐1), PTV coverage is maximized in the objective function given the maximum and mean dose hard constraints on OARs and PTV. The results obtained at Step‐1 are preserved by converting the objective function into a constraint (or a set of constraints) for Step‐2 with a slight relaxation or “slip” parameter to increase the search space in subsequent optimization steps. At the second step (Step‐2), the OAR doses are minimized subject to maximum and mean dose hard constraints of Step‐1 plus the constraints added to preserve the results of Step‐1. The results of Step‐2 are also converted into constraints for Step‐3 which smooths out the fluence map for delivery efficiency while respecting the hard constraints and the constraints that preserve the results of steps 1 and 2. After solving Step‐3, the optimal fluence is used for leaf sequencing and accurate full dose calculation.
Figure 1.
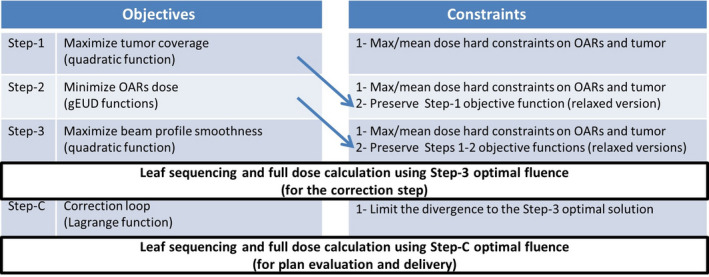
A high‐level description of the hierarchical optimization steps. Arrows indicate how the optimization results from one step are carried over to the next. [Color figure can be viewed at wileyonlinelibrary.com]
2.A.1. Correction step
After performing leaf sequencing and accurate full dose calculation using the Step‐3 optimized fluence map, there is usually a discrepancy between the final dose and pre‐calculated dose used during optimization. The pre‐calculated dose is obtained by multiplying the pre‐calculated influence matrix, parameterizing the dose contribution to each voxel from each beamlet of unit intensity, with a vector consisting of the fluence map. The dose‐discrepancy may stem from three different sources: one‐the effects of leaf sequencing, two‐ using the truncated influence matrix for optimization speed‐up, and three‐ employing a fast and less accurate influence matrix calculation to accelerate the pre‐calculation process (not the case in our implementation due to the Eclipse V15.5 API limitations). The dose‐discrepancy issue is already well‐known in the conventional weighted‐sum method and is usually handled by periodically performing a full dose calculation during the iterative optimization process and incorporating the discrepancy into the optimization.22 However, this is not straightforward with the constrained hierarchical optimization approach since updating the dose values could invalidate the constraints added from the previous steps and could make the problem even infeasible (i.e., empty search space). Therefore, all the three steps, with the dose‐discrepancy incorporated, need to be solved yet again. We propose a more computationally efficient approach which needs solving only one simple optimization problem by exploiting the Lagrange multipliers.
The Lagrange counterpart of the Step‐3 optimization problem is constructed by multiplying each constraint by its Lagrange multiplier and adding it to the objective function. Step‐3 and its Lagrange counterpart are equivalent and have the same optimal solution. The Lagrange problem in fact represents the entire three steps of optimization problems and can still be used as a good approximation of all three steps as long as small changes occur in the system (e.g., adding small dose discrepancy ). The Lagrange counterpart is then modified slightly to take into account the dose‐discrepancy in order to correct for it. As shown in Fig. 1, the correction step (Step‐C) is solved after performing leaf sequencing and full dose calculation using the Step‐3 optimized fluence map. Given that the dose‐discrepancy depends on the optimized fluence map, a hard constraint is added to Step‐C to limit the fluence map search space to the vicinity of the Step‐3 optimal solution. More details about Step‐C are provided in Section 2.B.
The Lagrange function has been also used by Alber et al.23 for sensitivity analysis purposes. Breedveld et al.12 studied the equivalence between the constrained hierarchical optimization and the weighted‐sum method using the Lagrange multipliers and they have later employed the Lagrange function for beam angle selection.24
2.B. Hierarchical optimization model: mathematical formulation
For modeling purposes, the patient's body is discretized into voxels (or point clouds) and each beam is discretized into beamlets. The dose delivered to each voxel from each beamlet of unit intensity is pre‐calculated and stored as a matrix called the influence matrix (also known as the dose deposition matrix), denoted by , where the rows and columns correspond to the voxels and beamlets respectively. The optimization variables are the beamlet intensities, denoted by . Table 1 provides a full description of the notations used in the optimization problems, and Fig. 2 provides the mathematical formulation of all the steps. In Step‐1, the deviation of the dose delivered to the PTV from the prescription dose is minimized in the objective function. The maximum and mean dose constraints on the relevant structures are enforced as hard constraints (1.a and 1.b). The non‐negativity of the fluence map is guaranteed by (1.c).
Table 1.
Notation glossary.
| Symbol | Description | Symbol | Description | ||
|---|---|---|---|---|---|
|
|
Fluence map |
|
Beam indices | ||
|
|
Prescription dose |
|
The beamlet index of the right/lower neighbor of beamlet | ||
|
|
Influence matrix |
|
Beamlet indices of beam | ||
|
|
Structure index |
|
Constraint indices | ||
|
|
Influence matrix corresponding to structure |
|
Lagrange multiplier of constraint | ||
|
|
Maximum dose limit for structure |
|
Constraint of Step‐3 | ||
|
|
Mean dose limit for structure |
|
The discrepancy between the dose from Step‐3 and final dose calculation | ||
|
|
Step‐1, 2, 3 optimal solution |
|
Second norm | ||
|
|
gEUD parameter for structure |
|
Correction step search space constraint | ||
|
|
|
||||
|
|
Slip parameter for structure | ||||
|
|
Smoothing weight: in the leaf motion direction X, in the Y direction |
Figure 2.

Mathematical formulation of the optimization problems.
In Step‐2, the (generalized equivalent uniform dose) function is used to minimize the dose at OARs (see the definition of at Step‐2 optimization problem). For each structure, an appropriate input parameter is selected based on the clinical criteria (e.g., = 1 or 2 for parallel structures and = 10 for serial structures). Besides the maximum and mean dose hard constraints (2.a, 2.b), constraints (2.c) and (2.d) are accompanied to preserve the results of Step‐1 while allowing slight relaxation using a slip parameter . Constraint (2.c) preserves the PTV dose homogeneity (over‐dose) while constraint (2.d) preserves the coverage (under‐dose) for different parts of the PTV (GTV (gross tumor volume), CTV (clinical target volume), PTV‐minus‐CTV, CTV‐minus‐GTV).
The Step‐3 optimization problem smooths out the fluence map using some total variation metrics. The first term in the objective function minimizes the total variation in the direction (leaf movement direction) and the second term accounts for the direction. Given that the smoothness in the leaf motion direction is more important, we therefore set (w 1 = 0.6, w2 = 0.4 in our implementation). Constraint (3.e) is added to preserve the results of Step‐2 and constraints (3.c) and (3.d) preserve the results of Step‐1 with further relaxation () to provide sufficient search space for Step‐3 improvement.
After solving Step‐3, the optimal fluence map is used for leaf sequencing and full dose calculation. The discrepancy () between the pre‐calculated dose from optimization () and final dose calculation is computed and the Step‐C optimization problem is solved. The Step‐C objective function is the Lagrange function of Step‐3 with the dose value () replaced by (). The Lagrange function is obtained by multiplying the Step‐3 constraints () by their Lagrange multipliers () and then adding them to the objective function ().25 Constraint (C.1) is added to limit the search space to the vicinity of so that is still a valid dose‐discrepancy ( in our implementation). Solving the Step‐C optimization problem is computationally easier than Step‐3 since the constraints are moved into the objective function. It should be noted that simple constraints like (C.2) can stay as constraints instead of moving them into the objective function.
2.C. Automated clinical workflow using Eclipse API scripting
With the recent API scripting capabilities, custom‐built algorithms can be integrated into commercial TPS and become part of the clinical workflow. We use Eclipse API scripting to retrieve the patient data needed for optimization and to import the optimization results (i.e., beam optimal fluence) back into Eclipse. Figure 3 illustrates our system design and data workflow. Once structure contours and beam angles are prepared, the user launches ECHO as a plug‐in from Eclipse TPS and selects the desired structures to be included in the optimization. The API is then used to retrieve the patient data needed for optimization (e.g., beam parameters, influence matrix) from the TPS. Afterwards, the resultant optimization problems (Steps 1 to 3) are solved using the commercial optimization engines Artelys KNITROTM (Artelys Corp., Chicago, IL) and AMPLTM (AMPL Optimization Inc., Evanston, IL). KNITRO is the main optimization solver and AMPL is a high‐level programming language which facilitates working with different solvers including KNITRO. Step‐3 optimal fluence is imported back into the TPS for leaf sequencing and accurate full dose calculation using Analytical Anisotropic Algorithm (AAA)26 dose calculation algorithm (a convolution/superposition technique) to find the discrepancy between the dose from optimization and full dose calculation. The optimization problem corresponding to the correction step (Step‐C) is then solved to correct the dose‐discrepancy. The resultant optimal fluence map (Step‐C) is imported back into the TPS for leaf sequencing and final AAA dose calculation for plan evaluation and treatment. Finally, a notification email is sent to the user that the plan is ready for review. The entire aforementioned workflow is automated using API scripting, requiring user interaction solely to prepare the contours and beam arrangement prior to launching the ECHO plug‐in.
Figure 3.
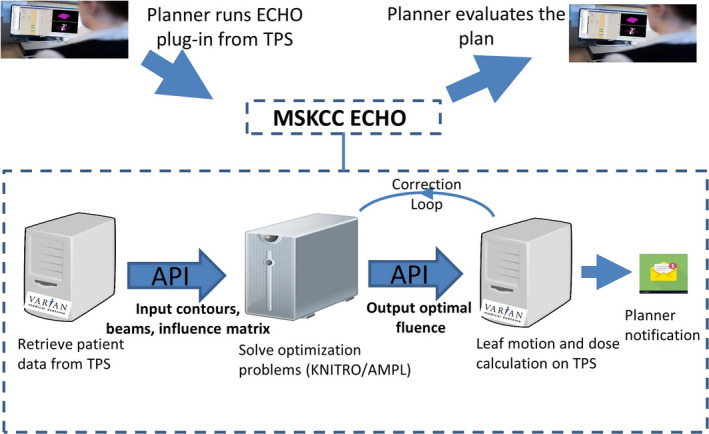
Automated workflow using Eclipse application program interface (API) scripting. [Color figure can be viewed at wileyonlinelibrary.com]
3. Results
We used the ECHO Eclipse plug‐in to retrospectively evaluate 63 paraspinal patients (with 75 plans) that were previously treated with planner‐generated VMAT SBRT plans. We created 75 automated ECHO IMRT plans for SBRT paraspinal patients with three different prescription/fractionation scenarios (25 plans each): 24 Gy in single fraction, 27 Gy in three fractions, and 27 Gy in three fractions (for re‐irradiation scenarios). Most of the optimization parameters (PTV prescription value , OAR max/mean dose constraints , gEUD input parameters ) are defined based on the clinical criteria, and other parameters (relaxation parameters , Step‐3 smoothing weights , Step‐C Epsilon value ) are defined empirically. Prior to the evaluation study, we used six plans (24 Gy in single fraction) covering lesions in various parts of the spine as our training data set to define the empirical optimization parameters most appropriate for paraspinal plans. Those parameters are then used for all 75 plans. Nine fixed IMRT fields were used for all ECHO plans. For thoracic, lumbar and sacral spine tumors, the fields were from the posterior direction at 20° gantry angle interval for 160° total span based on a plan template. For cervical spine cases, the template has seven posterior beams and two anterior oblique beams to avoid going through the shoulder. The planners' clinical plans used four to six partial arcs, with arc spans similar to the IMRT fields' span. While all the manual and automated plans meet the institutional clinical criteria, ECHO plans are superior in terms of both tumor coverage and OAR sparing for most cases. Figure 4 compares the automated ECHO plans against the manually created clinical plans quantitatively with respect to target coverage, dose conformity, and OAR sparing. The blue boxes (left) represent the ECHO plans and the orange boxes (right) represent the manual plans. Plot (a) and (b) compare PTV V95% and CTV V100% respectively, and ECHO plans clearly provide better coverage for all three prescription scenarios. Plot (c) compares Paddick Conformity Index27 defined as:
where is the target volume covered by prescription isodose volume, is the target volume, and is the prescription isodose volume. Plot (c) reveals that ECHO plans are also superior in terms of conformity. With respect to OAR sparing, plots (d), (e), and (f) illustrate that ECHO plans deliver less maximum dose to esophagus and cord and slightly more radiation to skin D10cc.
Figure 4.
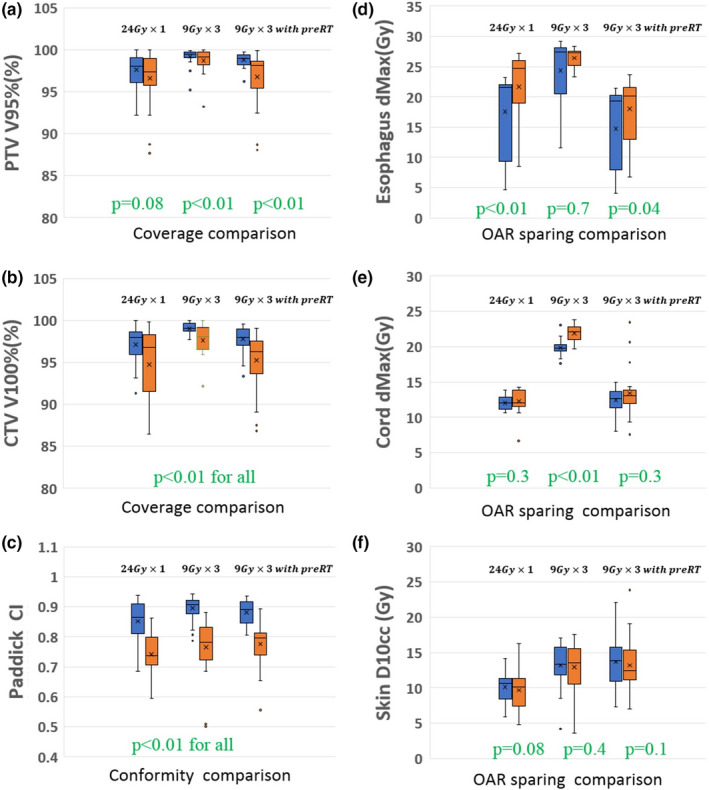
Comparison of the automated ECHO plans (blue bars, left) and the manually created plans (orange bars, right) for 75 SBRT paraspinal plans with three different prescription/fractionation schemes (25 plans per scheme). The higher the value the better for the coverage and conformity comparisons in the left plots, and the lower the value the better for the OAR sparing comparisons in the right plots. For statistical tests, Wilcoxon signed‐rank test was used and P = 0.05 was considered as statistical significance. [Color figure can be viewed at wileyonlinelibrary.com]
Figure 5 compares all 25 ECHO plans side‐by‐side with their corresponding manual plans for the patients receiving 24 Gy prescription in single fraction. The median PTV size is 43.8 cc (range: 14.9–188.3 cc). The positive relative difference in OAR dose means ECHO delivers less dose to OAR. As it can be seen, the trend is in favor of ECHO in terms of target coverage, plan conformality and OAR sparing. For the first plan, with manual plan being significantly superior to the ECHO plan in terms of the cord max dose, it should be noted that the cord dose for this patient is way below the clinical threshold for both plans and in fact the lowest among all 25 plans.
Figure 5.
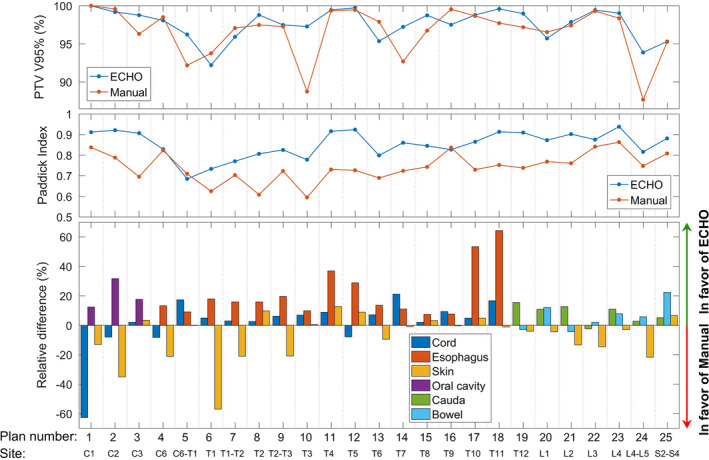
Side‐by‐side comparison of the automated ECHO plans and the manually created plans for all 25 stereotactic body radiotheraphy (SBRT) paraspinal plans with 24 Gy prescription in single fraction and tumor located on different spine regions from C1 to S4. [Color figure can be viewed at wileyonlinelibrary.com]
Two experienced physicists (Hong and Zhou) compared dose distributions and dose metrics of all 75 ECHO and manual plans and confirmed that the automated plans are always superior or at least comparable to the manual plans (non‐blinded comparison). ECHO plans specially found to be more conformal. For instance, one of the desired established clinical criteria at our institution is to have the hot spot (dose more than 115% of the prescription) to be inside the PTV, if existing at all, and 93% of all 75 ECHO plans met this criterion whereas only 51% of the manual plans did so.
Figure 6 shows an ECHO plan and a manual plan in terms of DVH and dose distribution. Plots (a), (b), and (c) illustrate that ECHO delivers comparable or more conformal dose distribution than the manual plan. Plots (d) shows that ECHO delivers less doses to the cord and esophagus while providing the same PTV coverage and compromising PTV dose homogeneity slightly.
Figure 6.
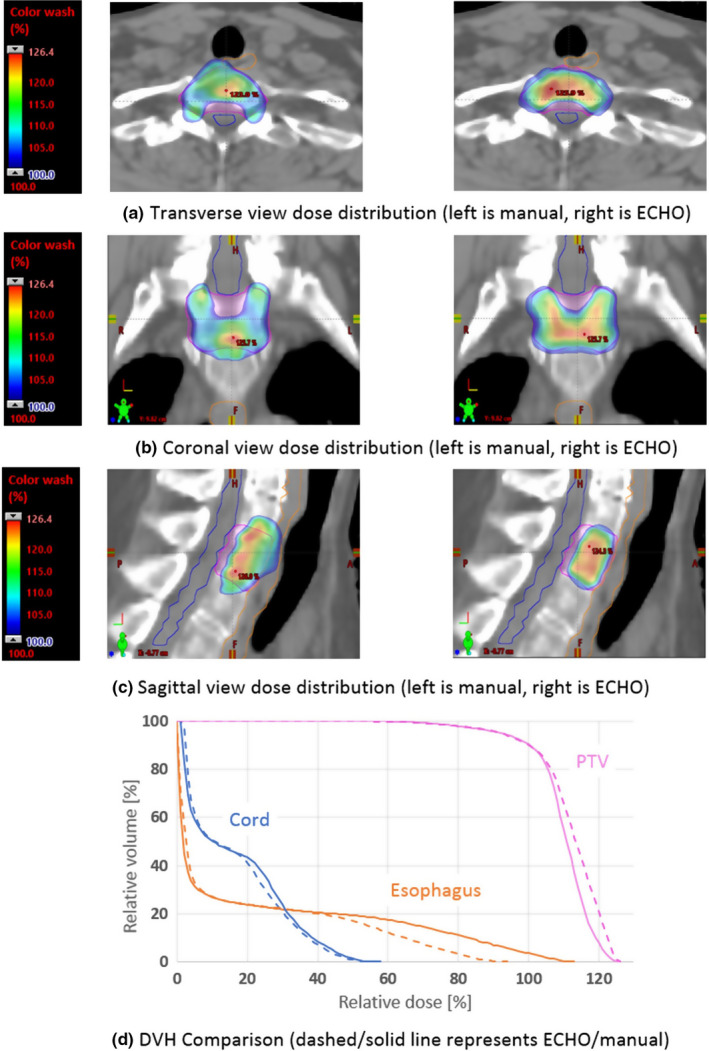
DVH and dose distribution comparison of an automated ECHO plan and a manually created plan. [Color figure can be viewed at wileyonlinelibrary.com]
Figure 7 reveals how the correction step (Step‐C) improves the plan quality by incorporating the leaf sequencing and final dose calculation impacts. Step‐C plan (dashed line) is obviously better than Step‐3 plan (solid line) in terms of both PTV dose homogeneity and OAR sparing.
Figure 7.
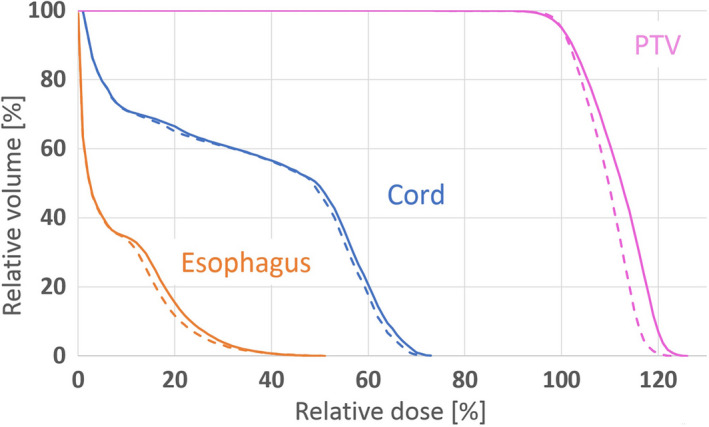
DVH comparison to illustrate the importance of the correction loop step (Step‐C). The solid/dashed line represents the plan before/after the correction step. Both plans are after leaf‐sequencing and final dose calculation. [Color figure can be viewed at wileyonlinelibrary.com]
Figure 8(a) shows the duty cycles (total monitor units of all beams divided by the prescription dose per fraction in cGy) of ECHO plans and it reveals that the patients with previous treatment have the highest duty cycles due to the high dose‐gradient required to achieve much lower dose constraints on the previously treated OARs; however, all the duty cycles are within the acceptable range in our institute. To assure the deliverability of the plans, 14 randomly selected plans (eight from , three from without previous radiation, and three from 9 with previous radiation) were delivered and went through rigorous quality assurance (QA) process and passed all our departmental QA procedures.
Figure 8.

(a) Duty cycle of ECHO plans. (b) Total time to create ECHO plans. (c) Time dedicated to different parts of automated ECHO plan calculation. [Color figure can be viewed at wileyonlinelibrary.com]
Figure 8(b) shows the elapsed time to generate fluences for all 75 ECHO plans: from launching the ECHO process to receiving an email notification that plan is ready. On average it takes about an hour to create an ECHO plan on our computational platform (six Windows‐7 servers with Intel Xeon E5‐2680 2.5 GHz CPU 12 cores and 64 GB RAM). Figure 8(c) reveals that the most time‐consuming part of the calculation is the influence matrix calculation by the Eclipse V15.5 API (62% of the total time). The current version of API calculates the influence matrix by running a full AAA dose calculation for every beamlet, resulting in a dense matrix and slow calculation process. Our program then truncates the small elements of the matrix to zero for the optimization speed‐up. Solving optimization problems by KNITRO/AMPL takes about 26% of the time, and the remaining 12% is spent on other tasks (e.g., data transfer, importing the results back into Eclipse, dose calculation). The beamlet resolution of is used, resulting in about 1700–13 000 beamlets. Eclipse API point cloud is used for voxelization, resulting in about 65 000–200 000 points. Eclipse API point cloud creates a non‐uniform distribution of points where more points are placed on the boundary of the organs. The influence matrix calculation is a highly parallel task and can be distributed among the servers (six servers in our experience), but the optimization task runs on one server and cannot be distributed.
4. Discussion
We have implemented a beam fluence optimization algorithm, based on constrained hierarchical optimization technique, to automate IMRT treatment planning. The ECHO application is provided as an Eclipse API plug‐in that can be used in the clinic. ECHO has been implemented in our clinic since April 2017, resulting in approximately 1000 delivered SBRT plans up to Feb 2019. We retrospectively studied 75 paraspinal SBRT plans and demonstrated the ECHO's ability to generate superior or comparable plans compared to the manually created plans in a reasonable amount of time (20–170 min). For each disease site, the maximum and mean dose hard constraints and objective functions need to be defined based on the clinical criteria. Other optimization parameters (slip parameters , Step‐3 smoothing weights , Step‐C Epsilon value ) are defined empirically using a few patients as a training data set and then they could be used for all the patients. In our experience with paraspinal cases, we observed that the plan quality is not very sensitive to these empirical parameters and it was easy to find a set of parameters that work for all the patients; however, future study is needed to find out if these observations also hold true for other disease sites. If otherwise, one potential solution is to create multiple plans using different parameters, specially slip parameters, and then either have the program to pick the best plan based on some predefined clinical metrics or let the users to pick their preferred plan (similar to the MCO approach).
Results confirm that the dose correction step based on Lagrange multipliers improves the plan quality by incorporating the effects of leaf sequencing and scattering contributions. This procedure allows us to neglect scatter contributions, leading to a sparse influence matrix and avoiding an influence matrix that is dense and computationally prohibitive. Despite the success to date, this procedure may need to be evaluated for patients with large PTV volumes and larger scatter‐dose contributions than those considered here. It should be noted that the Eclipse V15.5 API used in this research only provides an accurate full‐scatter influence matrix which is truncated subsequently by our program to speed up the optimization process; however, the correction step in principle enables the use of a fast and less accurate influence matrix calculation technique.
Plan delivery efficiency objectives (i.e., fluence map smoothness) have been incorporated in our model in the Step‐3. The first two steps completely disregard the smoothness, allowing for highly modulated intensity fluence, whereas Step‐3 smooths out the fluence but compromising slightly the plan quality obtained from the previous steps. Although the plan delivery and smoothness are not guaranteed in this model, the degeneracy exists in the fluence map space (i.e., many fluence maps correspond to the same or very similar dose values) in conjunction with the enlarged search space provided by the slips seem to enable the smoothness required for the delivery. Yet, this potential issue can be mitigated by imposing the smoothness in all the steps through either adding a smoothness term to the objective functions12 or adding hard constraints, for instance, to bound the total variations of the fluence profiles. Finding the proper weights would be challenging with the former approach, while the computational time would increase with the latter one. In our institute, every patient with single fraction SBRT has patient specific dosimetry QA before treatment and all single fraction ECHO plans generated up‐to‐date in our clinic (>200 plans) passed the QA test. For all other hypofractionation SBRT patients, QA based on departmental clinical policies are performed and passed for all ECHO plans created thus far in our clinic (>800 plans).
This algorithm currently only supports maximum and mean dose hard constraints and does not support DVH (dose volume histogram) constraints directly, making it only suitable for disease sites with mainly max/mean dose constraints such as paraspinal and head and neck. Work to incorporate other DVH constraints is ongoing. Future research is also needed to extend this technique to VMAT or other emerging delivery technologies like 28 or SPORT29. Voet et al.30 have shown that the automated IMRT plan created by their technique can be used to guide the TPS VMAT optimization engine, presumably based on the weighted‐sum approach, to produce a VMAT plan with the similar dosimetric characteristics as the automated IMRT plan. However, a rigorous VMAT optimization algorithm for constrained hierarchical optimization technique is yet to be developed.
API scripting which is nowadays available in the major TPS systems is a powerful tool to streamline the clinical workflow and empower them with more automation. This work exemplifies how a home‐grown optimization technique can become part of the clinical workflow by exporting the data outside the TPS, conducting optimization, and importing the results back into the TPS without any user interactions. It should be mentioned; however, that API scripting is still a relatively new technology and may not support all the functionalities that may be needed. In our experience, we had to first transfer the patient data from the clinical Eclipse V15.5 to the non‐clinical Eclipse V15.5 and then conduct all the calculations due to the limited capabilities of API on the clinical version. Although this part is also automated in our program using the transfer tools provided by Varian (DB Daemon), it added more complexity to the implementation.
5. Conclusions
IMRT treatment planning is naturally formulated as a prioritized list of objectives, in order to control tradeoffs inherent in the optimization process. ECHO is a dosimetrically accurate and robust formulation of this concept. The constrained programming environment allows for robust control of beam smoothness as well. ECHO has now been extensively used in our clinic, with very good results, and is a promising and flexible platform for further IMRT plan developments, for example, robust optimization31 or outcome‐probability driven planning.
Acknowledgments
This work was partially supported by the MSK Cancer Center Support Grant/Core Grant (P30 CA008748), and the Enid A. Haupt Endowed Chair Fund. We would like to express our appreciation to the Artelys Corporation for the help and support they provided with their optimization engine KNITRO. We also thank two Varian Oncology Systems employees: Wayne Keranen, for helpful changes to the Varian research API, as well as Seppo Tuomaala, who provided routines for the efficient and accurate calculation of influence matrix as well as other useful API changes.
References
- 1. Deasy JO, Alaly JR, Zakaryan K. Obstacles and advances in intensity‐modulated radiation therapy treatment planning. In: Meyer JL, Kavanagh BD, Purdy JA, Timmerman R, eds. Frontiers of Radiation Therapy and Oncology. Basel: KARGER; 2007:42–58. [DOI] [PubMed] [Google Scholar]
- 2. Zarepisheh M, Long T, Li N, et al. A DVH‐guided IMRT optimization algorithm for automatic treatment planning and adaptive radiotherapy replanning. Med Phys. 2014;41:061711. [DOI] [PubMed] [Google Scholar]
- 3. Wang H, Dong P, Liu H, Xing L. Development of an autonomous treatment planning strategy for radiation therapy with effective use of population‐based prior data. Med Phys. 2017;44:389–396. [DOI] [PMC free article] [PubMed] [Google Scholar]
- 4. Wu B, Ricchetti F, Sanguineti G, et al. Data‐driven approach to generating achievable dose‐volume histogram objectives in intensity‐modulated radiotherapy planning. Int J Radiat Oncol Biol Phys. 2011;79:1241–1247. [DOI] [PubMed] [Google Scholar]
- 5. Chanyavanich V, Das SK, Lee WR, Lo JY. Knowledge‐based IMRT treatment planning for prostate cancer. Med Phys. 2011;38:2515–2522. [DOI] [PubMed] [Google Scholar]
- 6. Appenzoller LM, Michalski JM, Thorstad WL, Mutic S, Moore KL. Predicting dose‐volume histograms for organs‐at‐risk in IMRT planning. Med Phys. 2012;39:7446–7461. [DOI] [PubMed] [Google Scholar]
- 7. Craft D, Bortfeld T. How many plans are needed in an IMRT multi‐objective plan database? Phys Med Biol. 2008;53:2785–2796. [DOI] [PubMed] [Google Scholar]
- 8. Monz M, Küfer KH, Bortfeld TR, Thieke C. Pareto navigation—algorithmic foundation of interactive multi‐criteria IMRT planning. Phys Med Biol. 2008;53:985–998. [DOI] [PubMed] [Google Scholar]
- 9. Tiwari P. Automating Intensity Modulated Radiation Therapy Treatment Planning by using Hierarchical Optimization, Engineering and Applied Science Theses & Dissertations. Washington University in St. Louis. 2015. 10.7936/K7XW4H26 [DOI]
- 10. Wilkens JJ, Alaly JR, Zakarian K, Thorstad WL, Deasy JO. IMRT treatment planning based on prioritizing prescription goals. Phys Med Biol. 2007;52:1675–1692. [DOI] [PubMed] [Google Scholar]
- 11. Clark VH, Chen Y, Wilkens J, Alaly JR, Zakaryan K, Deasy JO. IMRT treatment planning for prostate cancer using prioritized prescription optimization and mean‐tail‐dose functions. Linear Algebra Appl. 2008;428:1345–1364. [DOI] [PMC free article] [PubMed] [Google Scholar]
- 12. Breedveld S, Storchi PRM, Heijmen BJM. The equivalence of multi‐criteria methods for radiotherapy plan optimization. Phys Med Biol. 2009;54:7199. [DOI] [PubMed] [Google Scholar]
- 13. Lee T, Hammad M, Chan TCY, Craig T, Sharpe MB. Predicting objective function weights from patient anatomy in prostate IMRT treatment planning. Med Phys. 2013;40:121706. [DOI] [PubMed] [Google Scholar]
- 14. Xing L, Li JG, Donaldson S, Le QT, Boyer AL. Optimization of importance factors in inverse planning. Phys Med Biol. 1999;44:2525–2536. [DOI] [PubMed] [Google Scholar]
- 15. Lin YH, Hong LX, Hunt MA, Berry SL. Use of a constrained hierarchical optimization dataset enhances knowledge‐based planning as a quality assurance tool for prostate bed irradiation. Med Phys. 2018;45:4364–4369. [DOI] [PMC free article] [PubMed] [Google Scholar]
- 16. Deasy JO. Prioritized treatment planning for radiotherapy optimization. In: Proceedings of World Congress on Medical Physics and Biomedical Engineering. (Chicago, 2000) CD‐ROM; 2000.
- 17. Deasy JO. The IMRT optimization problem statement. In: Procedings from the NCI‐NSF Sponsored Workshop on Operations Research Applications in Radiation Therapy (ORART). Washington, DC; 2002.
- 18. Jee K‐W, McShan DL, Fraass BA. Lexicographic ordering: intuitive multicriteria optimization for IMRT. Phys Med Biol. 2007;52:1845–1861. [DOI] [PubMed] [Google Scholar]
- 19. Falkinger M, Schell S, Müller J, Wilkens JJ. Prioritized optimization in intensity modulated proton therapy. Zeitschrift für Medizinische Physik. 2012;22:21–28. [DOI] [PubMed] [Google Scholar]
- 20. Voet PWJ, Dirkx MLP, Breedveld S, Fransen D, Levendag PC, Heijmen BJM. Toward fully automated multicriterial plan generation: a Prospective Clinical Study. Int J Radiat Oncol Biol Phys. 2012;85:866–872. [DOI] [PubMed] [Google Scholar]
- 21. Heijmen B, Voet P, Fransen D, et al. Fully automated, multi‐criterial planning for volumetric modulated arc therapy – an international multi‐center validation for prostate cancer. Radiother Oncol. 2018;128:343–348. [DOI] [PubMed] [Google Scholar]
- 22. Siebers JV, Lauterbach M, Tong S, Wu Q, Mohan R. Reducing dose calculation time for accurate iterative IMRT planning. Med Phys. 2002;29:231–237. [DOI] [PubMed] [Google Scholar]
- 23. Alber M, Birkner M, F.. N sslin, Tools for the analysis of dose optimization: II. Sensitivity analysis. Phys Med Biol. 2002;47:N265–N270. [DOI] [PubMed] [Google Scholar]
- 24. Breedveld S, Storchi PRM, Voet PWJ, Heijmen BJM. iCycle: Integrated, multicriterial beam angle, and profile optimization for generation of coplanar and noncoplanar IMRT plans. Med Phys. 2012;39:951–963. [DOI] [PubMed] [Google Scholar]
- 25. Boyd S, Vandenberghe L. Convex Optimization. Cambridge: Cambridge University Press; 2004. [Google Scholar]
- 26. Sievinen J, Ulmer W, Kaissl W. AAA Photon Dose Calculation Model in EclipseTM . Palo Alto (CA): Varian Medical Systems; 2005:1–18. [RAD #7170B].
- 27. Paddick I. A simple scoring ratio to index the conformity of radiosurgical treatment plans. J Neurosurg. 2000;93:219–222. [DOI] [PubMed] [Google Scholar]
- 28. Dong P, Lee P, Ruan D, et al. 4π noncoplanar stereotactic body radiation therapy for centrally located or larger lung tumors. Int J Radiat Oncol Biol Phys. 2013;86:407–413. [DOI] [PubMed] [Google Scholar]
- 29. Zarepisheh M, Li R, Ye Y, Xing L. Simultaneous beam sampling and aperture shape optimization for SPORT. Med Phys. 2015;42:1012–1022. [DOI] [PMC free article] [PubMed] [Google Scholar]
- 30. Voet PWJ, Dirkx MLP, Breedveld S, Al‐Mamgani A, Incrocci L, Heijmen BJM. Fully automated volumetric modulated arc therapy plan generation for prostate cancer patients. Int J Radiat Oncol Biol Phys. 2014;88:1175–1179. [DOI] [PubMed] [Google Scholar]
- 31. Xie Y. Applications of Nonlinear Optimization, Arts & Sciences Electronic Theses and Dissertations. Washington University in St. Louis; 2014. 10.7936/K76W987X [DOI]


