

SUMMARY
Approximately 30% of human lung cancers acquire mutations in either Keap1 or Nfe2l2, resulting in the stabilization of Nrf2, the Nfe2l2 gene product, which controls oxidative homeostasis. Here, we show that heme triggers the degradation of Bach1, a pro-metastatic transcription factor, by promoting its interaction with the ubiquitin ligase Fbxo22. Nrf2 accumulation in lung cancers causes the stabilization of Bach1 by inducing Ho1, the enzyme catabolizing heme. In mouse models of lung cancers, loss of Keap1 or Fbxo22 induces metastasis in a Bach1-dependent manner. Pharmacological inhibition of Ho1 suppresses metastasis in a Fbxo22-dependent manner. Human metastatic lung cancer display high levels of Ho1 and Bach1. Bach1 transcriptional signature is associated with poor survival and metastasis in lung cancer patients. We propose that Nrf2 activates a metastatic program by inhibiting the heme- and Fbxo22-mediated degradation of Bach1, and that Ho1 inhibitors represent an effective therapeutic strategy to prevent lung cancer metastasis.
eTOC blurb
Stabilization of the transcription factor Bach1 drives metastasis of lung adenocarcinoma and this can be counteracted by the pharmacological inhibition of heme oxygenase.
INTRODUCTION
Lung cancer is the leading cause of cancer-related death in the United States and worldwide (Bar et al., 2008). During lung tumorigenesis, cancer cells enhance their metabolic output, which, in turn, increases the production of reactive oxygen species (ROS). To maintain oxidative homeostasis, ~30% of non-small-cell lung cancer (NSCLCs) increase the transcription of antioxidant genes by acquiring either stabilizing mutations in Nfe2L2 (encoding Nrf2, the master transcriptional regulator of the cells antioxidant program) or by selecting for inactivating mutations in its negative regulator, Keap1 (Cancer Genome Atlas Research, 2014). Keap1 is a Cul3-dependent ubiquitin ligase (CRL3) that, in physiological conditions, constitutively targets Nrf2 for degradation (Rojo de la Vega et al., 2018). In response to oxidative stress, the Keap1-Nrf2 binding is inhibited and, consequently, Nrf2 is stabilized.
Metastasis is a major contributor to the mortality of cancer patients. Lung adenocarcinoma (LUAD), a NSCLC subtype, is a highly metastatic disease with approximately 22% of patients displaying local lymph node metastases and 57% distant metastases at the time of diagnosis (Brady et al., 2016; Caswell et al., 2014; Chuang et al., 2017). Keap1 mutations are associated with advanced stage IV metastatic disease and poor prognosis (Romero et al., 2017), suggesting a possible role for Keap1 loss role in the metastatic cascade.
The transcriptional regulator Bach1 (BTB domain and CNC homolog 1) functions as a molecular sensor of intracellular heme, tuning transcription to the fluctuation of heme levels (Ogawa et al., 2001; Sun et al., 2002). Heme plays a role in various biological reactions by interacting with many inactive apo-proteins to generate functional hemoproteins (Mense and Zhang, 2006). Most forms of oxidative stress elicit heme release from hemoproteins, leading to more oxidative stress as free heme catalyzes a massive production of free radicals (Gozzelino et al., 2010; Pamplona et al., 2007). Cells avoid the self-amplifying, pro-oxidant effects of free heme through a variety of mechanisms, particularly, via the rapid induction of heme oxygenase-1 (Ho1), which catabolizes free heme (Li and Stocker, 2009).
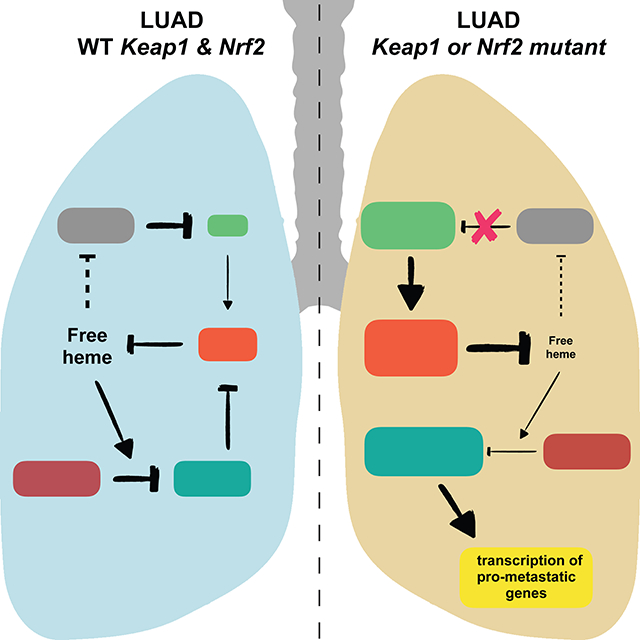
Bach1, together with Nrf2 and the Maf transcription factors, controls the expression of Ho1 and other antioxidant genes (Oyake et al., 1996; Sun et al., 2004). Bach1 dimerizes with Mafs to repress Maf-recognition elements. In response to oxidative stress, Nrf2 accumulates through Keap1 inactivation, and increased levels of free heme promotes the proteasome-dependent degradation of Bach1 (Zenke-Kawasaki et al., 2007). Nrf2, then, dimerizes with Mafs and induces the transcriptional activation of antioxidant target genes, including Ho1 (Tebay et al., 2015). Notably, in addition to its role in the Maf-Nrf2 pathway, Bach1 promotes invasion and metastasis by activating the transcription of critical metastatic genes (Lee et al., 2013; Liang et al., 2012; Yun et al., 2011).
We studied the molecular mechanisms by which accumulation of Nrf2 promotes metastasis in LUAD. The results of these studies are presented herein.
RESULTS
Keap1 loss promotes cell migration, metastasis, and activation of the Bach1 transcriptional program
To study the role of Keap1 mutations in metastasis, we utilized the KP GEMM in combination with a CRISPR/Cas9-based loss-of-function system (Romero et al., 2017; Sanchez-Rivera et al., 2014). KP mice that were intratracheally infected with pSECC lentiviral vectors expressing an sgRNA targeting Keap1 had significantly increased incidence of metastasis as compared to Keap1 wild-type (WT) control animals infected with a control sgRNA (sgTom, targeting tdTomato) (Figure 1A). To determine if the pro-metastatic effect of Keap1 loss was cell autonomous, we performed in vitro assays to measure cell migration properties of KP cells, which were generated from KP-derived lung tumor cells, and isogenic Keap1 knockout (KPK) cells (Romero et al., 2017). In both a transwell and a scratch assay, KPK cells displayed markedly higher cell migration ability compared to KP cells (Figure S1A–B). We next transplanted KP and KPK cells orthotopically into the lungs of syngeneic C57B6/J mice and assessed metastasis formation. KPK cells were more metastatic compared to KP controls without having a significant impact on survival at the time when the mice were sacrificed (Figures 1B and S1C–D). We also subcutaneously transplanted KP and KPK cells in nude mice. Mice implanted with KPK cells displayed significantly higher number of lung metastases compared to mice implanted with KP cells without affecting primary tumor mass (Figures 1C–D and S1E).
Figure 1. Keap1 loss promotes cell migration, metastasis, and activation of the Bach1 transcriptional program.

(A) Metastasis incidence (thoracic and lymph nodes) in sgTom and sgKeap1 KP mice (n= 9 and 8, respectively) at 21 weeks after infection with pSECC lentiviruses. </p/>(B) Metastasis incidence (thoracic and lymph nodes) upon intratracheal implantation of KPK or KP cells (n= 9 in each group) at moribund or 100 days after implantation.
(C) Quantification of lung metastasis at 4 weeks after subcutaneous (SQ) implantation of KPK or KP cells expressing GFP reporter (n= 7 in each group). Data are presented as means, and squares represent individual data points.
(D) Representative brightfield and GFP fluorescent images of lung metastasis from (C). </p/>(E) Upregulation of HCMDB genes in KPK v. KP cells.
(F) Upregulation of Bach1 transcriptional signature in KPK v. KP cells.
(G) A volcano plot comparing the expression of HCMDB genes and Bach1 targets genes between KPK and KP cells. Plotted for each transcript are the negative log10 of the p value and the log2 of the fold change of gene expression of KPK v. KP cells. The red bars represent fold change values of −/+2 and the yellow bar represents an FDR threshold of 5%. Circle data points represent non-metastatic transcripts (non-met); square data points represent metastatic transcripts (met); gray data points represent non-Bach1 target transcripts; green data points represent Bach1 target transcripts. FC, fold change.
(H) Correlation plot between protein and mRNA level changes in KPK v. KP cells. For each of 8,586 mRNA fold changes in KPK v. KP cells (x axis, Log2 scale) the associated protein fold change in KPK v. KP cells is plotted (y axis, Log2 scale). The Pearson correlation coefficient (R square) was 0.72. The yellow bars represent a fold change value of +2 for both mRNA and protein levels. Circle data points represent non-metastatic proteo-transcripts; square data points represent metastatic proteo-transcripts; gray data points represent non-Bach1 target proteo-transcripts; green data points represent Bach1 target proteo-transcripts. FC, fold change.
(I) Contingency tables demonstrating the correlation between Bach1 and Ho1 protein expression in IHC analyses of mutant-Keap1 v. WT Keap1 biopsies of human LUAD. Keap1 status was confirmed in all tumor samples by targeted exome sequencing. The graph shows the percentage of LUAD biopsies with low or high levels of Bach1 and Ho1. Bach1 and Ho1 levels increase in mutant-Keap1 v. WT Keap1 biopsies: p=0.0006 and p=0.0047 respectively. Right, representative IHC stainings. Scale bars, 100 μM for low magnification (10X) and 25 μM for high magnification (40X).
To investigate the cellular pathways promoting metastasis in Keap1 mutant cells, we performed RNA sequencing based transcriptional profiling of KP and KPK cells followed by Gene Set Enrichment Analysis (GSEA). To identify metastatic genes, we took advantage of the Human Cancer Metastasis Database (HCMDB) (Zheng et al., 2018). Our analysis showed a significant enrichment of metastatic genes in KPK compared to KP cells (Figure 1E and Table S1). We also investigated the transcriptional drivers that could induce the enrichment of metastatic genes. In line with previous observations (Malhotra et al., 2010), the Nrf2 signature was highly enriched in KPK compared to KP cells (Figure S1F and Table S2). However, the Bach1 signature had the highest enrichment score in KPK compared to KP cells (Figure 1F and Table S2), suggesting that the pro-metastatic transcription factor Bach1 could be a driver of the metastatic phenotype of Keap1 mutant cells.
Next, we analyzed both transcriptomic and proteomic differential expression profiles in KP and KPK cells. In all differential expression analyses, whether transcriptomic or proteomic, we applied a 5% FDR (False Discovery Rate) cutoff as well as a 2-fold change threshold. We detected a 2.31-, a 2.79-, and a 4.02-fold increase in metastatic transcripts, Bach1 transcriptional targets, and Bach1 targets that are implicated in metastasis, respectively (Figure 1G and Table S3). In parallel, we performed Tandem Mass Tags-based proteomic analysis in KPK compared to KP cells (Figures S1G–H). We detected a 2.13-, 2.81-, and a 4.5-fold increase in metastatic proteins, proteins encoded by Bach1 target genes, and metastatic proteins encoded by Bach1 target genes, respectively. Finally, we performed an integrative multi-omics analysis of the transcriptome and proteome of KP and KPK cells to obtain a high confidence set of pro-metastatic transcripts/proteins that are regulated by Bach1. We analyzed the differentially expressed proteo-transcripts in KPK compared to KP cells and detected a 2.25-, a 2.71-, and a 3.77-fold increase in metastatic proteo-transcripts, Bach1-regulated proteo-transcripts, and Bach1-regulated metastatic proteo-transcripts, respectively (Figure 1H). In the latter two cases, the enrichment was much more pronounced in the upregulated proteo-transcripts (3.47- and 4.6-fold increase) than in the downregulated ones (1.07- and 1.98-fold increase).
Next, we assessed whether the activation of the Bach1 signature corresponded to high levels of Bach1 protein in Keap1 mutant tumors. To this end, we stained (i) GEMM-derived KP and KPK tumors (from Figure 1A), (ii) LUAD patient-derived xenograft (PDX) tumors that were Keap1 WT or Keap1 mutant, and (iii) primary human LUAD tumors with WT or mutant Keap1 (Romero et al., 2017)]. In line with transcriptional and proteomic analysis of KP and KPK cells, we found that all tumors with mutations in Keap1 displayed higher levels of Bach1 compared to WT controls (Figures 1I and S1I–J).
Keap1 loss promotes Bach1 accumulation through the Nrf2-dependent induction of Ho1
The above data suggest that in Keap1 mutant cells Bach1 protein levels and transcriptional activity are increased. We investigated the molecular mechanisms behind the induction of Bach1 protein levels. First, we analyzed the protein levels of Bach1 in KP and KPK cells and found higher levels of Bach1 in KPK compared to KP cells (Figure 2A), in line with increased Bach1 levels in Keap1 mutant tumors (Figures 1I and S1I–J). Importantly, reconstitution of Keap1 expression in KPK cells reduced Bach1 expression to the same levels present in KP cells (Figure 2A). Moreover, Bach1 half-life was much longer in KPK than KP cells (Figure 2B), demonstrating that Keap1 loss results in the stabilization of Bach1. Treatment with either MG132 (a proteasome inhibitor) or MLN4924 (a CRL inhibitor) completely blocked Bach1’s decay, indicating that Bach1 degradation is regulated by the proteasome and one or more CRL complexes (Figure 2B). As Keap1 is a substrate receptor of a CRL3 ubiquitin ligase complex, we assessed the possibility that Bach1 could be a novel substrate of Keap1. Co-immunoprecipitation experiments showed that Keap1 co-immunoprecipitated with Nrf2 and Palb2 (Orthwein et al., 2015), two established substrates of Keap1, but not with Bach1 (Figure S2A). Similarly, Nrf2 could co-immunoprecipitate Keap1, but not Bach1 (Figure S2B). These results suggest that the augmented levels and stabilization of Bach1 in Keap1 mutant cells and tumors are not due to Bach1 being a substrate of Keap1.
Figure 2. Keap1 loss promotes Bach1 accumulation through Nrf2-dependent induction of Ho1.

(A) KP, KPK and Keap1-reconstituted KPK cells were lysed and immunoblotted as indicated. * denotes a nonspecific band. l.ex., long exposure; s.ex., short exposure.
(B) KP and KPK cells were treated with CHX, collected at the indicated times, lysed, and immunoblotted as indicated. KP and KPK cells were pretreated with either MG132 or MLN4924 30 minutes before CHX treatment. The graph shows the quantification of Bach1 protein levels. Values are presented as means ±SEM. l.ex., long exposure; s.ex., short exposure.
(C) KP-sgTom or 2 different KP-sgNrf2 clones were treated with Ki696, collected at the indicated times, lysed, and immunoblotted as indicated. * denotes a nonspecific band.
(D)KP cells were treated with Ki696 for the indicated times. Relative expression levels of Bach1 and Hmox1 genes were determined by qRT-PCR. Values are presented as means ±SD
(E) Two different KP-sgTom and KP-sgHo1 clones were treated with Ki696 for 3 hours, collected, lysed and immunoblotted as indicated.
(F) The experiment was performed as in (E), except that cells were treated with hemin for the indicated times.
Next, we asked if Bach1 accumulation could be driven by Nrf2 accumulation in response to Keap1 inactivation. To this end, we treated KP cells with Ki696, a small molecule inhibitor of the Keap1-Nrf2 interaction (Davies et al., 2016). As expected, Ki696 treatment led to Nrf2 accumulation as well as a rapid and robust accumulation of Bach1 protein levels with no change in mRNA levels (Figures 2C–D). These results combined with a prolonged half-life of Bach1 in KPK cells, indicate that Nrf2 accumulation leads to stabilization of Bach1 through a post-translational mechanism. Notably, in two independent clones of KP cells in which Nrf2 was deleted by CRISPR/Cas9 (Romero et al., 2017), Bach1 did not accumulate (Figure 2C), indicating that Bach1 stabilization is secondary to Nrf2 activation.
Free heme is a potent oxidative agent that directly binds Bach1 and promotes its proteasomal degradation (Zenke-Kawasaki et al., 2007). In response to stress, Nrf2 accumulates and activates the transcription of genes involved in heme catabolism, including Ho1, the enzyme that catalyzes the first and rate-limiting step in heme degradation (Sun et al., 2004). Thus, we investigated whether Nrf2 accumulation stabilizes Bach1 by inducing Ho1 transcription. As expected, Nrf2 activation by either loss of Keap1 or Ki696 treatment led to a robust increase of Ho1 both at the mRNA and protein levels (Figures 2A–D). Using two independent Ho1 knockout KP clones (Figure S2C), we observed that Ki696-mediated Nrf2 stabilization did not result in an increase of Bach1 (Figure 2E), indicating that the stabilization of Bach1 triggered by Nrf2 accumulation is likely due to enhanced Ho1-dependent degradation of heme. Moreover, the degradation of Bach1 induced by treatment with hemin (Fe3+ heme) was dramatically increased in Ho1 null cells compared to Ho1 WT cells (Figure 2F), likely because of the lack of Ho1-mediated degradation of hemin in Ho1 null cells. To further confirm these results, we treated KP and KPK cells with hemin in the presence or absence of TinPPIX (Tin Protoporphyrin IX), a selective inhibitor of Ho1 enzymatic activity (Morita et al., 1995). Similar to what we observed in Ho1 null cells, pharmacological inhibition of Ho1 led to accelerated Bach1 degradation (Figures S2D–E).
Next, we assessed Ho1 protein levels in primary human LUADs with WT or mutant Keap1. Human tumors with Keap1 mutations had both high levels of Bach1 and Ho1 as compared to Keap1 WT tumors (Figure 1I), demonstrating a positive correlation between levels of Ho1 and Bach1 in human LUAD, in agreement with our biochemical studies.
Together, these results strongly indicate that cancer cells with genetic or pharmacological activation of Nrf2 have increased Bach1 levels through an Ho1-dependent mechanism.
Fbxo22 mediates the heme-induced degradation of Bach1
To identify the ubiquitin ligase that mediates the heme-induced degradation of Bach1, we performed immunopurifications of Bach1 expressed in human HEK293T cells in the presence or absence of hemin, followed by mass spectrometry analysis. The Bach1 interactome showed nine substrate receptors of CRL complexes, as well as Skp1, an assembly factor of the CRL1 complex (Figure S3A). We ectopically expressed in HEK293T cells seven FLAG-tagged substrate receptors, as well as FLAG-tagged Hoil1, a ubiquitin ligase previously reported to target Bach1 for degradation (Zenke-Kawasaki et al., 2007). Immunoprecipitation of these proteins showed Fbxo22 as the most efficient and selective interactor of endogenous Bach1 (Figure 3A), in agreement with the highest number of Fbxo22-corresponding peptides in the mass spectrometry analysis (Figure S3A). The interaction between Bach1 and Fbxo22 was also confirmed at the endogenous levels (Figure 3B). Interestingly, Bach1 interacted more robustly with Fbxo22 in KP cells than in KPK cells, the latter having presumably less intracellular heme, due to the increased expression of Ho1. Accordingly, addition of hemin increased the binding between Bach1 and Fbxo22 (Figures 3B and S3A–B). These results suggest that heme induces the degradation of Bach1 by increasing its interaction with Fbxo22.
Figure 3. Fbxo22 mediates the heme-induced degradation of Bach1.

(A)HEK293T cells were transfected with either an empty vector (EV) or the indicated FLAG-tagged proteins. Twenty-four hours post-transfection, cells were treated with MG132 for 3 hours, collected for immunoprecipitation (IP) and immunoblotting. WCE, whole-cell extract.
(B)KP and KPK cells were treated with MLN4924 for 3 hours, collected for IP with either nonspecific IgG or with an antibody against Bach1, treated with hemin where indicated, and immunoblotted as indicated. l.ex., long exposure; s.ex., short exposure.
(C)A549 cells infected with lentiviruses expressing 2 different shRNAs targeting Fbxo22 (shFbxo22) under the control of a dox-inducible promoter were treated (where indicated) with dox for 24 hours. Cells were then treated with either CHX or hemin, collected at the indicated times, lysed, and immunoblotted as indicated. * denotes a nonspecific band.
(D)Two different KP-sgTom and KP-sgFbxo22 clones were treated with hemin, collected at the indicated times, lysed, and immunoblotted as indicated.
(E)HEK293T cells were transfected with either an EV or the indicated FLAG-tagged constructs. Twenty-four hours post-transfection, cells were treated with MLN4924 for 3 hours before collection for IP and immunoblotting. WCE, whole-cell extract; l.ex., long exposure; s.ex., short exposure.
(F) H2009 cells infected with lentiviruses expressing either a dox-inducible FLAG-tagged WT Bach1 or Bach1(Y11F) were transfected with either an EV or HA-tagged Fbxo22. Cells were treated with dox for 24 hours. Dox was then washed out and, after 4 hours, cells were treated with CHX, collected at the indicated times, lysed, and immunoblotted as indicated. The graph shows the quantification of protein levels. Values are presented as means ±SEM. l.ex., long exposure; s.ex., short exposure.
Next, we assessed if Fbxo22 manipulation affected Bach1 stability. Knockdown of Fbxo22 led to stabilization of Bach1 both in human and mouse LUAD cell lines in the presence of either hemin, cycloheximide (CHX) or TinPPIX (Figures 3C and S3C–F). Additionally, we observed complete stabilization of Bach1 in Fbxo22 knockout cells treated with either hemin or CHX (Figures 3D and S3G–I).
We then mapped the Fbxo22 binding motif in Bach1 (i.e., the Bach1 degradation motif or degron). After examining multiple Bach1 deletion mutants for their abilities to bind Fbxo22, we narrowed down the degron to a region between amino acids 6–20, a region highly conserved in Bach1 orthologues (Figure S4A–D). Alanine scanning mutagenesis of amino acids 6–20 showed that Bach1(F9A), Bach1(Y11A), Bach1(S13A), as well as Bach1(Y11F), Bach1(S13D), and Bach1(S13E), but no other single amino acid substitution mutants, failed to co-immunoprecipitate with endogenous Fbxo22 (Figures 3E and S4E–G), indicating that residues 9, 11, and 13 of Bach1 are necessary for its binding to Fbxo22. Interestingly, Bach1(Y11H), a mutant mimicking a cancer-related mutation (ID#: TCGA-LN-A7HY-01), was also unable to bind Fbxo22 (Figure 3E).
Next, we generated human LUAD cell lines stably expressing a dox-inducible construct for WT Bach1 or Bach1(Y11F). In agreement with its inability to bind Fbxo22, Bach1(Y11F) exhibited a half-life longer than WT Bach1 both in untreated and hemin-treated cells (Figure S5A–D). Moreover, Fbxo22 overexpression drastically decreased the half-life of WT Bach1, but not of Bach1(Y11F) (Figures 3F and S5E). Virtually identical results were obtained in mouse Bach1 null KP cells stably expressing both exogenous Fbxo22 and a dox-inducible construct for either WT Bach1 or Bach1(Y11F) (Figure S5F–I).
Overall, these results demonstrate that Fbxo22 mediates the heme-dependent degradation of Bach1.
Fbxo22 depletion activates Bach1 transcriptional program and promotes cell migration
Given the role of Bach1 in promoting metastasis, we examined whether Bach1 accumulation in response to Fbxo22 knockdown activates the Bach1-prometastatic transcriptional program, which we observed in KPK cells (Figure 1). To this end, we depleted Fbxo22 in both KP and KPK cells and then performed transcriptional profiling by RNA sequencing. In line with the increased levels of Bach1 in Fbxo22 knockdown KP cells (Figure S3E), we found the Bach1 transcriptional signature was highly enriched in Fbxo22-depleted KP cells compared to control KP cells (Figure S6A and Table S4). Bach1 targets were differentially expressed in Fbxo22-depleted KP cells compared to control KP cells at 5% FDR (Figure 4A and Table S5). A total of 29 Bach1 targets were significantly upregulated by at least two-fold, while 7 were significantly downregulated by at least twofold. Fourteen of the 29 upregulated genes and only 1 out of the 7 downregulated genes are known to be associated with metastasis. In contrast to KP cells, we did not observe a significant enrichment of the Bach1 signature when Fbxo22 was silenced in KPK cells (Figure 4B and Table S5), which is consistent with the already high levels of Bach1 in KPK cells (Figure 2).
Figure 4. Fbxo22 depletion activates Bach1 transcriptional program and promotes cell migration.

(A) Volcano plot comparing the expression of Bach1 signature genes in KP cells transfected with either a non-targeting siRNA (siCtrl) or siFbxo22. Plotted for each gene are the negative log10 of the p value and the log2 of the fold change of gene expression of KP-siFbxo22 cells relative to KP-siCtrl cells. The green dots represent genes with fold change values of −/+ 2, and the red bar represents a FDR threshold of 5%. The blue dots represent down-regulated Bach1 target genes, while the red dots represent upregulated Bach1 target genes. The enrichment of transcripts was calculated considering the transcripts with at least 2 fold change at 5% FDR.
(B) The experiment was performed as in (A), except that the volcano plot compares the expression of Bach1 signature genes in KPK-siFbxo22 cells v. KPK-siCtrl cells.
(C) KP and KPK cells infected with lentiviruses expressing either a dox-inducible, non-targeting shRNA (shCtrl) or shRNAs targeting either Bach1 (shBach1) or Fbxo22 (shFbxo22). Forty-eight hours after dox induction, cells were treated with either Ki696 or TinPPIX for 24 hours. Cells were then tested for migration in a Boyden chamber assay over a 12 hours period. Next, cells migrated on the bottom of the transwells were fixed, stained and counted in 5 different fields/well. The graph shows quantification from 3 technical replicates of a representative experiment. Bottom, representative images of migrated cells. Values are presented as means ±SEM.
(D) KP-sgTom, KP-sgFbxo22, and KP-sgBach1 cells transduced with lentiviruses expressing either a dox-inducible shCtrl, shBach1, or shFbxo22 were treated with dox for 72 hours and tested for migration as in (C). Values are presented as means ±SEM.
To investigate the impact of deregulating the Keap1-Nrf2-Fbxo22-Bach1 nexus, we performed in vitro cell migration assays. We generated KP and KPK cells stably expressing inducible shRNAs targeting either Bach1 (shBach1) or Fbxo22 (shFbxo22) (Figure S6B). Ki696-mediated activation of Nrf2 in KP cells increased cell migration (Figures 4C and S6C). Conversely, destabilization of Bach1 through TinPPIX-mediated inhibition of Ho1 decreased cell migration (Figures 4C and S6C). As already shown in Figures S1A–B, KPK cells, which have high Nrf2 levels, displayed higher cell migration compared to KP cells (Figures 4C and S6C). Depletion of Bach1 decreased cell migration irrespective of any treatment with Ki696 or TinPPIX. Conversely, Bach1 accumulation through Fbxo22 depletion increased cell migration in all the conditions examined (Figures 4C and S6C). To further validate that Bach1 levels control cell migration in additional mouse and human LUAD cell lines, we performed scratch assays in Keap1 mutant A549 cells expressing inducible shBach1 or shFbxo22, as well as in Fbxo22 null or Bach1 null KP cells (Figure S6D–F). In these cell lines, we obtained virtually identical results as in mouse KP and KPK cells.
Next, to determine whether the increased migration capability of Fbxo22-depleted cells is mediated by Bach1, we used control, Fbxo22 null, or Bach1 null KP cells that also expressed inducible shBach1, shFbxo22 or shCtrl (Figure S6G–H). In agreement with our previous results, Fbxo22 depletion increased cell migration, while Bach1 depletion decreased it (Figure 4D). Strikingly, concomitant depletion of Bach1 completely abolished the increased cell migration observed in Fbxo22 depleted cells (Figure 4D), indicating that the increased cell migration induced by Fbxo22 loss is mediated by Bach1. Together, the above results show both genetically and pharmacologically that Keap1 and Fbxo22 inhibit a Bach1-dependent cell migratory phenotype, whereas Nrf2 and Ho1 promote it.
Bach1 promotes metastasis
Next, we investigated the impact of the Fbxo22-Bach1 axis in vivo. To this end, we assessed metastasis formation in nude mice subcutaneously transplanted with KP or KPK cells expressing inducible shBach1, shFbxo22, or shCtrl. In line with our previous results (Figure 1C), mice implanted with KPK-shCtrl cells had increased metastases compared to mice implanted with KP-shCtrl cells (Figure 5A). Importantly, depletion of Bach1 reduced metastases of both KP and KPK tumors and, conversely, depletion of Fbxo22 increased metastases in mice with KP tumors to the same extent as observed in mice with KPK tumors (Figure 5A). The differences in metastatic potential were not due to increased tumor growth (Figure S7A).
Figure 5. Bach1 promotes metastasis.

(A) Quantification of lung metastases at 4 weeks after SQ implantation of KP and KPK cells expressing a GFP/luciferase reporter and transduced with lentiviruses expressing either a dox-inducible shCtrl, shBach1, or shFbxo22 (from left to right, n= 9, 7, 7, 9, 7, and 6). Mice were put on a dox diet 10 days after implantation. Data are presented as means, and squares represent individual data points. (B) Schematic representation of KrasLSL-G12D/+; p53fl/fl (KP) mice intratracheally infected with uSEC lentiviruses containing sgTom, sgKeap1, or sgFbxo22. (C) Metastasis incidence in sgTom, sgKeap1, or sgFbxo22 mice (n= 12, 10, and 9 respectively) at 21 weeks after infection with uSEC lentiviruses. (D) Quantification of lung metastases at 4 weeks after SQ implantation of KP-sgTom and KP-sgBach1 cells expressing a GFP/luciferase reporter and transduced with lentiviruses expressing either a dox-inducible shCtrl or shFbxo22 (from left to right, n= 12, 13, 13, and 12). Mice were put on a dox diet 10 days after implantation. Data are presented as means, and squares represent individual data points. Right, representative brightfield and GFP fluorescent images of lung metastasis. (E) Quantification of lung metastases at 4 weeks after SQ implantation of KP-sgTom and KP-sgFbxo22 cells expressing a GFP/luciferase reporter and transduced with lentiviruses expressing either a dox-inducible shCtrl or shBach1 (from left to right, n= 12, 15, 15, and 14). Mice were put on a dox diet 10 days after implantation. Data are presented as means, and squares represent individual data points. Right, representative brightfield and GFP fluorescent images of lung metastasis.
To assess the effects of Fbxo22 loss in an autochthonous lung tumorigenesis setting, we used the KP GEMM. Specifically, we generated bi-functional uSEC (U6::sgRNA-EFS::Cre) lentiviruses expressing Cre recombinase and sgRNAs against Fbxo22, Keap1, or tdTomato, which were delivered intratracheally in the lungs of KP;Rosa26LSL-Cas9−2a-GFP mice (Figure 5B). We observed a significant increase in the incidence of metastasis in both sgFbxo22 and sgKeap1 animals as compared to sgTom control mice (Figure 5C). Furthermore, tumor burden in sgFbxo22 and sgKeap1 mice were significantly higher than sgTom mice (Figure S7B). Using IHC, we confirmed that tumors of sgFbxo22 mice stained negative for Fbxo22 and expressed high Bach1 levels, while tumors from sgTom mice stained positive for Fbxo22 and displayed low Bach1 levels (Figure S7C).
Next, we assessed metastasis formation in nude mice subcutaneously transplanted with either control (sgTom), Fbxo22 null or Bach1 null KP cells expressing inducible shBach1, shFbxo22, or shCtrl. In line with our previous results, implantation of Bach1-deficient cells decreased metastasis compared to mice implanted with control cells, while Fbxo22-deficient cells increased it (Figure 5D–E). Importantly, concomitant depletion of Bach1 drastically reduced the formation of metastases induced by Fbxo22 loss (Figure 5D–E), suggesting that the increased metastatic rate induced by Fbxo22 depletion is mediated by Bach1. No significant impact on primary tumor growth was observed (Figure S7D–E).
Finally, we analyzed metastasis formation in nude mice subcutaneously implanted with Bach1 knockout KP cells stably overexpressing both Fbxo22 and an inducible construct for either WT Bach1 or Bach1(Y11F). Bach1 overexpression (either WT or the Y11F mutant) induced a dramatic increase in the number of metastases compared to Bach1 null cells (Figure 6A). Concomitant overexpression of Fbxo22 significantly decreased metastases induced by WT Bach1 (Figure 6A). Conversely, Fbxo22 failed to reduce metastasis formation in Bach1(Y11F)-expressing cells (Figure 6A), likely due to Fbxo22’s inability to bind and degrade this mutant (Figure S5I). No significant impact on primary tumor growth was observed (Figure S7F).
Figure 6. Fbxo22 overexpression or Ho1 inhibition blocks Bach1-driven metastasis.

(A) Quantification of lung metastases at 4 weeks after SQ implantation of KP-sgBach1 cells infected with lentiviruses expressing either EV or Fbxo22 in combination with lentiviruses expressing either a dox-inducible EV, WT Bach1 or Bach1(Y11F) (n=14 in each group). Mice were put on a dox diet 10 days after implantation. Data are presented as means, and squares represent individual data points. Right, representative brightfield images of lung metastases.
(B) Quantification of lung metastases at 4 weeks after SQ implantation of KP and KPK cells expressing a GFP/luciferase reporter and infected with lentiviruses expressing either a dox-inducible shCtrl or shFbxo22. Mice were put on a dox diet 10 days after implantation. Two weeks after implantation, mice were randomized and daily injected for 14 days with either vehicle or ZnPPIX 40mg/kg (from left to right, n= 7, 6, 7, 7, 7, 7, 7, and 7). Data are presented as means, and squares represent individual data points. Right, representative brightfield and GFP fluorescent images of lung metastases.
In vitro, TinPPIX treatment triggers Bach1 destabilization and decreases cell migration both in KP and KPK cells. These results prompted us to explore whether inhibition of Ho1 would suppress metastasis formation. To this end, we assessed metastasis formation in nude mice subcutaneously transplanted with KP or KPK cells expressing inducible shFbxo22 or shCtrl. Once primary tumors were established, we treated animals for 14 days with either vehicle or ZnPPIX, an Ho1 inhibitor (Doi et al., 1999; Fang et al., 2003). In line with our previous results, KPK-shCtrl and KP-shFbxo22 cells metastasized more than KP-shCtrl cells (Figure 6B). Ho1 inhibition by ZnPPIX treatment significantly reduced metastasis in both KP and KPK models (Figure 6B) without having any significant impact on primary tumor weight (Figure S7G). Strikingly, the Ho1 inhibitor had no effect on the metastatic potential of KP-shFbxo22 and KPK-shFbxo22 cells (Figure 6B), suggesting that Ho1 inhibition reduced metastasis formation through the promotion of the Fbxo22-mediated degradation of Bach1.
Altogether, these results indicate that Bach1 accumulation by either Keap1 or Fbxo22 loss induces metastasis formation. In addition, pharmacological inhibition of Ho1 decreases metastasis formation by promoting the Fbxo22-mediated degradation of Bach1.
Bach1 levels and its transcriptional signature is associated with poor survival, advanced clinical stage and grade, and presence of metastases in human LUAD
Next, we assessed the levels of Bach1 and Ho1 in tissue microarrays generated from human LUAD primary tumor samples with matching metastasis. We found that both Bach1 and Ho1 levels were significantly increased in LUAD metastases compared to matched primary tumors (p = 0.0048 and p = 0.0154, respectively) (Figure 7A). Moreover, there was a significant correlation between high Ho1 and high Bach1 levels in metastases (p = 0.0004) (Figure 7A). An analysis of the Bach1 signature (Bach1 MutSig) in a data set of human LUAD patient samples (n = 548) (Cancer Genome Atlas Research, 2014) showed a significant enrichment of the Bach1 signature in high-grade tumors (Figure 7B) and late-stage disease (Figure 7C). Furthermore, the Bach1 signature was significantly enriched in primary tumors from LUAD patients with lymph node metastasis as compared to patients with no metastasis (Figure 7D). Ranking tumors by the strength of their correlation with the Bach1 signature allowed for stratification of all TCGA subjects with LUAD into two subpopulations. The subpopulation with the highest Bach1 correlation displayed significantly shorter survival compared to the rest of the cohort (Figure 7E). Notably, this Bach1 signature was found to be independently prognostic in the TCGA LUAD cohort while controlling for other clinical covariates in a Cox proportional-hazards model (Table S6), in which higher enrichment for the signature was associated with significantly worse survival. Finally, in agreement with the enrichment of the Bach1 signature with aggressive disease (stage, grade and metastasis), the Bach1 signature was prognostic for stage (III/IV vs I/II,), grade (T3/T4 vs T½) and lymph node metastasis (N1/N2 vs N0) (Table S6).
Figure 7. Bach1 levels and its transcriptional signature are associated with poor survival, advanced clinical stage and grade, and presence of metastases in human LUAD.

(A) The graph shows the percentage of primary human LUAD samples with matching metastasis (n = 13) displaying low or high levels of Bach1 and Ho1. Middle panels, representative IHCs. Scale bars, 330 μM for low magnification (3X) and 25 μM for high magnification (40X). Left, contingency tables demonstrating the correlation between Ho1 and Bach1 expression in primary tumors (top) and matching metastases (bottom).
(B) Empirical cumulative distribution function (CDF) plots showing correlation of individual tumors with the Bach1 signature across various tumor grades within the TCGA LUAD cohort.
(C)CDF plots showing correlation of individual tumors with the Bach1 signature across various clinical stages within the TCGA LUAD cohort.
(D) CDF plots showing the correlation of individual tumors with Bach1 signature in primary tumors within the TCGA LUAD cohort with lymph node metastasis (N1, N2) as compared to cohort with no metastasis (N0).
(E) Kaplan–Meier survival curves comparing subjects in the TCGA LUAD cohort stratified by correlation with Bach1 signature. Tumor samples were binned according to their gene expression correlation with Bach1 signature. Subjects harboring the top 20% (n = 102) most correlated tumors exhibited significantly decreased survival as compared to the remaining subjects (n = 413) from the TCGA LUAD cohort.
Taken together, these data suggest that high Bach1 levels in LUAD are associated with increased metastasis and poor survival.
Discussion
Metastasis is the primary cause of death in cancer patients. About ∼30% of NSCLC patients harbor either inactivating somatic mutations in Keap1 or mutations in Nfe2l2, respectively, leading to stabilization of Nrf2. The impact of these mutations on the formation of metastasis in lung cancer patients has remained unclear. Nrf2 activation has been shown to promote cell migration in vitro (Wang et al., 2016; Zhang et al., 2012) and metastasis in a hepatocellular carcinoma mouse model (Zhang et al., 2015). Moreover, in a Kras-driven LUAD GEMM, Keap1 loss leads to the appearance of high-grade invasive adenocarcinomas that are typically associated with increased metastases (Winslow et al., 2011). Similarly, loss of Keap1 in LUAD patients is associated with high-grade and late-stage disease and shortened survival (Romero et al., 2017), which might be caused by an increased rate of metastasis in these patients. Conversely, other studies in lung carcinoma mouse models, indicate that NRF2 has anti-metastatic properties (Hiramoto et al., 2014; Suzuki and Yamamoto, 2015). Our results show that Keap1 loss induces the activation of a pro-metastatic transcriptional program and a dramatic increase of the metastatic phenotype in LUAD mouse models. Activation of the metastatic program induced by Keap1 loss is driven by the accumulation of Bach1, which has been described, particularly in breast cancer, as a key pro-metastatic transcription factor that promotes the transcription of critical metastatic genes, such as CXCR4 and MMPs (Lee et al., 2013; Liang et al., 2012; Yun et al., 2011). Notably, we found that in LUAD patients, the expression of Bach1 target genes is associated with high-grade, advanced-stage and highly metastatic disease, as well as shortened survival.
Mechanistically, we dissected the molecular events regulating Bach1 stability. It has been shown that Bach1 degradation is promoted by free heme (Zenke-Kawasaki et al., 2007). We found that the heme-induced degradation of Bach1 is mediated by Fbxo22, a substrate receptor of a CRL1 ubiquitin ligase complex. We showed that heme promotes the physical interaction between Bach1 and Fbxo22, which represents the long-sought molecular mechanism by which heme triggers the elimination of Bach1. Two other ubiquitin ligases (Hoil1 and Fbxl17) have been proposed to target Bach1 for degradation (Tan et al., 2013; Zenke-Kawasaki et al., 2007). We did not detect any interaction between Bach1 and Hoil1, but, in agreement with a large proteomic study by (Huttlin et al., 2017), we observed that Bach1 binds to Fbxl17, although not as stably as to Fbxo22. Moreover, in contrast to the binding to Fbxo22, the interaction with Fbxl17 decreased upon hemin treatment. Fbxl17 has recently been shown to selectively ubiquitylates BTB dimers of aberrant composition (Mena et al., 2018), suggesting that Fbxl17 targets Bach1 only when it is in complex with the wrong BTB protein.
It is generally believed that the Bach1-mediated repression of Maf-regulated genes is dominant over the Nrf2-mediated activation of these genes (Reichard et al., 2007). Our data suggest that unscheduled Nrf2 activation is able to override Bach1 repression and activate the transcription of antioxidant genes even in the presence of high levels Bach1. At the same time, stabilized Bach1 triggers the activation of other targets, including key pro-metastatic genes.
Notably, we found that, upon Keap1 loss, Bach1 protein stabilization is induced by the Nrf2-dependent upregulating of Ho1 that, presumably, reduces the levels of free heme. Accordingly, pharmacologic inhibition of Ho1 induces the Fbxo22-dependent degradation of Bach1, resulting in the reduction of cell migration and metastasis. Consistent with our results, Ho1 has been found to be overexpressed in various tumors, to facilitates cancer cell growth and survival, and to promote tumor angiogenesis and metastasis (Dey et al., 2015; Sunamura et al., 2003; Was et al., 2006). Moreover, the efficacy of targeting Ho1 has been proven in animal models. For example, the administration of ZnPPIX significantly suppresses the growth of gastric cancers, hepatomas, and sarcomas (Doi et al., 1999; Fang et al., 2003; Shang et al., 2015; Tanaka et al., 2003). Overall, our data suggest that drugs targeting the heme pathway might represent a novel therapeutic avenue in LUAD patients with alterations in the Keap1-Nrf2 pathway, particularly those in which it is necessary to prevent tumor dissemination. We also speculate that the activation of Bach1 metastatic program is also frequently present in other cancers with genetic, epigenetic, or post-transcriptional alterations in the Keap1-Nrf2 pathway (Cancer Genome Atlas Research, 2012; Goldstein et al., 2016; Hanada et al., 2012; Jaramillo and Zhang, 2013; Muscarella et al., 2011). Thus, we hypothesize that the mechanisms we have identified in Keap1 mutant LUAD tumors, may offer new therapeutic opportunities to inhibit metastasis in these cancers as well.
Our findings are complementary and in agreement with the results by (Wiel et al., 2019), who found that supplementing the diet of mice harboring lung tumors with either a pharmacological (N-acetylcysteine) or dietary (vitamin E) antioxidant, promotes metastasis by increasing the intracellular levels of Bach1.
In summary, we identified a molecular mechanism by which mutations in the Keap1-Nrf2 axis promotes metastasis. Specifically, activated Nrf2 inhibits the Fbxo22-dependent degradation of Bach1 via induction of Ho1 expression. Notably, we show that lung cancer cells with high levels of Nrf2 display also high levels of Bach1, the latter promoting metastasis through activation of pro-metastatic genes transcription.
STAR Methods
CONTACT FOR REAGENT AND RESOURCE SHARING
Further information and requests for resources and reagents should be directed to and will be fulfilled by the Lead Contact, Michele Pagano (michele.pagano@nyumc.org).
EXPERIMENTAL MODEL AND SUBJECT DETAILS
Animal experiments
All animal studies described were approved by the NYU Langone Medical Center Institutional Animal Care and Use Committee. 2.5 × 10⁵ cells were implanted subcutaneously into 5–8 week old male nude mice (Foxn1nu). After tumor establishment phase, approximately 10 days post implantation (tumors 100–150mm3), all animals were put on a doxycyline diet (200mg/kg), 4 days after, at day 14, mice were randomized and assigned to groups: vehicle or ZnPPIX treatment. Animals were treated with 40 mg/kg ZnPPIX (Cayman Chemical) or vehicle once a day administered through intraperitoneal injection. The drug and vehicle containing 4% DMSO 30% polyethylene glycol (PEG) and 66% saline was formulated daily. LSL-KrasG12D; Trp53flox mice have already been described (DuPage et al., 2009). For all mouse studies, >3 mice were used for each experimental cohort per specified genotype. All mice were maintained on a mixed genetic background containing C57BL/6– 129/Sv. Mice with the appropriate genotype were randomly selected to begin tumor initiation studies with pSECC-sgTom or pSECC-sgKeap1, and uSEC-sgTom, uSEC-sgKeap1 or uSEC-sgFbxo22. Mice were infected intratracheally with lentiviruses as described (DuPage et al., 2009). The total lung area occupied by each tumor was measured on H&E-stained slides using NISElements software (Nikon) or Biopix IQ. All tumor burden and IHC analyses were done in a blinded fashion, in which the researcher was unaware of which genotype of the samples. For allograft experiments, cells derived from mouse lung tumors were transplanted subcutaneously (2.5 × 10⁵ cells) under the skin or orthotopically (5 × 10⁴ cells) in the lungs of 5–8 week old male nude (Foxn1nu) or 5–8 week old female C57BL/6J mice. Subcutaneous tumor volumes were calculated according to the following formula (a × b2)/2.
Cell Culture Procedures
Parental cell lines from KP mice were previously established and described (Dimitrova et al., 2016). HEK293T (female), A549 (male), H2009 (female), cell lines were propagated in DMEM at 37°celsius. All media were supplemented with 10% fetal bovine serum (FBS) (Corning Life Sciences) and 1% penicillin/streptomycin/L-glutamine (Corning Life Sciences). For A549 or H2009 cells stably infected with pTRIPZ vectors, KP cells stably infected with pTRIPZ and pLVX-mCherry vectors, and A549 or KP or KPK infected with mirE vectors, cells were propagated in DMEM supplemented with 10% Tet system-approved FBS (Takara/Clontech Laboratories) and 1% penicillin/streptomycin/L-glutamine (Corning Life Sciences). Doxycycline (Sigma-Aldrich) was used at 0.1 μg/mL, Cycloheximide (Sigma-Aldrich) at 100 μg/mL, MLN4924 (Active Biochem) at 2 μM, MG132 (Peptides International) at 10 μM, Hemin (Sigma-Aldrich) at 10 μM, Tin protoporphyrin IX dichloride (TinPPIX) (Tocris) at 10 μM, Ki696 (provided by Craig Thomas lab) at 1 μM. DMSO was used as vehicle treatment in both transwell and scratch assay. Cells were periodically screened for Mycoplasma contamination. No cell lines used in this study were found in the database of commonly misidentified cell lines that is maintained by ICLAC and NCBI Biosample. Specific details about cell lines used are provided in the Key Resource Table.
Human lung cancer with matched lymph node metastasis tissue array, human clinical lung cancer samples and Patient derived xenografts (PDXs)
Lung carcinoma with matched lymph node metastasis tissue microarray (US biomax, Inc. cat. No. LC817a), and clinical lung cancer samples from NYU biospecimen core and PDX materials that were KEAP1 mutant or KEAP1 wildtype [both previously described and generated (Romero et al., 2017)] were probed with antibodies against Bach1 (Bethyl Laboratories, A303–058A) and Ho1 (Bethyl Laboratories, A303–662A). Immunocytochemistry was performed in a Leica Bond Max (Leica Biosystem).
METHOD DETAILS
CRISPR genome editing.
Generation of KP, KPK, KP-Nrf2 KO cells were previously generated and described (Romero et al., 2017). To generate Fbxo22, Bach1 and Ho1 knockout KP cells, optimal sgRNA target sequences closest to the genomic target sites were designed using the Benchling CRISPR Genome Engineering tool. Fbxo22, Bach1 and Ho1 sgRNA target sequences (see Table S7) were cloned into pSpCas9(BB)-2A-GFP (PX458), a gift from F. Zhang (Addgene plasmid no. 48138)(Ran et al., 2013). KP cells were seeded into 10 cm dishes at a 70% confluency, and transfected with 5 μg of the appropriate sgRNA-containing PX458 plasmid, using Lipofectamine 3000 (Life Technologies). The transfection was performed according to the manufacturer’s recommended protocol, using a 2:1 ratio of Lipofectamine/DNA. Two days after transfection, GFP-positive cells were sorted using the Beckman Coulter MoFlo XDP cell sorter (100 m nozzle), and 15,000 cells were plated on a 15 cm dish. Eight to ten days later, single KP clones were picked, trypsinized in 0.25% trypsin EDTA for 5 min, and plated into individual wells of a 96-well plate for genotyping. Genomic DNA was collected using QuickExtract (Epicentre). Genotyping PCRs were performed with MangoTaq DNA Polymerase (Bioline), using primers surrounding the genomic target site. The resulting PCR products were purified and sequenced to determine the presence of an insertion or deletion event. To further validate the mutational status of candidate clones, the PCR products were subjected to TOPO-TA Cloning (Invitrogen), and sequenced to distinguish the amplified products of distinct alleles. Fifty bacterial colonies for each TOPO-TA cloning reaction were sequenced and aligned to the corresponding wild-type template in Benchling. Clones positive to insertion or deletion events were validated also by western blot.
Gene Set Enrichment Analysis
Gene set Enrichment Analysis (GSEA) (Mootha et al., 2003; Subramanian et al., 2005) analysis (which ultimately relies on gene-sets of human origin), was performed using the mouse transcriptomics data after projection to the assigned human orthologs (as described below in the Transcriptomics Data Analysis section). The analysis was performed using java GSEA Desktop Application with default parameters and considered two gene-sets: (1) the C3:TFT gene-set which is provided as part of MSigDB V6.2 (Liberzon et al., 2011) and contains target gene-sets for a series of human transcription factors and putative motifs, (2) a database of genes generated by extraction of all genes reported by Human Cancer Metastasis Database (HCMDB)(Zheng et al., 2018) (Figure 1E). In Figure S6A we employed an integrated Bach1 gene set that we generated by combining the Bach1 MSigDB signature with a Bach1 target gene list obtained from ChIP-Seq data previously published (Warnatz et al., 2011).
Gene Silencing by siRNA
The following siRNA (GE Healthcare) were used: ON-TARGETplus siRNA oligos targeting human and mouse Fbxo22 (see Table S7). The first two efficient siRNAs, along with a non-targeting siRNA as control, were used in the study: #1 and #2 for human; #2 and #4 for mouse. All siRNA were transfected into different cell lines using RNAi Max (Thermo Fisher Scientific). ON-TARGETplus non-targeting siRNA #1 (GE Healthcare, catalog no. D-001810–01) served as a negative control.
Human clinical data analyses
Genomic data for samples from subjects with lung adenocarcinoma (n = 576) were obtained from TCGA LUAD (cancergenome.nih.gov). This included RNA-seq gene expression profiles of primary tumor samples from subjects (n = 515) and associated clinical data (n = 515 subjects with RNA-seq data for primary tumors with associated survival data). Individual sample expression profiles were scored against the MSigDB (software.broadinstitute.org/gsea/msigdb) Bach1 signature (BACH1_01) using ssGSEA (Barbie et al., 2009; Subramanian et al., 2005). Patients were stratified according to their correlation score with the Bach1 signature and Kaplan–Meier survival analyses were conducted between the top 20% of correlated patients versus the rest of the LUAD cohort. The log-rank test was used to assess significance. Additionally, the Cox proportional hazards regression model was used to analyze the prognostic value of the Bach1 signature across all subjects within the TCGA LUAD cohort in the context of additional clinical covariates. All univariate and multivariable analyses were conducted within a 5-year survival timeframe. The following subject and tumor-stage clinical characteristics were used: signature (Bach1 signature strong versus weak correlation); gender (male versus female); age (years, continuous); smoking history (reformed > 15 y versus nonsmoker, reformed < 15 y versus nonsmoker, current smoker versus nonsmoker); Union for International Cancer Control (UICC) tumor nodes metastasis (TNM) stage specification (stage III or IV versus I or II); UICC T-score specification (T3 or T4 versus T1 or T2); UICC N-score specification (N1 or N2 versus N0); Tumor purity (Fraction cancer nuclei from (Campbell et al., 2016) using ABSOLUTE (Carter et al., 2012). Hazard ratio proportionality assumptions for the Cox regression model were validated by testing for all interactions simultaneously (P = 0.773). Interaction between the Bach1 signature and T score, N score, and Tumor purity (significant covariates in the model) were tested using a likelihood-ratio test (LRT) to contrast a model consisting of both covariates with another model consisting of both covariates plus an interaction term. No statistically significant difference was found between the two models (T score: P = 0.893; N score: P = 0.909; Tumor purity P = 0.705; likelihood-ratio test). To test for statistically significant association between Bach1 signature correlation scores and TCGA LUAD TNM stage (stages I–IV), T-scores, and N-scores, the Kurskal–Wallis test was used to assess overall significance, and the Kolmogorov–Smirnov test was used to assess pairwise differences. An analysis pipeline configured using a previously released TCGA dataset with 488 primary tumor samples and associated clinical data was utilized. Results were visualized using empirical cumulative distribution function (ECDF) plots. All statistical analyses were conducted in R (www.R-project.org), and all survival analyses were conducted using the survival package in R.
Immunoprecipitation and immunoblotting
HEK293T cells were transiently transfected using polyethylenimine. Where indicated, 24 hours after transfection, HEK293T cells were incubated with MLN4924 for 3 hours before collection. Cell lysis was carried out with lysis buffer (50 mM Tris pH 8.0, 150 mM NaCl, 10% glycerol, 1 mM EDTA, 50 mM NaF, and 0.1% NP-40) supplemented with protease and phosphatase inhibitors. Lysates were then immunoprecipitated with anti-FLAG antibody conjugated to agarose. Elution of the immunoprecipitate for anti-FLAG agarose resin was carried out with FLAG peptide. For immunoprecipitation of endogenous proteins, HEK293T cells were collected and lysed with lysis buffer. Bach1 was immunoprecipitated with the listed antibody mixed with Dynabeads Protein G (Thermo Fisher Scientific). Rabbit IgG (Bethyl) was used as a negative control. Elution of the immunoprecipitate was carried out with NuPAGE® LDS sample buffer (Thermo Fisher Scientific) supplemented with β-mercaptoethanol (Sigma-Aldrich) and incubation at 95°C for 5 minutes. Immunoblotting was performed as previously described (Pagan et al., 2015). Briefly, samples were resolved under denaturing and reducing conditions using 4–12% Bis-Tris gels (NuPAGE®) and transferred to a PDVF membrane (Immobilon-P, Millipore). Membranes were blocked with 5% nonfat dried milk, incubated with primary antibodies overnight at 4°C. After washing the membranes, secondary antibodies coupled with horseradish peroxidase were applied (Amersham-GE). Immunoreactive bands were visualized by enhanced chemiluminescence reagent (Thermo Fisher Scientific).
Immunohistochemistry and immunofluorescence.
Mice were euthanized by carbon dioxide asphyxiation. Lungs were perfused through the trachea with 10% neutral buffered formalin, fixed overnight, transferred to 70% ethanol, and subsequently embedded in paraffin. Sections were cut at a thickness of 3 μm and stained with H&E for pathological examination. Chromogenic IHC was performed on a Ventana Medical Systems DISCOVERY XT instrument with online deparaffinization using Ventana’s reagents and detection kits and antigen retrieved in Ventana Cell Conditioner 1 or 2. The following antibodies were used for IHC: anti-Bach1 (Bethyl, A303–058 1:500), anti-Bach1 (R&D Systems, AF5777 1:100), anti-Ho1(Bethyl, A303–662A 1:100), anti-Fbxo22 (Proteintech, 13606–1-AP 1:100). HRP detection was used for Ho1, Bach1, Fbxo22. Antigen retrieval was performed in a Ventana Cell Conditioner 1 (TBE). Pictures were obtained using a Nikon 80i microscope with a DS-U3 camera and NIS-Elements software and with a digital whole-slide scanner (Leica, SCN400F) and Slidepath software version 4.0.8.
Lentivirus-Mediated gene transfer
HEK293T were transiently co-transfected with lentiviral (pTRIPZ and pLVX-mCherry) vectors containing vesicular stomatitis virus G protein (VSV-G) and the gene of interest along with pCMV Delta R8.2 using polyethylenimine. Lentivirus-containing medium, 48 hr after transfection, was collected and supplemented with 8 mg ml−1 Polybrene (Sigma). KP, A549 and H2009 cells were infected by replacing the cell culture medium with the viral supernatant for 6 hours. Selection of stable clones was carried out using puromycin for pTRIPZ and mCherry for pLVX.
Mass Spectrometry
Preparation of Affinity Purification Samples for Mass Spectrometry. Samples and empty vector control were resuspended in NuPAGE® LDS Sample Buffer (Novex). The samples were reduced with 2μl of 0.2M dithiothreitol (Sigma) for one hour at 57 °C at pH 8.0 and subsequently alkylated with 2μl of 0.5M iodoacetamide (Sigma) for 45 minutes at room temperature in the dark. The samples were loaded immediately onto a NuPAGE® 4–12% Bis-Tris Gel 1.0 mm (Life Technologies) and run at 200V. The gel was stained with GelCode Blue Stain Reagent (Thermo). The gel plugs were excised and destained in a 1:1 (v/v) solution of methanol and 100mM ammonium bicarbonate. The gel plugs were incubated with 250ng of sequencing grade modified trypsin (Promega) in 100mM ammonium bicarbonate. The gel plugs digested overnight with gentle agitation. The digestion was halted by adding a slurry of R2 50 μm Poros beads (Applied Biosystems) in 5% formic acid and 0.2% trifluoroacetic acid (TFA) to each sample (Cristea et al., 2005). The samples were allowed to shake at 4°C for 2 hours. The beads were loaded onto C18 ziptips (Millipore), equilibrated with 0.1% TFA. The beads were washed with 0.5% acetic acid. Peptides were eluted with 40% acetonitrile in 0.5% acetic acid followed by 80% acetonitrile in 0.5% acetic acid. The organic solvent was removed using a SpeedVac concentrator and the sample reconstituted in 0.5% acetic acid.
Mass Spectrometry Analysis Affinity Purification. An aliquot of each sample was loaded onto an Acclaim PepMap trap column (75 μm ID × 2cm, 3 μm bead size, 100Å pore size) in line with an EASY-Spray PepMap analytical column (75 μm ID × 50cm C18, 2 μm bead size, 100Å pore size) using the auto sampler of an EASY-nLC 1000 HPLC (ThermoFisher) and solvent A (2% acetonitrile, 0.5% acetic acid). The peptides were eluted into a ThermoFisher Scientific Orbitrap Fusion Lumos Mass Spectrometer increasing from 5% to 35% solvent B (80% acetonitrile, 0.5% acetic acid) over 60 minutes, followed by an increase from 35% to 45% solvent B over 15 minutes followed by an increase of 45 to 100% solvent B in 10 min.
High resolution full MS spectra were obtained with a resolution of 120,000, an AGC target of 4e5, with a maximum ion time of 50ms, and a scan range from 400 to 1500m/z. Following each full MS scan, low resolution MS/MS spectra were acquired for a 3 sec duty cycle. The MS/MS spectra were collected in the ion trap in rapid scan mode, with an AGC target of 1e5, maximum ion time of 30ms, one microscan, 2m/z isolation window, Normalized Collision Energy (NCE) of 32 and a dynamic exclusion of 30 msec.
Data Analysis. All acquired MS2 spectra were searched against a UniProt human database using Sequest within Proteome Discoverer (Thermo Scientific). The search parameters were as follows: precursor mass tolerance ±10 ppm, fragment mass tolerance ± 0.4 Da, digestion parameters allowing trypsin 2 missed cleavages, fixed modification of carbamidomethyl on cysteine, variable modification of oxidation on methionine, and variable modification of deamidation on glutamine and asparagine. Peptides were filtered to better than 1% FDR using a target-decoy database strategy and proteins require at least two unique peptides to be reported.
Sample preparation for multiplexed quantitation. 500 μg of each protein lysates (obtained using a buffer: 20 mM HEPES pH 8.0, 8 M urea) were reduced using dithiothreitol (5μl of 0.2 M) for 1 h at 55 °C. The reduced cysteines were subsequently alkylated with iodoacetamide (5μl of 0.5 M) for 45 min in the dark at room temperature. The samples were digested with LysC at a 200:1 (protein:enzyme) ratio for 2 hours at 37°C. Next, 100 mM ammonium bicarbonate (pH 8.0) was added to dilute the urea concentration to 2 M and the protein lysates were digested with trypsin (Promega) at a 100:1 (protein:enzyme) ratio overnight at room temperature. The digested protein lysates was acidified to pH < 3 using trifluoroacetic acid (TFA) and desalted using C18 solid-phase extraction (Sep-Pak, Waters). The desalted peptides were eluted using first 40% acetonitrile (ACN) in 0.5% acetic acid followed by 80% acetonitrile (ACN) in 0.5% acetic acid. The peptide eluate was concentrated using the SpeedVac and stored at −80°C.
Plasmids
Bach1, Fbxo22 and Keap1 complementary cDNAs were inserted into a variety of vectors (modified pcDNA3.1 vectors containing N-terminal FLAG and STREP tags; pTRIPZ-puromycin lentiviral vector containing N-terminal FLAG and STREP tags; pLVX-mCherry lentiviral vector) by sub-cloning or site-directed mutagenesis (KAPA Biosystems). Specific details will be provided on request.
Proteomics Data Analysis
The first majority protein in each ProteinGroup of the MaxQuant (Cox and Mann, 2008) report was mapped to an MGI mouse gene accession using UniProt’s (The UniProt, 2017) mapping (ftp://ftp.uniprot.org/pub/databases/uniprot/current_release/knowledgebase/idmapping/by_organism/MOUSE_10090_idmapping.dat.gz, downloaded on August, 2018) such that each MGI mouse gene is represented by a single ProteinGroup. This mapping was further leveraged to select a human ortholog (as was done with the transcriptomics data) such that every ProteinGroup maps to a single human ortholog. Many-to-one mappings between mouse and human genes were eliminated by selecting the candidate mouse ProteinGroup with the maximal signal intensity across all samples.
Scratch Assay
We utilized a scratch assay to measure the cell migration. 6 × 10⁵ cells were seeded in each well of a 24 multiwell dish (Corning, Cat. no. 353047). After 24 hours, the cell layer was scratched by a 1000 μl pipette tip, plates were incubated at 37 °C, 5% CO2, in a Cytation 5 Cell Imaging Reader (BioTek, Winooski, VT), equipped with a live cell module. Live cell images were then acquired at 2 hours intervals, using a 4 X phase-contrast objective, for a total of 12 hours for KP and KPK cells, or 18 hours for A549 cells. The cell image was captured and the average extent of wound closure was quantified by ImageJ software. Each experiment was performed in triplicate.
shRNA cloning and cell line generation
Doxycycline-induced knockdown of Bach1 and Fbxo22 was achieved by cloning miR-E shRNAs targeting Bach1 and Fbxo22 into the LT3GEPIR vector as before (Sayin et al., 2017). Briefly, LT3GEPIR was digested with XhoI and EcoRI, and purified with a gel extraction kit (Qiagen). Single stranded ultramers were amplified with forward primer miRE-XhoI (5’ TGAACTCGAGAAGGTATATTGCTGTTGACAGTGAGCG-3’) and reverse primer miRE-EcoRI (5’-TCTCGAATTCTAGCCCCTTGAAGTCCGAGGCAGTAGGC-3’). Amplicons were gel purified, digested with XhoI and EcoRI, purified by PCR purification kit (Qiagen) and ligated into the cut LT3GEPIR vector with T4 DNA Ligase at a 3:1 insert:vector molar ratio. Vectors were transduced into cells and selected with 3 and 6 μg /ml puromycin for three plus three days. Knockdown of mouse Bach1/Bach1, human BACH1/BACH1, mouse Fbxo22/Fbxo22 and Human FBXO22/FBXO22 was verified by western blot and qPCR analysis following 72 hr of treatment with 1 μg /ml doxycycline. Cell lines transduced with the first two efficient shRNAs, along with a non-efficient shRNA as control, were used in the study (see Table S7). The LT3GEPIR vector was previously generated and described in detail (Fellmann et al., 2013). Sequences of ultramers obtained from Integrated DNA Technologies (Coralville, Iowa).
Tandem Mass Tag
The dried peptide mixture was re-suspended in 100 mM TEAB (pH 8.5) using a volume of 45 μl. Each sample was labeled with Tandem Mass Tag (TMT) reagent according to the manufacturer’s protocol (Bhardwaj et al., 2017; Thompson et al., 2003). In brief, each TMT reagent vial (0.8 mg) was dissolved in 103 μL of anhydrous ethanol and was added to each sample. The reaction incubated for 60 min at room temperature and quenched using 8 μL of 5% w/v hydroxylamine. The samples were combined at a 1:1 ratio and the pooled sample was subsequently desalted using SCX and SAX solid-phase extraction columns (Strata, Phenomenex).
Offline fractionation of TMT multiplexed samples. The pooled sample was fractionated using basic pH reverse-phase HPLC as described (Bhardwaj et al., 2017). Briefly, the sample was loaded onto a 4.6 mm × 250 mm Xbridge C18 column (Waters, 3.5 μm bead size) using an Agilent 1260 Infinity Bio-inert HPLC and separated over a 70 min linear gradient from 10 to 50% solvent B at a flow rate of 0.5 ml/min (Buffer A = 10 mM ammonium formate, pH 10.0; Buffer B = 90% ACN, 10 mM ammonium formate, pH 10.0). A total of 130 fractions were collected. The early, middle and late eluting fractions were concatenated and combined into 40 final fractions. The combined fractions were concentrated in the SpeedVac and stored at −80 °C until further analysis.
Mass spectrometry analysis for multiplexed quantitation. An aliquot of each sample was loaded onto the same LC set up as described above. The peptide mixture was gradient eluted into the QExactive mass spectrometer (Thermo Scientific) using the following gradient: 5%−23% solvent B in 110 min, 23% −34% solvent B in 10 min, followed by 34%− 100% solvent B in 20 min. The full scan was acquired with a resolution of 70,000 (@ m/z 200), a target value of 1e6 and a maximum ion time of 120 ms. After each full scan 10 HCD MS/MS scans were acquired using the following parameters: resolution 35,000 (@m/z 200), isolation window of 1.5 m/z, target value of 1e5, maximum ion time of 250 ms, normalized collision energy (NCE) of 30, and dynamic exclusion of 30 s.
Data analysis. The raw data was searched using MaxQuant (Cox and Mann, 2008) version 1.5.2.8. Proteins and peptides were searched against the UniProt mouse database using the Andromeda (Cox et al., 2011) search engine using a target-decoy approach and the following settings: two missed cleavages were allowed for trypsin; oxidation of methionine (M), and deamidation of asparagine (N) and glutamine (Q) were set as variable modifications; carbamidomethyl of cysteine (C) was set as fixed modifications; both precursor and fragment mass tolerances were set to 10 ppm; The peptide identifications were filtered using a false-discovery rate (FDR) of 0.01 at both the protein and peptide level. Only unique peptides were used for quantification and proteins identified with less than two unique peptides were excluded from analysis. The results were further filtered to remove common contaminant proteins and reverse identifications.
The bioinformatics analysis was performed using open source software Perseus (Version 1.6.0.2). The intensity values were log2 transformed and missing values were imputed using the normal distribution as implemented by Perseus. A two-sided Welch’s t test and Benjamini-Hochberg (Benjamini et al., 2001) FDR were performed. All expression levels, ratios and p values were reported, but only protein groups having an estimated FDR less than the cut-off level of 5% were considered significantly upregulated or downregulated.
Transcriptomics Data Analysis
Sequencing reads were mapped to the mouse reference genome (GRCm38.85/mm10) using the STAR aligner (v2.5.0c)(Dobin et al., 2013). Alignments were guided by a Gene Transfer Format file (Ensembl GTF version GRCh38.85). The mean read insert sizes and their standard deviations were calculated using Picard tools (v.1.126) (http://broadinstitute.github.io/picard). The read count tables were generated using HTSeq (v0.6.0) (Anders et al., 2015), normalized based on their library size factors using DEseq2 (Love et al., 2014), and differential expression analysis was performed with DEseq2 standard parameters (lfcshrink with apeglm estimation)(R version 3.5.2). DEGs with an absolute log2 fold-change > 1 and False Discovery Rate (FDR) < 0.05 were identified as statistically significant. The FDR was calculated by applying Benjamini and Hochberg’s method in the DESeq2 package. Each Ensembl (Zerbino et al., 2018) gene in the transcriptomic dataset was mapped to an MGI (Smith et al., 2018) mouse gene accession using the mapping provided by Ensembl’s biomart (Kinsella et al., 2011) such that each MGI mouse gene is represented by at most one Ensembl gene. This mapping was further leveraged to select a human ortholog from the orthology report downloaded from the Jackson Labs website (http://www.informatics.jax.org/downloads/reports/HGNC_homologene.rpt, downloaded on October 2018) such that every Ensembl gene maps to a single human ortholog. Many-to-one mappings between mouse and human genes were eliminated by selecting the candidate mouse gene with the maximal signal intensity across all samples. All downstream statistical analyses and generating plots were performed in R environment (v3.5.2) (http://www.r-project.org/).
Transwell Assays
Transwell assays for migration were performed in transwell inserts with a 6.5-mm, 8.0-μm-pore polycarbonate membrane. Briefly, cells were suspended in serum-free media and seeded into the inner chamber (5 × 10⁴ cells per chamber). The outer chamber contained complete growth media. Cells were incubated for 12 hours and then non-migrating cells on the inside of the membrane were carefully removed with a cotton swab, while migrating cells on the outside of the membrane were fixed, stained with 0.1% Crystal violet and photographed under a standard bright field microscope (10 X objective) equipped with a digital camera. At least 5 random fields/well were photographed and cells were counted for each field. Each experiment was performed in triplicate.
Volcano and Scatter Plots
In Figures 4A–B, the volcano plots for each group comparison were generated by ggplot2 (3.0.0) package in R. In the plots in Figures 1G–H and S1H the data points are colored by membership of any associated human ortholog (as described previously in the Transcriptomics Data Analysis section) in a comprehensive set of genes putatively regulated by Bach1 (integrated Bach1 gene set, described previously in the Gene Set Enrichment Analysis section). The shape of the data points indicates whether or not the human orthologs are members of HCMDB. When combining proteomics and transcriptomics data, individual data points are matched through their associated MGI accessions.
All the p-values associated with enrichment claims regarding significantly regulated genes (whether by transcriptomics or proteomics or both) result from one-sided Fisher Exact tests run in the R statistical language and environment (R Development Core Team, 2011). Differentially expressed genes/proteins all resulted from T-tests on the underlying expression data (whether proteomic or transcriptomic) following a Benjamini-Hochberg procedure yielding a 5% False Discovery Rate. Biologically regulated genes were further filtered to include the requirement of an absolute log2 fold-change ≥1.
QUANTIFICATION AND STATISTICAL ANALYSIS
All data were analyzed by Prism 7 (GraphPad). Statistical details of experiments can be found in the figure legends. Unless otherwise noted in figure legends, data are representative of at least three biologically independent experiments. Two-group datasets were analyzed by Student’s unpaired t-test. For three or more group analysis, one-way ANOVA multiple comparison test was used. The Kaplan-Meier log rank test was used for survival comparison. Fisheŕs exact test was used for calculating significance between groups in contingency tables, IHC, transcriptomic, proteomic and proteo-transcriptomic analyses. Extent of wound closure in scratch assay was quantified by ImageJ software 2.0. For all the statistical analysis: * = p≤ 0.05, ** = p≤ 0.01, *** = p≤ 0.001, **** = p≤ 0.0001.
Supplementary Material
Supplemental Figure 1 (Related to Figure 1). Keap1 loss promotes cell migration, metastasis, and activation of the Bach1 transcriptional program.
(A) A scratch assay was performed over a 12 hours period using KP and KPK cells. The graph shows quantification of the wound closure from 3 technical replicates of a representative experiment. Values are presented as means ±SEM.
(B) KP and KPK cells were tested for cell migration in a Boyden chamber assay over a 12 hours period. After this time, cells migrated to the bottom of the transwells were fixed, stained, photographed, and counted in 5 different fields/well. The graph shows quantification from 3 technical replicates of a representative experiment. Right, representative images of migrated cells. Values are presented as means ±SEM.
(C) Representative H&E images of distal metastasis from Figure 1B. Left panel, kidney metastasis; middle panel, liver metastasis; left panel, heart metastasis.
(D) Kaplan–Meier survival curves generated by comparing the mice used in the experiment shown in Figure 1B.
(E) Quantification of tumor masses obtained upon subcutaneous implantation of KPK or KP cells (n= 7 in each group) (see Figure 1C–D). Data are presented as means, and squares represent individual data points.
(F) Upregulation of Nrf2 transcriptional signature in sgKeap1 cells compared to sgTom cells.
(G) Experimental workflow of an isobaric multiplexed quantitative proteomics using Tandem Mass Tags to analyze the total proteome in KP and KPK cells as shown in (H).
(H) Volcano plot comparing the expression of HCMDB proteins and Bach1 signature proteins between KPK and KP cells. Plotted for each protein are the negative log10 of the p value and the log2 of the fold change of protein expression of KPK cells relative to KP cells. The red bars represent fold change values of −/+2, and the yellow bar represents a FDR threshold of 5%. Circle data points represent non-metastatic proteins (non-met); square data points represent metastatic proteins (met); gray data points represent non-Bach1 target proteins; green data points represent Bach1 target proteins. The enrichment of Metastatic proteins, Bach1 signature proteins, and Bach1-metastatic proteins was calculated by Fisher’s exact test. FC, fold change.
(I) Representative IHC staining of Bach1 in distal metastases (related to Figure 1A). Scale bar 100 μM.
(J) IHC analyses of Bach1 protein levels in LUAD PDXs carrying Keap1 mutant (n= 7) v. LUAD PDXs carrying WT Keap1 (n= 11). Keap1 status (WT or mutant) was confirmed in all tumor samples by targeted exome sequencing. Right, representative IHCs with low or high levels of Bach1. Bach1 levels increase in mutant-Keap1 v. WT Keap1 biopsies: p= 0.0128. Scale bar 100 μM.
Table S3. RNA-seq based differential expression analysis, Related to Figure 1. Transcriptomic profiling of differentially expressed transcripts in KPK v. KP cells.
Table S5. RNA-seq based differential expression analysis, Related to Figure 4. (A) Transcriptomic profiling of differentially expressed transcripts in KP siFbxo22 v. KP siCtrl cells. (B) Transcriptomic profiling of differentially expressed transcripts in KPK siFbxo22 v. KPK siCtrl cells.
Supplemental Figure 2 (Related to Figure 2). Keap1 loss promotes Bach1 accumulation through Nrf2-dependent induction of Ho1.
(A) HEK293T cells were transfected with either an empty vector (EV) or FLAG-tagged Keap1. Twenty-four hours post-transfection, cells were treated with MG132 for 3 hours and then collected for immunoprecipitation (IP) and immunoblotting. WCE, whole-cell extract.
(B) HEK293T cells were transfected with either an EV or FLAG-tagged Nrf2. Twenty-four hours post-transfection, cells were treated with MG132 for 3 hours, and then collected for immunoprecipitation (IP) and immunoblotting. WCE, whole-cell extract. l.ex., long exposure; s.ex., short exposure.
(C) Schematic representation of the Hmox1 genomic locus and gRNA target location. Exon 1 refers to the mouse Hmox1 gene (GRCm38/mm10; chr8:75,093,618-75,100,593).
(D) KP cells were treated with hemin (10μM), collected at the indicated times, lysed, and immunoblotted as indicated. Before hemin treatment, cells were pretreated for 30 minutes with TinPPIX (10μM) in the presence or absence of MLN4924 (2μM) as indicated. The * denotes a nonspecific band. l.ex., long exposure; s.ex., short exposure.
(E) KPK cells were treated with hemin (10μM), collected at the indicated times, lysed, and immunoblotted as indicated. Before hemin treatment, cells were pretreated for 30 minutes with TinPPIX (10μM) in the presence or absence of MLN4924 (2μM) as indicated.
Supplemental Figure 3 (Related to Figure 3). Fbxo22 mediates the heme-induced degradation of Bach1.
(A) FLAG-tagged human Bach1 was immunoprecipitated from HEK293T cells and subjected to mass spectrometry analysis. Where indicated, before harvesting, cells were treated for 1 hour with hemin (10 μM). The table lists the number of unique and total peptides for each Bach1 interacting protein that is a subunit of an ubiquitin ligase complex.
(B) HEK293T cells were transfected with FLAG-tagged Fbxo22. Twenty-four hours post-transfection, cells were treated with MLN4924 for 3 hours, collected for immunoprecipitation (IP) with either nonspecific IgG or an antibody against Bach1, treated with hemin (10μM) where indicated, and immunoblotted as indicated. l.ex., long exposure; s.ex., short exposure.
(C) A549 cells were transfected for 24 hours with either a non-targeting siRNA (siCtrl) or 2 different siRNA oligos targeting Fbxo22 (siFbxo22). Cells were then treated with either cycloheximide (CHX) or hemin, collected at the indicated times, lysed and immunoblotted as indicated. The * denotes a nonspecific band.
(D) H2009 cells were transfected for 24 hours with either siCtrl or 2 different siFbxo22. Cells were then treated with either CHX or hemin, collected at the indicated times, lysed and immunoblotted as indicated.
(E) KP cells were transfected for 24 hours with either siCtrl or 2 different siFbxo22. Cells were then treated with either CHX or hemin, collected at the indicated times, lysed and immunoblotted as indicated.
(F) A549 cells infected with lentiviruses expressing an shRNA targeting Fbxo22 (shFbxo22) under the control of a doxycycline-inducible promoter were treated (where indicated) with doxycycline for 24 hours. Cells were then treated with TinPPIX at the indicated concentrations for 24 hours, lysed and immunoblotted as indicated.
(G) Schematic representation of the Fbxo22 genomic locus and 2 different gRNA target locations. Exon 1 refers to the mouse Fbxo22 gene (GRCm38/mm10; chr9:55,208,935-55,224,433).
(H) The indicated proteins in KP-sgTom and KP-sgFbxo22 clones were analyzed by immunoblot. l.ex., long exposure; s.ex., short exposure.
(I) Two different KP-sgTom and 2 different KP-sgFbxo22 clones were treated with CHX, collected at the indicated times, lysed, and immunoblotted as indicated.
Supplemental Figure 4 (Related to Figure 3). Mapping of the Fbxo22 degron in Bach1.
(A) HEK293T cells were transfected with either an EV or the indicated FLAG-tagged proteins (i.e., wild type Bach1 or Bach1 mutants). Twenty-four hours post-transfection, cells were treated with MLN4924 for 3 hours before collection for immunoprecipitation (IP) and immunoblotting as indicated. WCE, whole-cell extract.
(B) The experiment was performed as described in (A), except that different Bach1 mutants were used. l.ex., long exposure; m.ex., medium exposure; s.ex., short exposure.
(C) The experiment was performed as described in (A), except that different Bach1 mutants were used. l.ex., long exposure; s.ex., short exposure.
(D) Alignment of the Bach1 aminoacidic sequence mediating the binding to Fbxo22 (amino acids 5 - 19 of human Bach1), across different Bach1 orthologs. Conserved residues are marked by two * and analog residues by one *.
(E) The experiment was performed as described in (A), except that different Bach1 mutants were used. WCE, whole-cell extract. l.ex., long exposure; s.ex., short exposure.
(F) Top, 3D structure of Bach1 BTB domain (PDB: 2IHC). 3D structure image was generated with ICM 3.8-4a (Molsoft LLC, La Jolla, CA). The 3 critical amino acids (F9, Y11 and S13) required for binding to Fbxo22 are highlighted in red. Bottom, the alignment of the aminoacidic sequence (degron motif) required for binding to Fbxo22, across Bach1 orthologs. The 3 critical amino acids (F9, Y11 and S13) required for binding to Fbxo22 are highlighted in red.
(G) Schematic representation of Bach1 mutants used in mapping experiments. The Bach1 mutants found to interact with Fbxo22 are indicated by the symbol “+”, “+/−” denotes reduced binding, and “− ”denotes undetectable binding.
Supplemental Figure 5 (Related to Figure 3). Fbxo22 mediates the heme-induced degradation of Bach1.
(A) A549 cells infected with lentiviruses expressing either FLAG-tagged WT Bach1 or Bach1(Y11F) under the control of a doxycycline-inducible promoter were treated (where indicated) with doxycycline for 24 hours. Doxycycline was then washed out to stop transcription and allow protein decay, and cells were collected at the indicated times, lysed, and immunoblotted as indicated. The graph shows the quantification of protein levels. Values are presented as means ±SEM. w-o, wash-out.
(B) H2009 cells infected with lentiviruses expressing either FLAG-tagged WT Bach1 or Bach1(Y11F) under the control of a doxycycline-inducible promoter were treated (where indicated) with doxycycline for 24 hours. Doxycycline was then washed out to stop transcription and allow protein decay, and cells were collected at the indicated times, lysed, and immunoblotted as indicated. The graph shows the quantification of protein levels. Values are presented as means ±SEM. l.ex., long exposure; s.ex., short exposure; w-o, wash-out.
(C) A549 cells infected with lentiviruses expressing either FLAG-tagged WT Bach1 or Bach1(Y11F) under the control of a doxycycline-inducible promoter were treated (where indicated) with doxycycline for 24 hours. Doxycycline was then washed out and, after 4 hours, cells were treated with hemin (10 μM), collected at the indicated times, lysed, and immunoblotted as indicated. The graph shows the quantification of protein levels. Values are presented as means ±SEM. l.ex., long exposure; s.ex., short exposure; w-o, wash-out.
(D) H2009 cells infected with lentiviruses expressing either FLAG-tagged WT Bach1 or Bach1(Y11F) under the control of a doxycycline-inducible promoter were treated (where indicated) with doxycycline for 24 hours. Doxycycline was then washed out and, after 4 hours, cells were treated with hemin (10 μM), collected at the indicated times, lysed, and immunoblotted as indicated. The graph shows the quantification of protein levels. Values are presented as means ±SEM. w-o, wash-out.
(E) A549 cells infected with lentiviruses expressing either FLAG-tagged WT Bach1 or Bach1(Y11F) under the control of a doxycycline-inducible promoter were transfected with either an EV or HA-tagged Fbxo22 as indicated. Cells were treated with doxycycline for 24 hours. Doxycycline was then washed out and, after 4 hours, cells were treated with CHX, collected at the indicated times, lysed, and immunoblotted as indicated. The graph shows the quantification of protein levels. Values are presented as means ±SEM. l.ex., long exposure; s.ex., short exposure.
(F) Schematic representation of the Bach1 genomic locus and 2 different gRNA target locations. Exon 2 refers to the mouse Bach1 gene (GRCm38/mm10; chr16:87,698,954-87,733,346).
(G) The indicated proteins in KP-sgTom and KP-sgBach1 clones were analyzed by immunoblot.
(H) KP-sgBach1 clone #4 was infected with lentiviruses expressing either an EV, FLAG-tagged WT Bach1, or Bach1(Y11F) under the control of a doxycycline-inducible promoter in combination with lentiviruses expressing either an EV or HA-tagged Fbxo22. Where indicated, cells were treated with doxycycline for 24 hours. Protein expression was analyzed by immunoblot with antibodies to the indicated proteins.
(I) Cells used in (H) were treated with doxycycline for 24 hours. Doxycycline was then washed out and, after 4 hours, cells were treated with CHX, collected at the indicated times, lysed, and immunoblotted as indicated. The graph shows the quantification of protein levels. Values are presented as means ±SEM.
Supplemental Figure 6 (Related to Figure 4). Bach1 levels regulate cell migration.
(A) Upregulation of Bach1 transcriptional signature in KP cells transfected with siFbxo22 compared to KP cells transfected with siCtrl.
(B) KP and KPK cells infected with lentiviruses expressing either a doxycycline-inducible non-targeting shRNA (shCtrl), 2 different shRNA targeting Bach1 (shBach1) or 2 different shRNA targeting Fbxo22 (shFbxo22) were treated with doxycycline for 48 hours (where indicated). Cells were then collected, lysed, and immunoblotted as indicated.
(C) KP and KPK cells generated as in (B) were treated with doxycycline for 48 hours. Cells were then treated with either vehicle, Ki696 (1 μM) or TinPPIX (10 μM) as indicated. After 24 hours, a scratch assay was performed over a 12 hours period. The graph shows quantification of the wound closure from 3 technical replicates of a representative experiment. Values are presented as means ±SEM.
(D) A549 cells infected with lentiviruses expressing either shCtrl, shBach1 or 2 different shFbxo22 under the control of a doxycycline-inducible promoter were treated with doxycycline for 48 hours. Cells were then treated with either vehicle or TinPPIX (10 μM) as indicated. After 24 hours, a scratch assay was performed over a 18 hours period. The graph shows quantification of the wound closure from 3 technical replicates of a representative experiment. Values are presented as means ±SEM. * indicate statistical significance obtained from comparing samples to the shCtrl untreated sample.
(E) Representative images of wound closure from the experiments quantified in (D).
(F) KP-sgTom, 2 different KP-sgBach1 clones (see Figure S5G), and 2 different KP-sgFbxo22 clones (see Figure S3H) were treated with either vehicle or Ki696 (1 μM) as indicated. After 24 hours, a scratch assay was performed over a 12 hours period. The graph shows quantification of the wound closure from 3 technical replicates of a representative experiment. Values are presented as means ±SD.
(G) Two different KP-sgTom and 2 different KP-sgFbxo22 clones (see Figure S3H ) were infected with lentiviruses expressing either shCtrl or shBach1 under the control of a doxycycline-inducible promoter. Where indicated, cells were treated with doxycycline for 48 hours. Cells were then collected, lysed, and immunoblotted as indicated.
(H) Two different KP-sgTom and 2 different KP-sgBach1 clones (see Figure S5G) were infected with lentiviruses expressing either shCtrl or shFbxo22 under the control of a doxycycline-inducible promoter. Where indicated, cells were treated with doxycycline for 48 hours. Cells were then collected, lysed, and immunoblotted as indicated.
Supplemental Figure 7 (Related to Figure 5 and 6). Bach1 promotes metastasis.
(A) Quantification of tumor masses obtained upon subcutaneous implantation of various KPK or KP cells described in the legend of Figure 5A. Values are presented as means ±SEM.
(B) Quantification of tumor burden (total tumor area/total lung area) in mice used for the experiment shown in Figure 5C. Data are presented as means, and symbols represent individual data points.
(C) Representative IHC staining of Bach1 and Fbxo22 in primary tumors from sgTom, sgKeap1, and sgFbxo22 mice used for the experiment shown in Figure 5C. Scale bar 100 μM.
(D) Quantification of tumor masses obtained upon subcutaneous implantation of various KP cells described in the legend of Figure 5D. Data are presented as means, and squares represent individual data points.
(E) Quantification of tumor masses obtained upon subcutaneous implantation of various KP cells described in the legend of Figure 5E. Data are presented as means, and squares represent individual data points.
(F) Quantification of tumor masses obtained upon subcutaneous implantation of various KP cells described in the legend of Figure 6A. Data are presented as means, and squares represent individual data points.
(G) Quantification of tumor masses obtained upon subcutaneous implantation of various KPK or KP cells described in the legend of Figure 6B. Data are presented as means, and squares represent individual data points.
Highlights.
Keap1 loss and Nrf2 activation induce metastasis in LUAD by accumulating Bach1
Nrf2 inhibits the Fbxo22-mediated degradation of Bach1 in a Ho1-dependent manner
Bach1 signature is associated with metastasis and shortened survival in LUAD patients
Ho1 inhibitors reduce LUAD metastasis in a Fbxo22- and Bach1-dependent manner
Acknowledgements
We thank L. Farina, A. Faustin, H. Shapiro and Y. Higa (for their help), H. Zhou (for bioinformatic support), W. Harper (for reagents), Craig Thomas (for providing Ki696) the NYU Genome Technology Center, the NYU Center for Biospecimen Research and Development (NCBRD), and the NYU Mass Spectrometric Facility (NMSF) (partially supported by the Cancer Center Support Grant P30CA016087). This work was funded by grants from the NIH to M.P., S.E.L (T32HL007151), NMSF (S10OD010582), and NCBRD (S10OD01058 and S10OD018338), and fellowships from the American Italian Cancer Foundation (AICF) and Associazione Italiana per la Ricerca sul Cancro co-funded by the European Union (AIRC/Marie Curie) to L.L. V.I.S was supported by the Wenner-Gren foundations and the Swedish Society of Medicine. T.P. is supported by NIH (grants K22CA201088; R37CA222504; R01CA227649) and American Cancer Society Research Scholar Grant (RSG-17-200-01-TBE). M.P. is grateful to T.M. Thor for continuous support. M.P. is an Investigator with the Howard Hughes Medical Institute.
Footnotes
Declaration of Interests
M.P. is a member of the advisory boards of Cullgen Inc. and Kymera Therapeutics. He is also a consultant for BeyondSpring Pharmaceuticals.
DATA AND SOFTWARE AVAILABILITY
The original mass spectrometry data will be accessed through the NYU Original Data Repository at Mass Spectrometry Interactive Virtual environment (MassIVE) accession # MSV000083157 (ftp://massive.ucsd.edu/MSV000083157) and the ProteomeXchange Consortium accession # PXD011818
The original RNA sequencing data will be accessed through the GEO Repository at https://urldefense.proofpoint.com/v2/url?u=https3A__www.ncbi.nlm.nih.gov_geo_query_acc.cgi3Facc-3DGSE122836&d=DwIEAg&c=slrrB7dE8n7gBJbeO0g-IQ&r=66vec01iN4ftNA4wFHOTg&m=S6nbNZAR9wRDox8TBpofg6Jj8oQQzxHA_Kt5380Uv9M&s=uRgK3hdVMVWlE8lP1SdH26pn3ymnC4SOXBUKXNGy0yE&e=Raw, uncropped supporting Western blot files were deposited at https://data.mendeley.com/datasets/m6vrdbwsnc/draft?a=42056e38–861b-41f1-a5c6–0fb9263327ff
Publisher's Disclaimer: This is a PDF file of an unedited manuscript that has been accepted for publication. As a service to our customers we are providing this early version of the manuscript. The manuscript will undergo copyediting, typesetting, and review of the resulting proof before it is published in its final citable form. Please note that during the production process errors may be discovered which could affect the content, and all legal disclaimers that apply to the journal pertain.
References
- Anders S, Pyl PT, and Huber W (2015). HTSeq--a Python framework to work with high-throughput sequencing data. Bioinformatics 31, 166–169. [DOI] [PMC free article] [PubMed] [Google Scholar]
- Bar J, Herbst RS, and Onn A (2008). Multitargeted inhibitors in lung cancer: new clinical data. Clin Lung Cancer 9 Suppl 3, S92–99. [DOI] [PubMed] [Google Scholar]
- Barbie DA, Tamayo P, Boehm JS, Kim SY, Moody SE, Dunn IF, Schinzel AC, Sandy P, Meylan E, Scholl C, et al. (2009). Systematic RNA interference reveals that oncogenic KRAS-driven cancers require TBK1. Nature 462, 108–112. [DOI] [PMC free article] [PubMed] [Google Scholar]
- Benjamini Y, Drai D, Elmer G, Kafkafi N, and Golani I (2001). Controlling the false discovery rate in behavior genetics research. Behav Brain Res 125, 279–284. [DOI] [PubMed] [Google Scholar]
- Bhardwaj A, Yang Y, Ueberheide B, and Smith S (2017). Whole proteome analysis of human tankyrase knockout cells reveals targets of tankyrase-mediated degradation. Nat Commun 8, 2214. [DOI] [PMC free article] [PubMed] [Google Scholar]
- Brady JJ, Chuang CH, Greenside PG, Rogers ZN, Murray CW, Caswell DR, Hartmann U, Connolly AJ, Sweet-Cordero EA, Kundaje A, et al. (2016). An Arntl2-Driven Secretome Enables Lung Adenocarcinoma Metastatic Self-Sufficiency. Cancer Cell 29, 697–710. [DOI] [PMC free article] [PubMed] [Google Scholar]
- Campbell JD, Alexandrov A, Kim J, Wala J, Berger AH, Pedamallu CS, Shukla SA, Guo G, Brooks AN, Murray BA, et al. (2016). Distinct patterns of somatic genome alterations in lung adenocarcinomas and squamous cell carcinomas. Nat Genet 48, 607–616. [DOI] [PMC free article] [PubMed] [Google Scholar]
- Cancer Genome Atlas Research, N. (2012). Comprehensive genomic characterization of squamous cell lung cancers. Nature 489, 519–525. [DOI] [PMC free article] [PubMed] [Google Scholar]
- Cancer Genome Atlas Research, N. (2014). Comprehensive molecular profiling of lung adenocarcinoma. Nature 511, 543–550. [DOI] [PMC free article] [PubMed] [Google Scholar]
- Carter SL, Cibulskis K, Helman E, McKenna A, Shen H, Zack T, Laird PW, Onofrio RC, Winckler W, Weir BA, et al. (2012). Absolute quantification of somatic DNA alterations in human cancer. Nat Biotechnol 30, 413–421. [DOI] [PMC free article] [PubMed] [Google Scholar]
- Caswell DR, Chuang CH, Yang D, Chiou SH, Cheemalavagu S, Kim-Kiselak C, Connolly A, and Winslow MM (2014). Obligate progression precedes lung adenocarcinoma dissemination. Cancer Discov 4, 781–789. [DOI] [PMC free article] [PubMed] [Google Scholar]
- Chuang CH, Greenside PG, Rogers ZN, Brady JJ, Yang D, Ma RK, Caswell DR, Chiou SH, Winters AF, Gruner BM, et al. (2017). Molecular definition of a metastatic lung cancer state reveals a targetable CD109-Janus kinase-Stat axis. Nat Med 23, 291–300. [DOI] [PMC free article] [PubMed] [Google Scholar]
- Cox J, and Mann M (2008). MaxQuant enables high peptide identification rates, individualized p.p.b.-range mass accuracies and proteome-wide protein quantification. Nat Biotechnol 26, 1367–1372. [DOI] [PubMed] [Google Scholar]
- Cox J, Neuhauser N, Michalski A, Scheltema RA, Olsen JV, and Mann M (2011). Andromeda: a peptide search engine integrated into the MaxQuant environment. J Proteome Res 10, 1794–1805. [DOI] [PubMed] [Google Scholar]
- Cristea IM, Williams R, Chait BT, and Rout MP (2005). Fluorescent proteins as proteomic probes. Mol Cell Proteomics 4, 1933–1941. [DOI] [PubMed] [Google Scholar]
- Davies TG, Wixted WE, Coyle JE, Griffiths-Jones C, Hearn K, McMenamin R, Norton D, Rich SJ, Richardson C, Saxty G, et al. (2016). Monoacidic Inhibitors of the Kelch-like ECH-Associated Protein 1: Nuclear Factor Erythroid 2-Related Factor 2 (KEAP1:NRF2) Protein-Protein Interaction with High Cell Potency Identified by Fragment-Based Discovery. J Med Chem 59, 3991–4006. [DOI] [PubMed] [Google Scholar]
- Dey S, Sayers CM, Verginadis II, Lehman SL, Cheng Y, Cerniglia GJ, Tuttle SW, Feldman MD, Zhang PJ, Fuchs SY, et al. (2015). ATF4-dependent induction of heme oxygenase 1 prevents anoikis and promotes metastasis. J Clin Invest 125, 2592–2608. [DOI] [PMC free article] [PubMed] [Google Scholar]
- Dimitrova N, Gocheva V, Bhutkar A, Resnick R, Jong RM, Miller KM, Bendor J, and Jacks T (2016). Stromal Expression of miR-143/145 Promotes Neoangiogenesis in Lung Cancer Development. Cancer Discov 6, 188–201. [DOI] [PMC free article] [PubMed] [Google Scholar]
- Dobin A, Davis CA, Schlesinger F, Drenkow J, Zaleski C, Jha S, Batut P, Chaisson M, and Gingeras TR (2013). STAR: ultrafast universal RNA-seq aligner. Bioinformatics 29, 15–21. [DOI] [PMC free article] [PubMed] [Google Scholar]
- Doi K, Akaike T, Fujii S, Tanaka S, Ikebe N, Beppu T, Shibahara S, Ogawa M, and Maeda H (1999). Induction of haem oxygenase-1 nitric oxide and ischaemia in experimental solid tumours and implications for tumour growth. Br J Cancer 80, 1945–1954. [DOI] [PMC free article] [PubMed] [Google Scholar]
- DuPage M, Dooley AL, and Jacks T (2009). Conditional mouse lung cancer models using adenoviral or lentiviral delivery of Cre recombinase. Nat Protoc 4, 1064–1072. [DOI] [PMC free article] [PubMed] [Google Scholar]
- Fang J, Sawa T, Akaike T, Akuta T, Sahoo SK, Khaled G, Hamada A, and Maeda H (2003). In vivo antitumor activity of pegylated zinc protoporphyrin: targeted inhibition of heme oxygenase in solid tumor. Cancer Res 63, 3567–3574. [PubMed] [Google Scholar]
- Fellmann C, Hoffmann T, Sridhar V, Hopfgartner B, Muhar M, Roth M, Lai DY, Barbosa IA, Kwon JS, Guan Y, et al. (2013). An optimized microRNA backbone for effective single-copy RNAi. Cell Rep 5, 1704–1713. [DOI] [PubMed] [Google Scholar]
- Goldstein LD, Lee J, Gnad F, Klijn C, Schaub A, Reeder J, Daemen A, Bakalarski CE, Holcomb T, Shames DS, et al. (2016). Recurrent Loss of NFE2L2 Exon 2 Is a Mechanism for Nrf2 Pathway Activation in Human Cancers. Cell Rep 16, 2605–2617. [DOI] [PubMed] [Google Scholar]
- Gozzelino R, Jeney V, and Soares MP (2010). Mechanisms of cell protection by heme oxygenase-1. Annu Rev Pharmacol Toxicol 50, 323–354. [DOI] [PubMed] [Google Scholar]
- Hanada N, Takahata T, Zhou Q, Ye X, Sun R, Itoh J, Ishiguro A, Kijima H, Mimura J, Itoh K, et al. (2012). Methylation of the KEAP1 gene promoter region in human colorectal cancer. BMC cancer 12, 66. [DOI] [PMC free article] [PubMed] [Google Scholar]
- Hiramoto K, Satoh H, Suzuki T, Moriguchi T, Pi J, Shimosegawa T, and Yamamoto M (2014). Myeloid lineage-specific deletion of antioxidant system enhances tumor metastasis. Cancer Prev Res (Phila) 7, 835–844. [DOI] [PubMed] [Google Scholar]
- Huttlin EL, Bruckner RJ, Paulo JA, Cannon JR, Ting L, Baltier K, Colby G, Gebreab F, Gygi MP, Parzen H, et al. (2017). Architecture of the human interactome defines protein communities and disease networks. Nature 545, 505–509. [DOI] [PMC free article] [PubMed] [Google Scholar]
- Jaramillo MC, and Zhang DD (2013). The emerging role of the Nrf2-Keap1 signaling pathway in cancer. Genes Dev 27, 2179–2191. [DOI] [PMC free article] [PubMed] [Google Scholar]
- Kinsella RJ, Kahari A, Haider S, Zamora J, Proctor G, Spudich G, Almeida-King J, Staines D, Derwent P, Kerhornou A, et al. (2011). Ensembl BioMarts: a hub for data retrieval across taxonomic space. Database (Oxford) 2011, bar030. [DOI] [PMC free article] [PubMed] [Google Scholar]
- Lee U, Frankenberger C, Yun J, Bevilacqua E, Caldas C, Chin SF, Rueda OM, Reinitz J, and Rosner MR (2013). A prognostic gene signature for metastasis-free survival of triple negative breast cancer patients. PLoS One 8, e82125. [DOI] [PMC free article] [PubMed] [Google Scholar]
- Li C, and Stocker R (2009). Heme oxygenase and iron: from bacteria to humans. Redox Rep 14, 95–101. [DOI] [PubMed] [Google Scholar]
- Liang Y, Wu H, Lei R, Chong RA, Wei Y, Lu X, Tagkopoulos I, Kung SY, Yang Q, Hu G, et al. (2012). Transcriptional network analysis identifies BACH1 as a master regulator of breast cancer bone metastasis. J Biol Chem 287, 33533–33544. [DOI] [PMC free article] [PubMed] [Google Scholar]
- Liberzon A, Subramanian A, Pinchback R, Thorvaldsdottir H, Tamayo P, and Mesirov JP (2011). Molecular signatures database (MSigDB) 3.0. Bioinformatics 27, 1739–1740. [DOI] [PMC free article] [PubMed] [Google Scholar]
- Love MI, Huber W, and Anders S (2014). Moderated estimation of fold change and dispersion for RNA-seq data with DESeq2. Genome Biol 15, 550. [DOI] [PMC free article] [PubMed] [Google Scholar]
- Malhotra D, Portales-Casamar E, Singh A, Srivastava S, Arenillas D, Happel C, Shyr C, Wakabayashi N, Kensler TW, Wasserman WW, et al. (2010). Global mapping of binding sites for Nrf2 identifies novel targets in cell survival response through ChIP-Seq profiling and network analysis. Nucleic Acids Res 38, 5718–5734. [DOI] [PMC free article] [PubMed] [Google Scholar]
- Mena EL, Kjolby RAS, Saxton RA, Werner A, Lew BG, Boyle JM, Harland R, and Rape M (2018). Dimerization quality control ensures neuronal development and survival. Science 362. [DOI] [PubMed] [Google Scholar]
- Mense SM, and Zhang L (2006). Heme: a versatile signaling molecule controlling the activities of diverse regulators ranging from transcription factors to MAP kinases. Cell Res 16, 681–692. [DOI] [PubMed] [Google Scholar]
- Mootha VK, Lindgren CM, Eriksson KF, Subramanian A, Sihag S, Lehar J, Puigserver P, Carlsson E, Ridderstrale M, Laurila E, et al. (2003). PGC-1alpha-responsive genes involved in oxidative phosphorylation are coordinately downregulated in human diabetes. Nat Genet 34, 267–273. [DOI] [PubMed] [Google Scholar]
- Morita T, Perrella MA, Lee ME, and Kourembanas S (1995). Smooth muscle cell-derived carbon monoxide is a regulator of vascular cGMP. Proc Natl Acad Sci U S A 92, 1475–1479. [DOI] [PMC free article] [PubMed] [Google Scholar]
- Muscarella LA, Barbano R, D’Angelo V, Copetti M, Coco M, Balsamo T, la Torre A, Notarangelo A, Troiano M, Parisi S, et al. (2011). Regulation of KEAP1 expression by promoter methylation in malignant gliomas and association with patient’s outcome. Epigenetics 6, 317–325. [DOI] [PMC free article] [PubMed] [Google Scholar]
- Ogawa K, Sun J, Taketani S, Nakajima O, Nishitani C, Sassa S, Hayashi N, Yamamoto M, Shibahara S, Fujita H, et al. (2001). Heme mediates derepression of Maf recognition element through direct binding to transcription repressor Bach1. EMBO J 20, 2835–2843. [DOI] [PMC free article] [PubMed] [Google Scholar]
- Orthwein A, Noordermeer SM, Wilson MD, Landry S, Enchev RI, Sherker A, Munro M, Pinder J, Salsman J, Dellaire G, et al. (2015). A mechanism for the suppression of homologous recombination in G1 cells. Nature 528, 422–426. [DOI] [PMC free article] [PubMed] [Google Scholar]
- Oyake T, Itoh K, Motohashi H, Hayashi N, Hoshino H, Nishizawa M, Yamamoto M, and Igarashi K (1996). Bach proteins belong to a novel family of BTB-basic leucine zipper transcription factors that interact with MafK and regulate transcription through the NF-E2 site. Mol Cell Biol 16, 6083–6095. [DOI] [PMC free article] [PubMed] [Google Scholar]
- Pagan JK, Marzio A, Jones MJ, Saraf A, Jallepalli PV, Florens L, Washburn MP, and Pagano M (2015). Degradation of Cep68 and PCNT cleavage mediate Cep215 removal from the PCM to allow centriole separation, disengagement and licensing. Nat Cell Biol 17, 31–43. [DOI] [PMC free article] [PubMed] [Google Scholar]
- Pamplona A, Ferreira A, Balla J, Jeney V, Balla G, Epiphanio S, Chora A, Rodrigues CD, Gregoire IP, Cunha-Rodrigues M, et al. (2007). Heme oxygenase-1 and carbon monoxide suppress the pathogenesis of experimental cerebral malaria. Nat Med 13, 703–710. [DOI] [PubMed] [Google Scholar]
- Ran FA, Hsu PD, Wright J, Agarwala V, Scott DA, and Zhang F (2013). Genome engineering using the CRISPR-Cas9 system. Nat Protoc 8, 2281–2308. [DOI] [PMC free article] [PubMed] [Google Scholar]
- Reichard JF, Motz GT, and Puga A (2007). Heme oxygenase-1 induction by NRF2 requires inactivation of the transcriptional repressor BACH1. Nucleic Acids Res 35, 7074–7086. [DOI] [PMC free article] [PubMed] [Google Scholar]
- Rojo de la Vega M, Chapman E, and Zhang DD (2018). NRF2 and the Hallmarks of Cancer. Cancer Cell 34, 21–43. [DOI] [PMC free article] [PubMed] [Google Scholar]
- Romero R, Sayin VI, Davidson SM, Bauer MR, Singh SX, LeBoeuf SE, Karakousi TR, Ellis DC, Bhutkar A, Sanchez-Rivera FJ, et al. (2017). Keap1 loss promotes Kras-driven lung cancer and results in dependence on glutaminolysis. Nat Med 23, 1362–1368. [DOI] [PMC free article] [PubMed] [Google Scholar]
- Sanchez-Rivera FJ, Papagiannakopoulos T, Romero R, Tammela T, Bauer MR, Bhutkar A, Joshi NS, Subbaraj L, Bronson RT, Xue W, et al. (2014). Rapid modelling of cooperating genetic events in cancer through somatic genome editing. Nature 516, 428–431. [DOI] [PMC free article] [PubMed] [Google Scholar]
- Sayin VI, LeBoeuf SE, Singh SX, Davidson SM, Biancur D, Guzelhan BS, Alvarez SW, Wu WL, Karakousi TR, Zavitsanou AM, et al. (2017). Activation of the NRF2 antioxidant program generates an imbalance in central carbon metabolism in cancer. eLife 6. [DOI] [PMC free article] [PubMed] [Google Scholar]
- Shang FT, Hui LL, An XS, Zhang XC, Guo SG, and Kui Z (2015). ZnPPIX inhibits peritoneal metastasis of gastric cancer via its antiangiogenic activity. Biomed Pharmacother 71, 240–246. [DOI] [PubMed] [Google Scholar]
- Smith CL, Blake JA, Kadin JA, Richardson JE, Bult CJ, and Mouse Genome Database G (2018). Mouse Genome Database (MGD)-2018: knowledgebase for the laboratory mouse. Nucleic Acids Res 46, D836–D842. [DOI] [PMC free article] [PubMed] [Google Scholar]
- Subramanian A, Tamayo P, Mootha VK, Mukherjee S, Ebert BL, Gillette MA, Paulovich A, Pomeroy SL, Golub TR, Lander ES, et al. (2005). Gene set enrichment analysis: a knowledge-based approach for interpreting genome-wide expression profiles. Proc Natl Acad Sci U S A 102, 15545–15550. [DOI] [PMC free article] [PubMed] [Google Scholar]
- Sun J, Brand M, Zenke Y, Tashiro S, Groudine M, and Igarashi K (2004). Heme regulates the dynamic exchange of Bach1 and NF-E2-related factors in the Maf transcription factor network. Proc Natl Acad Sci U S A 101, 1461–1466. [DOI] [PMC free article] [PubMed] [Google Scholar]
- Sun J, Hoshino H, Takaku K, Nakajima O, Muto A, Suzuki H, Tashiro S, Takahashi S, Shibahara S, Alam J, et al. (2002). Hemoprotein Bach1 regulates enhancer availability of heme oxygenase-1 gene. EMBO J 21, 5216–5224. [DOI] [PMC free article] [PubMed] [Google Scholar]
- Sunamura M, Duda DG, Ghattas MH, Lozonschi L, Motoi F, Yamauchi J, Matsuno S, Shibahara S, and Abraham NG (2003). Heme oxygenase-1 accelerates tumor angiogenesis of human pancreatic cancer. Angiogenesis 6, 15–24. [DOI] [PubMed] [Google Scholar]
- Suzuki T, and Yamamoto M (2015). Molecular basis of the Keap1-Nrf2 system. Free Radic Biol Med 88, 93–100. [DOI] [PubMed] [Google Scholar]
- Tan MK, Lim HJ, Bennett EJ, Shi Y, and Harper JW (2013). Parallel SCF adaptor capture proteomics reveals a role for SCFFBXL17 in NRF2 activation via BACH1 repressor turnover. Mol Cell 52, 9–24. [DOI] [PMC free article] [PubMed] [Google Scholar]
- Tanaka S, Akaike T, Fang J, Beppu T, Ogawa M, Tamura F, Miyamoto Y, and Maeda H (2003). Antiapoptotic effect of haem oxygenase-1 induced by nitric oxide in experimental solid tumour. Br J Cancer 88, 902–909. [DOI] [PMC free article] [PubMed] [Google Scholar]
- Tebay LE, Robertson H, Durant ST, Vitale SR, Penning TM, Dinkova-Kostova AT, and Hayes JD (2015). Mechanisms of activation of the transcription factor Nrf2 by redox stressors, nutrient cues, and energy status and the pathways through which it attenuates degenerative disease. Free Radic Biol Med 88, 108–146. [DOI] [PMC free article] [PubMed] [Google Scholar]
- The UniProt C (2017). UniProt: the universal protein knowledgebase. Nucleic Acids Res 45, D158–D169. [DOI] [PMC free article] [PubMed] [Google Scholar]
- Thompson A, Schafer J, Kuhn K, Kienle S, Schwarz J, Schmidt G, Neumann T, Johnstone R, Mohammed AK, and Hamon C (2003). Tandem mass tags: a novel quantification strategy for comparative analysis of complex protein mixtures by MS/MS. Anal Chem 75, 1895–1904. [DOI] [PubMed] [Google Scholar]
- Wang H, Liu X, Long M, Huang Y, Zhang L, Zhang R, Zheng Y, Liao X, Wang Y, Liao Q, et al. (2016). NRF2 activation by antioxidant antidiabetic agents accelerates tumor metastasis. Sci Transl Med 8, 334ra351. [DOI] [PubMed] [Google Scholar]
- Warnatz HJ, Schmidt D, Manke T, Piccini I, Sultan M, Borodina T, Balzereit D, Wruck W, Soldatov A, Vingron M, et al. (2011). The BTB and CNC homology 1 (BACH1) target genes are involved in the oxidative stress response and in control of the cell cycle. J Biol Chem 286, 23521–23532. [DOI] [PMC free article] [PubMed] [Google Scholar]
- Was H, Cichon T, Smolarczyk R, Rudnicka D, Stopa M, Chevalier C, Leger JJ, Lackowska B, Grochot A, Bojkowska K, et al. (2006). Overexpression of heme oxygenase-1 in murine melanoma: increased proliferation and viability of tumor cells, decreased survival of mice. Am J Pathol 169, 2181–2198. [DOI] [PMC free article] [PubMed] [Google Scholar]
- Wiel C, Le Gal K, Ibrahim MX., Jahangir CA., Kashif M, Ziegler DV, Xu X, Ghosh T, Mondal T, Kanduri C, Lindahl P, Sayin VI, and Bergo MO (2019). BACH1 Stabilization by Antioxidants Stimulates Lung Cancer Metastasis Cell In press. [DOI] [PubMed]
- Winslow MM, Dayton TL, Verhaak RG, Kim-Kiselak C, Snyder EL, Feldser DM, Hubbard DD, DuPage MJ, Whittaker CA, Hoersch S, et al. (2011). Suppression of lung adenocarcinoma progression by Nkx2–1. Nature 473, 101–104. [DOI] [PMC free article] [PubMed] [Google Scholar]
- Yun J, Frankenberger CA, Kuo WL, Boelens MC, Eves EM, Cheng N, Liang H, Li WH, Ishwaran H, Minn AJ, et al. (2011). Signalling pathway for RKIP and Let-7 regulates and predicts metastatic breast cancer. EMBO J 30, 4500–4514. [DOI] [PMC free article] [PubMed] [Google Scholar]
- Zenke-Kawasaki Y, Dohi Y, Katoh Y, Ikura T, Ikura M, Asahara T, Tokunaga F, Iwai K, and Igarashi K (2007). Heme induces ubiquitination and degradation of the transcription factor Bach1. Mol Cell Biol 27, 6962–6971. [DOI] [PMC free article] [PubMed] [Google Scholar]
- Zerbino DR, Achuthan P, Akanni W, Amode MR, Barrell D, Bhai J, Billis K, Cummins C, Gall A, Giron CG, et al. (2018). Ensembl 2018. Nucleic Acids Res 46, D754–D761. [DOI] [PMC free article] [PubMed] [Google Scholar]
- Zhang L, Wang N, Zhou S, Ye W, Jing G, and Zhang M (2012). Propofol induces proliferation and invasion of gallbladder cancer cells through activation of Nrf2. J Exp Clin Cancer Res 31, 66. [DOI] [PMC free article] [PubMed] [Google Scholar]
- Zhang M, Zhang C, Zhang L, Yang Q, Zhou S, Wen Q, and Wang J (2015). Nrf2 is a potential prognostic marker and promotes proliferation and invasion in human hepatocellular carcinoma. BMC cancer 15, 531. [DOI] [PMC free article] [PubMed] [Google Scholar]
- Zheng G, Ma Y, Zou Y, Yin A, Li W, and Dong D (2018). HCMDB: the human cancer metastasis database. Nucleic Acids Res 46, D950–D955. [DOI] [PMC free article] [PubMed] [Google Scholar]
Associated Data
This section collects any data citations, data availability statements, or supplementary materials included in this article.
Supplementary Materials
Supplemental Figure 1 (Related to Figure 1). Keap1 loss promotes cell migration, metastasis, and activation of the Bach1 transcriptional program.
(A) A scratch assay was performed over a 12 hours period using KP and KPK cells. The graph shows quantification of the wound closure from 3 technical replicates of a representative experiment. Values are presented as means ±SEM.
(B) KP and KPK cells were tested for cell migration in a Boyden chamber assay over a 12 hours period. After this time, cells migrated to the bottom of the transwells were fixed, stained, photographed, and counted in 5 different fields/well. The graph shows quantification from 3 technical replicates of a representative experiment. Right, representative images of migrated cells. Values are presented as means ±SEM.
(C) Representative H&E images of distal metastasis from Figure 1B. Left panel, kidney metastasis; middle panel, liver metastasis; left panel, heart metastasis.
(D) Kaplan–Meier survival curves generated by comparing the mice used in the experiment shown in Figure 1B.
(E) Quantification of tumor masses obtained upon subcutaneous implantation of KPK or KP cells (n= 7 in each group) (see Figure 1C–D). Data are presented as means, and squares represent individual data points.
(F) Upregulation of Nrf2 transcriptional signature in sgKeap1 cells compared to sgTom cells.
(G) Experimental workflow of an isobaric multiplexed quantitative proteomics using Tandem Mass Tags to analyze the total proteome in KP and KPK cells as shown in (H).
(H) Volcano plot comparing the expression of HCMDB proteins and Bach1 signature proteins between KPK and KP cells. Plotted for each protein are the negative log10 of the p value and the log2 of the fold change of protein expression of KPK cells relative to KP cells. The red bars represent fold change values of −/+2, and the yellow bar represents a FDR threshold of 5%. Circle data points represent non-metastatic proteins (non-met); square data points represent metastatic proteins (met); gray data points represent non-Bach1 target proteins; green data points represent Bach1 target proteins. The enrichment of Metastatic proteins, Bach1 signature proteins, and Bach1-metastatic proteins was calculated by Fisher’s exact test. FC, fold change.
(I) Representative IHC staining of Bach1 in distal metastases (related to Figure 1A). Scale bar 100 μM.
(J) IHC analyses of Bach1 protein levels in LUAD PDXs carrying Keap1 mutant (n= 7) v. LUAD PDXs carrying WT Keap1 (n= 11). Keap1 status (WT or mutant) was confirmed in all tumor samples by targeted exome sequencing. Right, representative IHCs with low or high levels of Bach1. Bach1 levels increase in mutant-Keap1 v. WT Keap1 biopsies: p= 0.0128. Scale bar 100 μM.
Table S3. RNA-seq based differential expression analysis, Related to Figure 1. Transcriptomic profiling of differentially expressed transcripts in KPK v. KP cells.
Table S5. RNA-seq based differential expression analysis, Related to Figure 4. (A) Transcriptomic profiling of differentially expressed transcripts in KP siFbxo22 v. KP siCtrl cells. (B) Transcriptomic profiling of differentially expressed transcripts in KPK siFbxo22 v. KPK siCtrl cells.
Supplemental Figure 2 (Related to Figure 2). Keap1 loss promotes Bach1 accumulation through Nrf2-dependent induction of Ho1.
(A) HEK293T cells were transfected with either an empty vector (EV) or FLAG-tagged Keap1. Twenty-four hours post-transfection, cells were treated with MG132 for 3 hours and then collected for immunoprecipitation (IP) and immunoblotting. WCE, whole-cell extract.
(B) HEK293T cells were transfected with either an EV or FLAG-tagged Nrf2. Twenty-four hours post-transfection, cells were treated with MG132 for 3 hours, and then collected for immunoprecipitation (IP) and immunoblotting. WCE, whole-cell extract. l.ex., long exposure; s.ex., short exposure.
(C) Schematic representation of the Hmox1 genomic locus and gRNA target location. Exon 1 refers to the mouse Hmox1 gene (GRCm38/mm10; chr8:75,093,618-75,100,593).
(D) KP cells were treated with hemin (10μM), collected at the indicated times, lysed, and immunoblotted as indicated. Before hemin treatment, cells were pretreated for 30 minutes with TinPPIX (10μM) in the presence or absence of MLN4924 (2μM) as indicated. The * denotes a nonspecific band. l.ex., long exposure; s.ex., short exposure.
(E) KPK cells were treated with hemin (10μM), collected at the indicated times, lysed, and immunoblotted as indicated. Before hemin treatment, cells were pretreated for 30 minutes with TinPPIX (10μM) in the presence or absence of MLN4924 (2μM) as indicated.
Supplemental Figure 3 (Related to Figure 3). Fbxo22 mediates the heme-induced degradation of Bach1.
(A) FLAG-tagged human Bach1 was immunoprecipitated from HEK293T cells and subjected to mass spectrometry analysis. Where indicated, before harvesting, cells were treated for 1 hour with hemin (10 μM). The table lists the number of unique and total peptides for each Bach1 interacting protein that is a subunit of an ubiquitin ligase complex.
(B) HEK293T cells were transfected with FLAG-tagged Fbxo22. Twenty-four hours post-transfection, cells were treated with MLN4924 for 3 hours, collected for immunoprecipitation (IP) with either nonspecific IgG or an antibody against Bach1, treated with hemin (10μM) where indicated, and immunoblotted as indicated. l.ex., long exposure; s.ex., short exposure.
(C) A549 cells were transfected for 24 hours with either a non-targeting siRNA (siCtrl) or 2 different siRNA oligos targeting Fbxo22 (siFbxo22). Cells were then treated with either cycloheximide (CHX) or hemin, collected at the indicated times, lysed and immunoblotted as indicated. The * denotes a nonspecific band.
(D) H2009 cells were transfected for 24 hours with either siCtrl or 2 different siFbxo22. Cells were then treated with either CHX or hemin, collected at the indicated times, lysed and immunoblotted as indicated.
(E) KP cells were transfected for 24 hours with either siCtrl or 2 different siFbxo22. Cells were then treated with either CHX or hemin, collected at the indicated times, lysed and immunoblotted as indicated.
(F) A549 cells infected with lentiviruses expressing an shRNA targeting Fbxo22 (shFbxo22) under the control of a doxycycline-inducible promoter were treated (where indicated) with doxycycline for 24 hours. Cells were then treated with TinPPIX at the indicated concentrations for 24 hours, lysed and immunoblotted as indicated.
(G) Schematic representation of the Fbxo22 genomic locus and 2 different gRNA target locations. Exon 1 refers to the mouse Fbxo22 gene (GRCm38/mm10; chr9:55,208,935-55,224,433).
(H) The indicated proteins in KP-sgTom and KP-sgFbxo22 clones were analyzed by immunoblot. l.ex., long exposure; s.ex., short exposure.
(I) Two different KP-sgTom and 2 different KP-sgFbxo22 clones were treated with CHX, collected at the indicated times, lysed, and immunoblotted as indicated.
Supplemental Figure 4 (Related to Figure 3). Mapping of the Fbxo22 degron in Bach1.
(A) HEK293T cells were transfected with either an EV or the indicated FLAG-tagged proteins (i.e., wild type Bach1 or Bach1 mutants). Twenty-four hours post-transfection, cells were treated with MLN4924 for 3 hours before collection for immunoprecipitation (IP) and immunoblotting as indicated. WCE, whole-cell extract.
(B) The experiment was performed as described in (A), except that different Bach1 mutants were used. l.ex., long exposure; m.ex., medium exposure; s.ex., short exposure.
(C) The experiment was performed as described in (A), except that different Bach1 mutants were used. l.ex., long exposure; s.ex., short exposure.
(D) Alignment of the Bach1 aminoacidic sequence mediating the binding to Fbxo22 (amino acids 5 - 19 of human Bach1), across different Bach1 orthologs. Conserved residues are marked by two * and analog residues by one *.
(E) The experiment was performed as described in (A), except that different Bach1 mutants were used. WCE, whole-cell extract. l.ex., long exposure; s.ex., short exposure.
(F) Top, 3D structure of Bach1 BTB domain (PDB: 2IHC). 3D structure image was generated with ICM 3.8-4a (Molsoft LLC, La Jolla, CA). The 3 critical amino acids (F9, Y11 and S13) required for binding to Fbxo22 are highlighted in red. Bottom, the alignment of the aminoacidic sequence (degron motif) required for binding to Fbxo22, across Bach1 orthologs. The 3 critical amino acids (F9, Y11 and S13) required for binding to Fbxo22 are highlighted in red.
(G) Schematic representation of Bach1 mutants used in mapping experiments. The Bach1 mutants found to interact with Fbxo22 are indicated by the symbol “+”, “+/−” denotes reduced binding, and “− ”denotes undetectable binding.
Supplemental Figure 5 (Related to Figure 3). Fbxo22 mediates the heme-induced degradation of Bach1.
(A) A549 cells infected with lentiviruses expressing either FLAG-tagged WT Bach1 or Bach1(Y11F) under the control of a doxycycline-inducible promoter were treated (where indicated) with doxycycline for 24 hours. Doxycycline was then washed out to stop transcription and allow protein decay, and cells were collected at the indicated times, lysed, and immunoblotted as indicated. The graph shows the quantification of protein levels. Values are presented as means ±SEM. w-o, wash-out.
(B) H2009 cells infected with lentiviruses expressing either FLAG-tagged WT Bach1 or Bach1(Y11F) under the control of a doxycycline-inducible promoter were treated (where indicated) with doxycycline for 24 hours. Doxycycline was then washed out to stop transcription and allow protein decay, and cells were collected at the indicated times, lysed, and immunoblotted as indicated. The graph shows the quantification of protein levels. Values are presented as means ±SEM. l.ex., long exposure; s.ex., short exposure; w-o, wash-out.
(C) A549 cells infected with lentiviruses expressing either FLAG-tagged WT Bach1 or Bach1(Y11F) under the control of a doxycycline-inducible promoter were treated (where indicated) with doxycycline for 24 hours. Doxycycline was then washed out and, after 4 hours, cells were treated with hemin (10 μM), collected at the indicated times, lysed, and immunoblotted as indicated. The graph shows the quantification of protein levels. Values are presented as means ±SEM. l.ex., long exposure; s.ex., short exposure; w-o, wash-out.
(D) H2009 cells infected with lentiviruses expressing either FLAG-tagged WT Bach1 or Bach1(Y11F) under the control of a doxycycline-inducible promoter were treated (where indicated) with doxycycline for 24 hours. Doxycycline was then washed out and, after 4 hours, cells were treated with hemin (10 μM), collected at the indicated times, lysed, and immunoblotted as indicated. The graph shows the quantification of protein levels. Values are presented as means ±SEM. w-o, wash-out.
(E) A549 cells infected with lentiviruses expressing either FLAG-tagged WT Bach1 or Bach1(Y11F) under the control of a doxycycline-inducible promoter were transfected with either an EV or HA-tagged Fbxo22 as indicated. Cells were treated with doxycycline for 24 hours. Doxycycline was then washed out and, after 4 hours, cells were treated with CHX, collected at the indicated times, lysed, and immunoblotted as indicated. The graph shows the quantification of protein levels. Values are presented as means ±SEM. l.ex., long exposure; s.ex., short exposure.
(F) Schematic representation of the Bach1 genomic locus and 2 different gRNA target locations. Exon 2 refers to the mouse Bach1 gene (GRCm38/mm10; chr16:87,698,954-87,733,346).
(G) The indicated proteins in KP-sgTom and KP-sgBach1 clones were analyzed by immunoblot.
(H) KP-sgBach1 clone #4 was infected with lentiviruses expressing either an EV, FLAG-tagged WT Bach1, or Bach1(Y11F) under the control of a doxycycline-inducible promoter in combination with lentiviruses expressing either an EV or HA-tagged Fbxo22. Where indicated, cells were treated with doxycycline for 24 hours. Protein expression was analyzed by immunoblot with antibodies to the indicated proteins.
(I) Cells used in (H) were treated with doxycycline for 24 hours. Doxycycline was then washed out and, after 4 hours, cells were treated with CHX, collected at the indicated times, lysed, and immunoblotted as indicated. The graph shows the quantification of protein levels. Values are presented as means ±SEM.
Supplemental Figure 6 (Related to Figure 4). Bach1 levels regulate cell migration.
(A) Upregulation of Bach1 transcriptional signature in KP cells transfected with siFbxo22 compared to KP cells transfected with siCtrl.
(B) KP and KPK cells infected with lentiviruses expressing either a doxycycline-inducible non-targeting shRNA (shCtrl), 2 different shRNA targeting Bach1 (shBach1) or 2 different shRNA targeting Fbxo22 (shFbxo22) were treated with doxycycline for 48 hours (where indicated). Cells were then collected, lysed, and immunoblotted as indicated.
(C) KP and KPK cells generated as in (B) were treated with doxycycline for 48 hours. Cells were then treated with either vehicle, Ki696 (1 μM) or TinPPIX (10 μM) as indicated. After 24 hours, a scratch assay was performed over a 12 hours period. The graph shows quantification of the wound closure from 3 technical replicates of a representative experiment. Values are presented as means ±SEM.
(D) A549 cells infected with lentiviruses expressing either shCtrl, shBach1 or 2 different shFbxo22 under the control of a doxycycline-inducible promoter were treated with doxycycline for 48 hours. Cells were then treated with either vehicle or TinPPIX (10 μM) as indicated. After 24 hours, a scratch assay was performed over a 18 hours period. The graph shows quantification of the wound closure from 3 technical replicates of a representative experiment. Values are presented as means ±SEM. * indicate statistical significance obtained from comparing samples to the shCtrl untreated sample.
(E) Representative images of wound closure from the experiments quantified in (D).
(F) KP-sgTom, 2 different KP-sgBach1 clones (see Figure S5G), and 2 different KP-sgFbxo22 clones (see Figure S3H) were treated with either vehicle or Ki696 (1 μM) as indicated. After 24 hours, a scratch assay was performed over a 12 hours period. The graph shows quantification of the wound closure from 3 technical replicates of a representative experiment. Values are presented as means ±SD.
(G) Two different KP-sgTom and 2 different KP-sgFbxo22 clones (see Figure S3H ) were infected with lentiviruses expressing either shCtrl or shBach1 under the control of a doxycycline-inducible promoter. Where indicated, cells were treated with doxycycline for 48 hours. Cells were then collected, lysed, and immunoblotted as indicated.
(H) Two different KP-sgTom and 2 different KP-sgBach1 clones (see Figure S5G) were infected with lentiviruses expressing either shCtrl or shFbxo22 under the control of a doxycycline-inducible promoter. Where indicated, cells were treated with doxycycline for 48 hours. Cells were then collected, lysed, and immunoblotted as indicated.
Supplemental Figure 7 (Related to Figure 5 and 6). Bach1 promotes metastasis.
(A) Quantification of tumor masses obtained upon subcutaneous implantation of various KPK or KP cells described in the legend of Figure 5A. Values are presented as means ±SEM.
(B) Quantification of tumor burden (total tumor area/total lung area) in mice used for the experiment shown in Figure 5C. Data are presented as means, and symbols represent individual data points.
(C) Representative IHC staining of Bach1 and Fbxo22 in primary tumors from sgTom, sgKeap1, and sgFbxo22 mice used for the experiment shown in Figure 5C. Scale bar 100 μM.
(D) Quantification of tumor masses obtained upon subcutaneous implantation of various KP cells described in the legend of Figure 5D. Data are presented as means, and squares represent individual data points.
(E) Quantification of tumor masses obtained upon subcutaneous implantation of various KP cells described in the legend of Figure 5E. Data are presented as means, and squares represent individual data points.
(F) Quantification of tumor masses obtained upon subcutaneous implantation of various KP cells described in the legend of Figure 6A. Data are presented as means, and squares represent individual data points.
(G) Quantification of tumor masses obtained upon subcutaneous implantation of various KPK or KP cells described in the legend of Figure 6B. Data are presented as means, and squares represent individual data points.