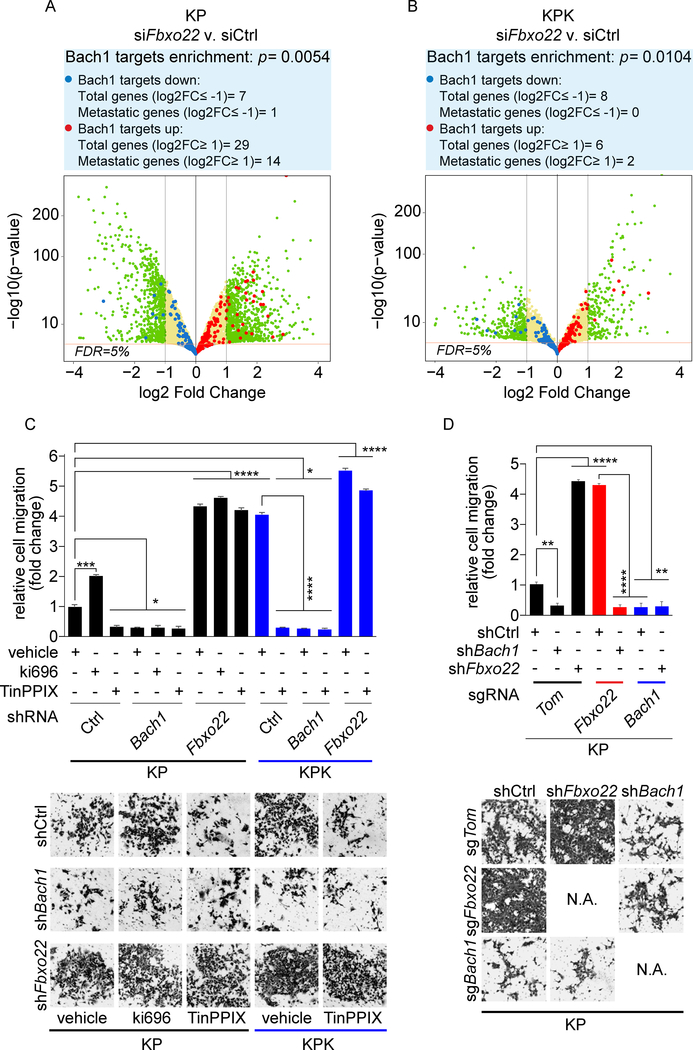
Figure 4. Fbxo22 depletion activates Bach1 transcriptional program and promotes cell migration.
(A) Volcano plot comparing the expression of Bach1 signature genes in KP cells transfected with either a non-targeting siRNA (siCtrl) or siFbxo22. Plotted for each gene are the negative log10 of the p value and the log2 of the fold change of gene expression of KP-siFbxo22 cells relative to KP-siCtrl cells. The green dots represent genes with fold change values of −/+ 2, and the red bar represents a FDR threshold of 5%. The blue dots represent down-regulated Bach1 target genes, while the red dots represent upregulated Bach1 target genes. The enrichment of transcripts was calculated considering the transcripts with at least 2 fold change at 5% FDR.
(B) The experiment was performed as in (A), except that the volcano plot compares the expression of Bach1 signature genes in KPK-siFbxo22 cells v. KPK-siCtrl cells.
(C) KP and KPK cells infected with lentiviruses expressing either a dox-inducible, non-targeting shRNA (shCtrl) or shRNAs targeting either Bach1 (shBach1) or Fbxo22 (shFbxo22). Forty-eight hours after dox induction, cells were treated with either Ki696 or TinPPIX for 24 hours. Cells were then tested for migration in a Boyden chamber assay over a 12 hours period. Next, cells migrated on the bottom of the transwells were fixed, stained and counted in 5 different fields/well. The graph shows quantification from 3 technical replicates of a representative experiment. Bottom, representative images of migrated cells. Values are presented as means ±SEM.
(D) KP-sgTom, KP-sgFbxo22, and KP-sgBach1 cells transduced with lentiviruses expressing either a dox-inducible shCtrl, shBach1, or shFbxo22 were treated with dox for 72 hours and tested for migration as in (C). Values are presented as means ±SEM.

