Abstract
An important component of cellular biochemistry is the concentration of proteins and nucleic acids in non-membranous compartments1,2. These biomolecular condensates are formed from processes including liquid-liquid phase separation (LLPS). The multivalent interactions necessary for LLPS have been studied extensively in vitro 1,3. However, what regulates LLPS in vivo is still poorly understood. Here, we identify an in vivo regulator of LLPS through a genetic suppressor screen for loss of function of the Arabidopsis RNA-binding protein FCA. FCA contains prion-like domains that phase-separate in vitro, and exhibits behavior in vivo consistent with phase separation. The mutant screen identified a functional requirement for a coiled coil protein, FLL2, in FCA nuclear body formation. FCA reduces transcriptional read-through by promoting proximal polyadenylation at many sites in the Arabidopsis genome3,4. FLL2 was required to promote this proximal polyadenylation, but not binding of FCA to target RNA. Ectopic expression of FLL2 increased the size and number of FCA nuclear bodies. Crosslinking with formaldehyde captured in vivo interactions between FLL2, FCA and the polymerase and nuclease modules of the RNA 3’ end processing machinery. These 3’ RNA processing components were found to colocalize with FCA in the nuclear bodies in vivo. We conclude that FLL2 promotes liquid-liquid phase separation, important for dynamics of polyadenylation complexes at specific poly A sites. Our findings show that coiled coil proteins can promote LLPS, expanding our understanding of the principles governing the in vivo dynamics of liquid-like bodies.
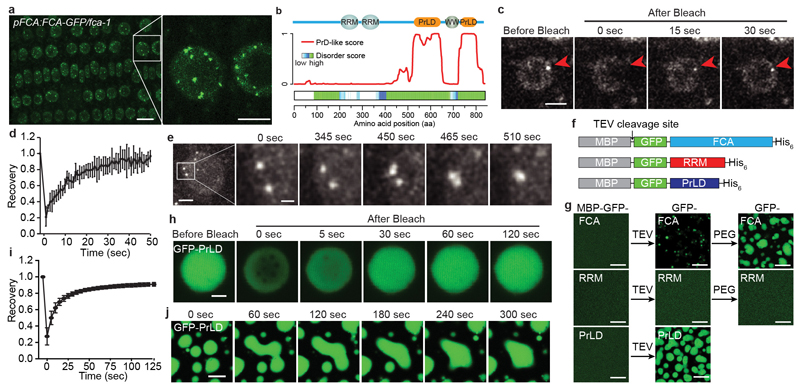
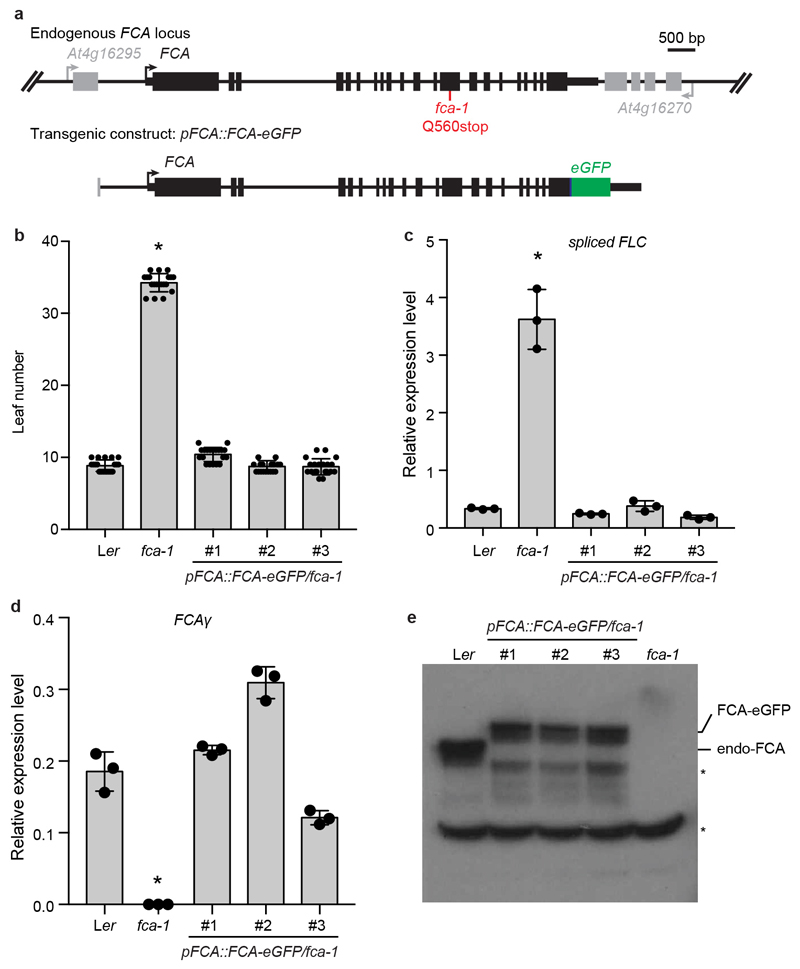
Regulation of the Arabidopsis floral repressor FLC involves conserved co-transcriptional mechanisms5. Autonomous pathway components lead to alternative 3’ end processing of the FLC antisense transcripts (COOLAIR), chromatin modification and the generation of an FLC chromatin environment that reduces FLC transcriptional initiation and elongation6. The alternative 3’ processing requires FCA7,8, an RNA-binding protein that interacts with RNA 3’ end processing components9,10. To gain mechanistic understanding of FCA function, we determined the subcellular localization of FCA. fca-1 mutant plants expressing an FCA green fluorescence protein (eGFP) transgene were generated (Extended Data Fig. 1a). The transgene fully complemented the fca mutation, accelerating flowering and repressing FLC expression (Extended Data Fig. 1b, c). The mRNA and protein levels of the FCA transgene were comparable (a little lower) to those of endogenous FCA (Extended Data Fig. 1d, e), indicating FCA-eGFP is not over-expressed and can functionally replace endogenous FCA. We acquired high-resolution images of FCA-eGFP in 7-day-old root tip epidermal nuclei and found that FCA-eGFP localized to multiple nuclear bodies (Fig. 1a).
Fig. 1. FCA phase separates in vitro and exhibits behaviour in vivo consistent with phase separation.
a, Fluorescence microscopy of Arabidopsis root tip nuclei expressing FCA-eGFP. Maximum projections of Z-stacks spanning the entire width of a nucleus were applied. Scale bars, left 10 μm, right 5 μm. Data are representative of five independent experiments. b, Top, protein domain structure of FCA. Bottom, predictions of prion-like domains and disordered regions by PLAAC and D2P2 algorithms, respectively. c, FRAP of FCA nuclear bodies. Time 0 indicates the time of the photobleaching pulse. Scale bar, 5 μm. Data are representative of seven independent experiments. d, Plot showing the time course of the recovery after photobleaching FCA nuclear bodies. Data are presented as the mean ± SD (n = 7). e, Fluorescence time-lapse microscopy of Arabidopsis root tip nuclei expressing FCA-eGFP. Two fusing bodies are zoomed-in. Scale bars, left 2 μm, right 0.5 μm. Data are representative of three independent experiments. f, Schematic depiction of protein fusions used for in vitro phase separation assay. g, In vitro phase separation assay of 10 μM GFP-FCA full-length and truncated proteins. Scale bars, 10 μm. Data are representative of three independent experiments. h, FRAP of GFP-FCA-PrLD droplets. Time 0 indicates the time of the photobleaching pulse. Scale bar, 2 μm. Data are representative of twelve independent experiments. i, Plot showing the time course of the recovery after photobleaching GFP-FCA-PrLD droplets. Data are presented as the mean ± SD (n = 12). j, Fusion of GFP-FCA-PrLD droplets. Data are representative of three independent experiments.
FCA contains two N-terminal RNA-binding domains and a WW protein interaction domain at its C terminus11. Outside those domains, FCA is highly disordered based on prediction12, and harbours two prion-like domains (PrLD)13 (Fig. 1b). The PrLD was recently identified as a driver for phase separation of RNA-binding proteins in vivo 14–17. This prompted us to test whether FCA bodies have liquid-like characteristics. We first assessed the dynamicity of FCA bodies using FRAP (fluorescence recovery after photobleaching). The spatio-temporal analysis of bleaching events showed that FCA redistributed rapidly from the unbleached area to the bleached area (Fig. 1c, d, Supplementary Video 1). Using time-lapse microscopy, we found that FCA bodies fused and relaxed into one body as soon as they intersected (Fig. 1e, Supplementary Video 2). We thus conclude that FCA localizes to nuclear bodies with liquid-like properties, suggesting that FCA can undergo liquid-liquid phase separation in vivo.
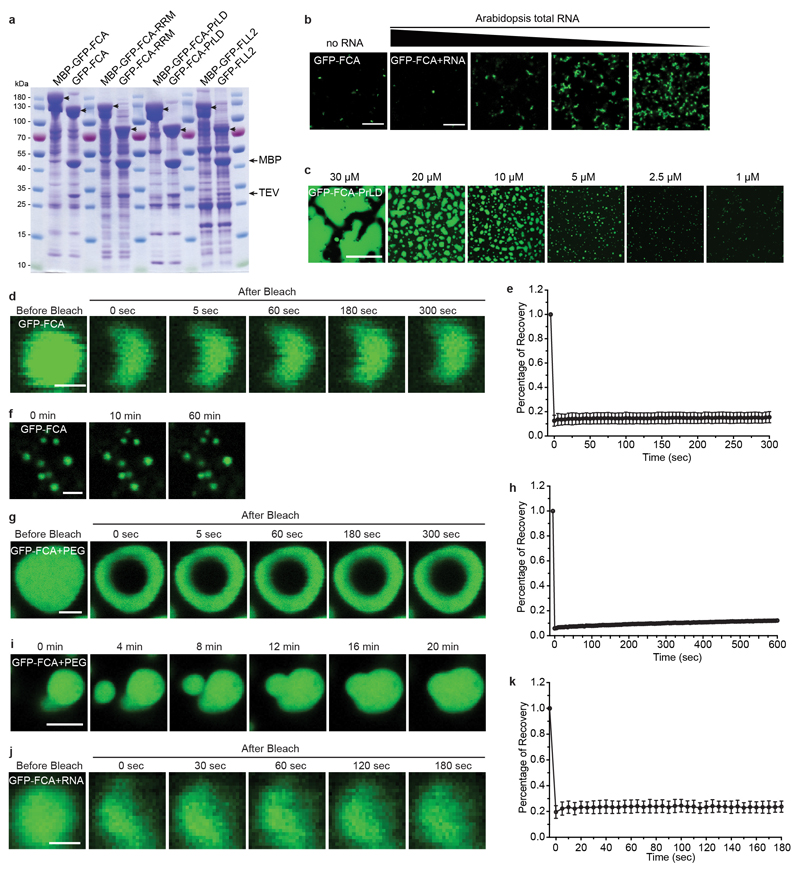
To determine whether FCA itself is a driver for the phase separation observed in vivo, we produced in vitro recombinant FCA fused with a solubility tag, maltose binding protein (MBP), followed by a tobacco etch virus protease (TEV) cleavage site and a GFP tag (Fig. 1f). After TEV addition to cleave off MBP (Extended Data Fig. 2a) substantial green puncta formed, and these were enhanced by addition of the crowding agent PEG8000 (PEG) (Fig. 1g) and low concentration of Arabidopsis total RNA (Extended Data Fig. 2b). To dissect which domain(s) of GFP-FCA is responsible for puncta formation, we separately expressed the N-terminal RRM domain or C-terminal PrLD of FCA (Fig. 1f). TEV cleavage of the C-terminal peptide yielded GFP-FCA-PrLD (Extended Data Fig. 2a) that formed extensive puncta, even without PEG. The GFP-FCA-RRM peptide failed to form puncta even with PEG (Fig. 1g, Extended Data Fig. 2a). These data indicate that the PrLD of FCA has the capacity to undergo phase separation.
We further investigated the detailed properties of in vitro phase separation of these proteins. GFP-PrLD was found to undergo phase separation at 1 μM and the distinct droplets were spherical (Extended Data Fig. 2c). FRAP analysis indicated that GFP-PrLD molecules diffused rapidly within droplets and exchanged between droplets and surrounding solution (Fig. 1h, i, Supplementary Video 3). Droplets were found to fuse upon contact (Fig. 1j, Supplementary Video 4). These data collectively indicate that GFP-PrLD undergoes liquid-liquid phase separation in a similar manner to that observed for FCA-GFP in cells. However, the puncta formed by GFP-FCA in vitro did not show similar liquidity (Extended Data Fig. 2d-k) suggesting that there are other regulators of FCA liquid-liquid phase separation in cells.
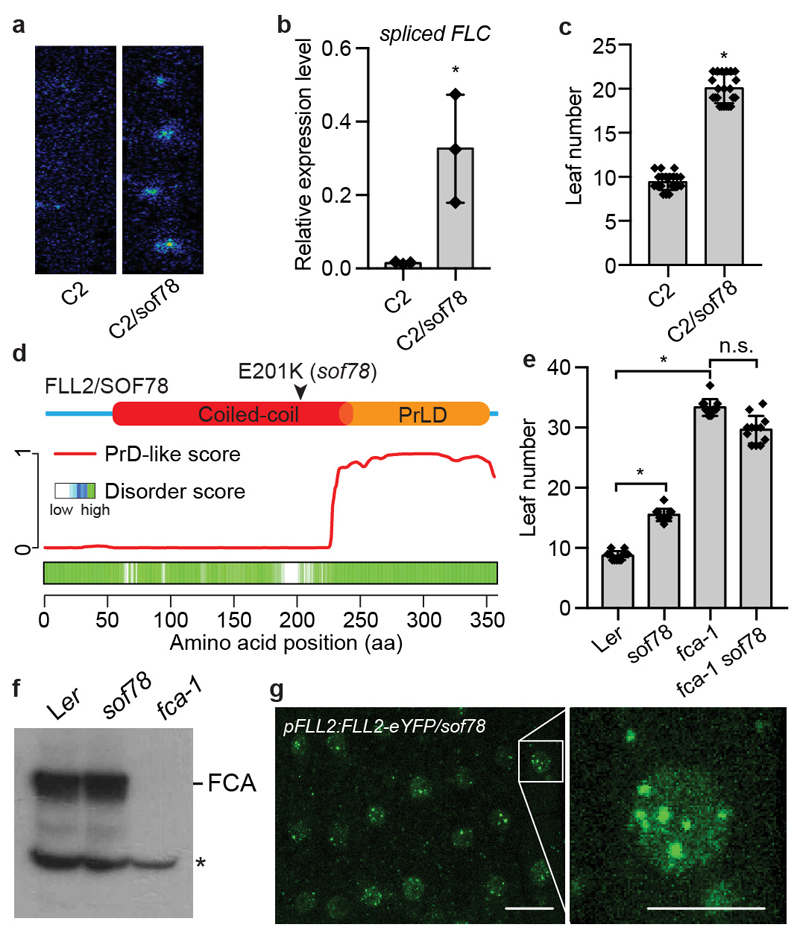
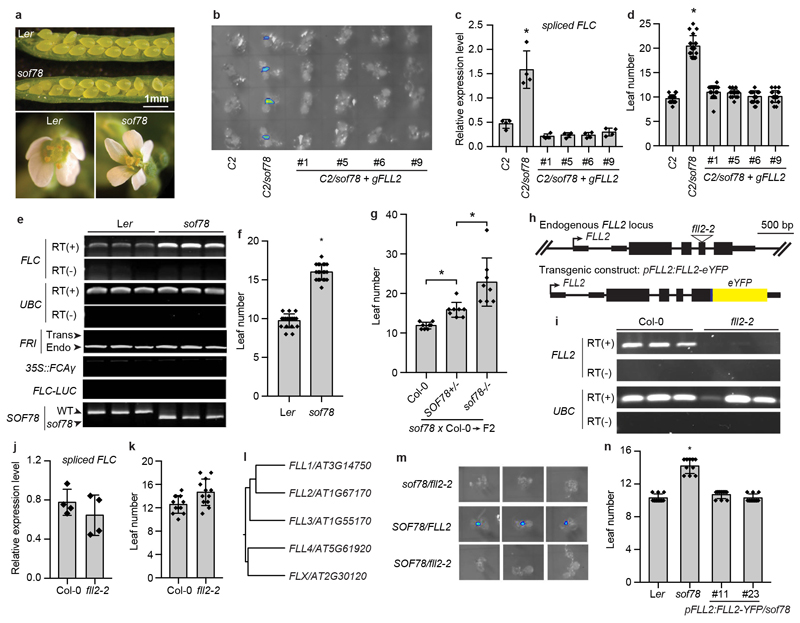
In order to define the functional significance and requirements for FCA nuclear body formation, we undertook a mutagenesis screen for FCA function. Using an Arabidopsis progenitor line (C2) that contains three transgenes: 35S::FCAγ for overexpressing FCA, FRIGIDA, encoding a strong activator of FLC, and FLC::LUC for monitoring FLC expression, we screened for components required for FCA-mediated FLC repression9,18,19. This identified a new mutant, sof78, with increased FLC expression that flowered late compared to C2 (Fig. 2a-c). The only other developmental defect observed was an occasional five petaled flower (Extended Data Fig. 3a). sof78 carries a mutation in FLL2 (At1g67170) leading to Glu-to-Lys amino acid change (Fig. 2d). Transgenic expression of FLL2 fully rescued the phenotypes of sof78 (Extended Data Fig. 3b-d). The effect of sof78 mutation was not dependent on 35S::FCAγ, FRIGIDA and FLC::LUC transgenes as the mutant still flowered late after removing all three transgenes (Extended Data Fig. 3e, f). We found that sof78 mutation is semi-dominant (haploinsufficient) based on three criteria: 1) the heterozygous mutant SOF78/sof78 has an intermediate flowering time between wild type and the homozygous mutant (Extended Data Fig. 3g); 2) fll2-2, a loss-of-function allele containing a T-DNA insertion (Extended Data Fig. 3h, i) neither changed the expression of FLC (Extended Data Fig. 3j), nor affected flowering time (Extended Data Fig. 3k). Potentially, loss of the FLL2 protein leads to use of the homologs, FLL1 and FLL3 (Extended Data Fig. 3l), which associate with FLL2 in vivo (Supplementary Table 3); 3) the hybrid carrying sof78 and fll2-2 had higher FLC::LUC expression than either wild-type or SOF78/fll2-2 (Extended Data Fig. 3m). We then performed an epistasis analysis and found that sof78 was not additive with fca-9 with regard to flowering time (Fig. 2e). The sof78 mutation did not affect FCA protein level (Fig. 2f). Taken together, these data suggest that FLL2 is required for FCA function.
Fig. 2. The coiled coil domain protein FLL2 is required for the function of FCA.
a, FLC-LUC bioluminescence signal of indicated plants taken by CCD camera. Data are representative of three independent experiments. b, Expression of spliced FLC relative to UBC in the indicated plants. Data are presented as the mean ± SD (n = 3). Asterisk indicates a significant difference (P = 0.0214, two-tailed t test). c, Flowering time of indicated plants (assayed as total leaf number, produced by the apical meristem before it switched to producing flowers) grown in a long day photoperiod. Data are presented as the mean ± SD (n = 20). Asterisk indicates a significant difference (P < 0.0001, two-tailed t test). d, Top, protein domain structure of FLL2. Bottom, predictions of prion-like domains and disordered regions by PLAAC and D2P2 algorithms, respectively. e, Flowering time of indicated plants grown in a long day photoperiod. Data are presented as the mean ± SD (n = 12). Asterisks indicate significant differences between the indicated plants (P < 0.0001, two-tailed t test). n.s., not significant. f, The protein level of FCA in the indicated plants as determined by western blot. Asterisk indicates non-specific signal. Data are representative of two independent experiments. For gel source data, see Supplementary Figure 1. g, Fluorescence microscopy of Arabidopsis root tip nuclei expressing FLL2-eYFP. Maximum projections of Z-stacks spanning the entire width of the nucleus were applied. Scale bars, left 10 μm, right 5 μm. Data are representative of three independent experiments.
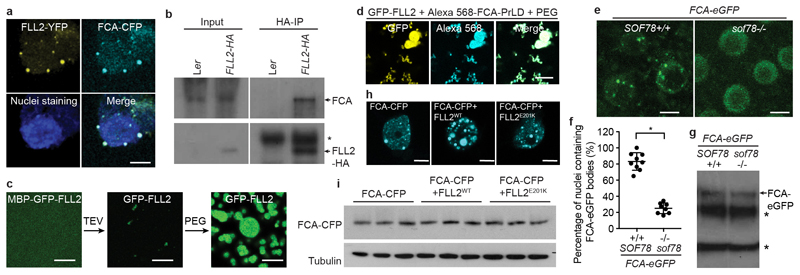
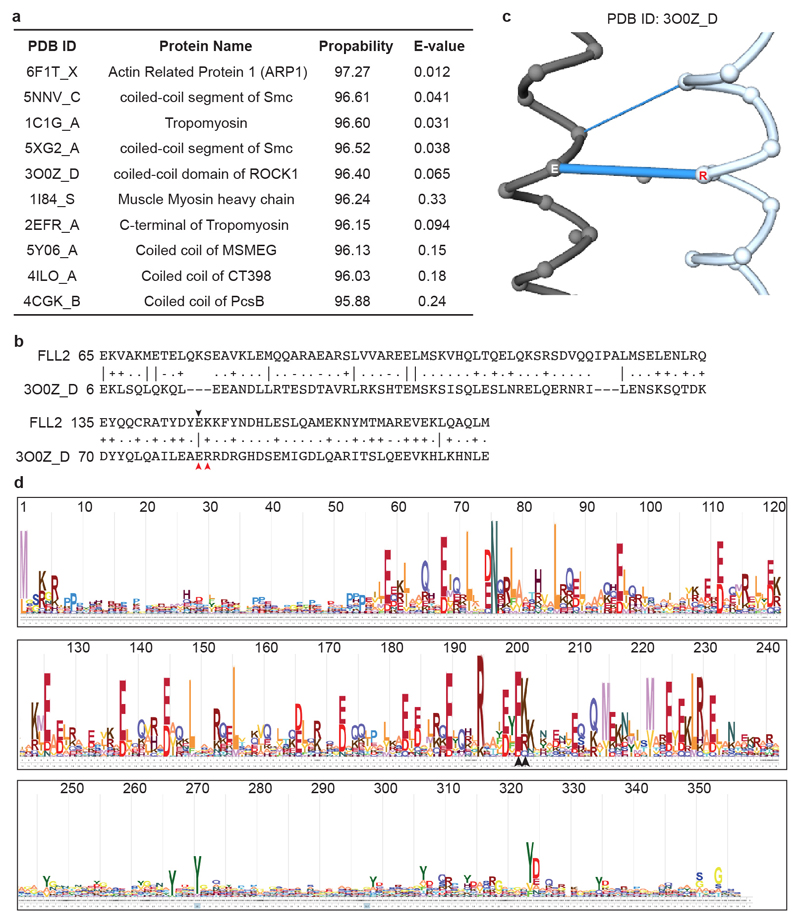
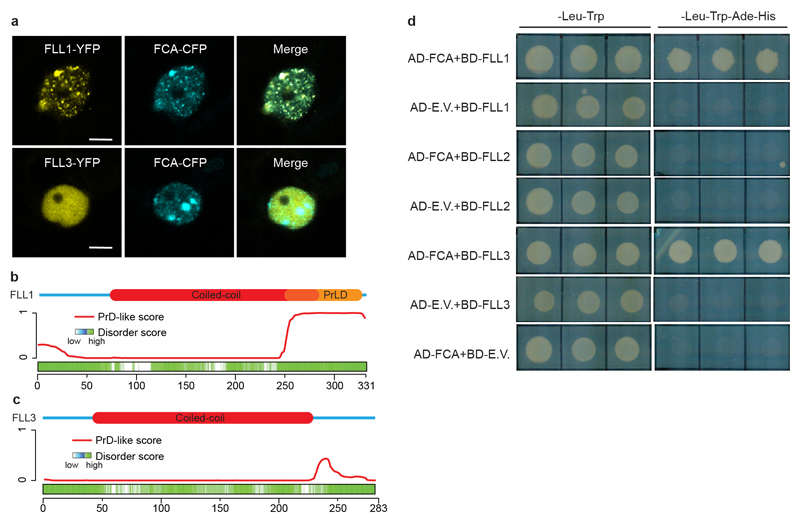
FLL2 has not been assigned with any functional domain. We performed a deeper search using HHpred inside the MPI Bioinformatics Toolkit20 and found FLL2 contains a coiled-coil segment with high probability (Extended Data Fig. 4a, b). The Glu201-to-Lys amino acid change is predicted to influence a salt bridge connecting two coiled coils21 (Extended Data Fig. 4b, c). This Glu201 is highly conserved in all green plants (Extended Data Fig. 4d). As with FCA, FLL2 is also highly disordered and contains PrLD (Fig. 2d). We then examined the subcellular localization of FLL2. Stable transgenic expression of FLL2-eYFP fully complemented the late flowering phenotype of sof78 (Extended Data Fig. 3h, n). FLL2-eYFP was detected in nuclear bodies (Fig. 2g) co-localizing with FCA after co-transformation of FLL2-eYFP and FCA-CFP into Arabidopsis cultured cells (Fig. 3a). FLL1 also colocalized with FCA in nuclear bodies, while FLL3 was evenly distributed in the nucleus (Extended Data Fig. 5a). Consistent with this, FLL1 but not FLL3 contains a prion-like domain (Extended Data Fig. 5b, c). However, using yeast two-hybrid assays, we found that FLL1 and FLL3 interacted with FCA, while FLL2 did not (Extended Data Fig. 5d), so future work is required to fully elaborate the roles of the different FLL proteins. Lack of a yeast two-hybrid interaction with phase separated partners has also been found for FUS22. We tested whether FLL2 associates with FCA in stable transgenic plants and found using standard procedures that they did not co-immunoprecipitate (data not shown). We reasoned that given the dynamic property of FCA bodies, the association between FLL2 and FCA might be transient and dynamic and indeed, found formaldehyde crosslinking captured their interaction (Fig. 3b). We further interrogated the transient interactions between FLL2 and FCA in vitro. To this end, we first tested in vitro phase separation propensity of FLL2. GFP-FLL2 resulted in few puncta and the addition of 10% crowding reagent PEG8000 greatly enhanced puncta formation (Fig. 3c, Extended Data Fig. 2a). Importantly, FLL2 co-phase separated with PrLD of FCA (Fig. 3d).
Fig. 3. FLL2 promotes the phase separation of FCA to form nuclear bodies.
a, Colocalization of FLL2-YFP with FCA-CFP in Arabidopsis cultured cell nuclei. Scale bar, 5 μm. Images are representative of three independent experiments. b, Co-IP in stable transgenic plants after formaldehyde crosslinking to detect the association of FLL2-HA with FCA. Asterisk indicates non-specific signal. Data are representative of two independent experiments. For gel source data, see Supplementary Figure 1. c, In vitro phase separation assay of 10 μM GFP-FLL2. Scale bars, 10 μm. Data are representative of three independent experiments. d, Co-separation of FCA-PrLD with GFP-FLL2. Alexa Fluor 568 labelled 0.5 μM FCA-PrLD preferentially partitioned into GFP-FLL2 droplets. Scale bar, 10 μm. Data are representative of three independent experiments. e, Representative fluorescence microscopic images of FCA-GFP nuclear bodies in wildtype and sof78 mutant backgrounds. For each image, maximum projections of Z-stacks spanning the entire width of the nucleus was applied. Scale bars, 5 μm. Data are representative of eight independent experiments. f, Percentage of nuclei containing FCA-GFP nuclear bodies in wildtype and sof78 mutant backgrounds. Data are presented as the mean ± SD (n = 8). Asterisk indicates a significant difference (P < 0.0001, two-tailed t test). g, The protein level of FCA-GFP in wildtype and sof78 mutant backgrounds as determined by western blot. Asterisks indicate non-specific signals. Data are representative of three independent experiments. For gel source data, see Supplementary Figure 1. h, The effect of FLL2 overexpression on the pattern of FCA-CFP nuclear bodies assayed in tobacco leaf nuclei. Images are representative of three independent experiments. Scale bars, 5 μm. i, The protein level of FCA-CFP in indicated samples as determined by western blot. Data are representative of three independent experiments. For gel source data, see Supplementary Figure 1.
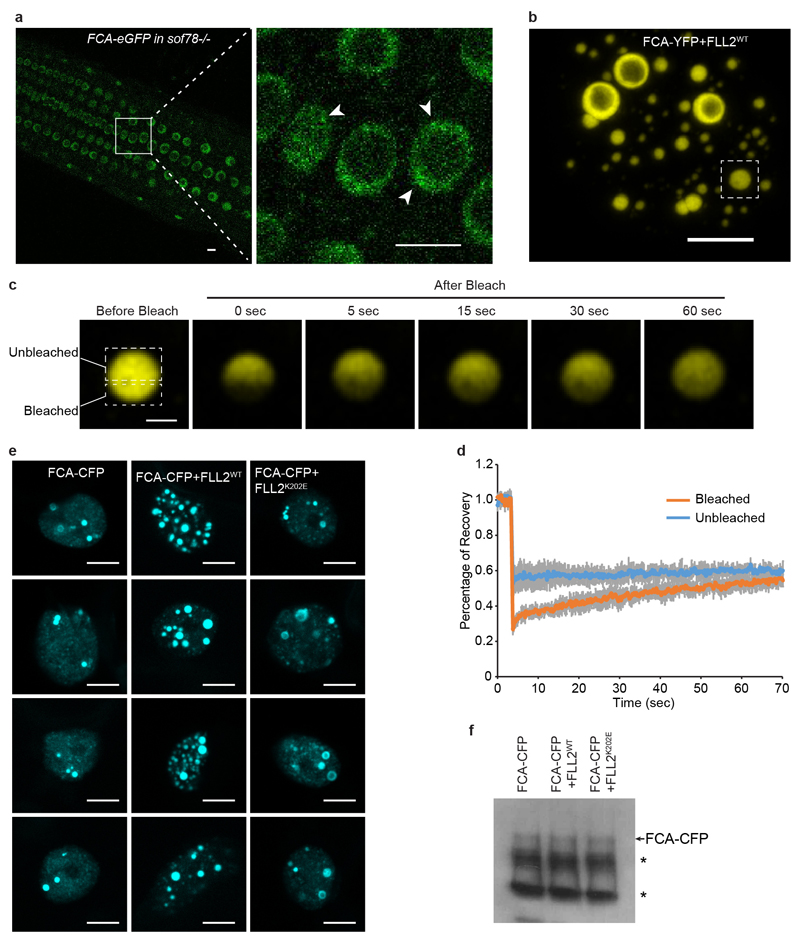
The association between FLL2 and FCA led us to investigate whether FLL2 regulates formation of the FCA-GFP bodies. To test this, we introduced the sof78 mutation into FCA-eGFP transgenic plant and compared FCA bodies between sof78 mutant and corresponding wild-type backgrounds. The sof78 mutation reduced the percentage of nuclei containing FCA bodies (Fig. 3e, f) and their size (Extended Data Fig. 6a), without affecting protein level of FCA-eGFP (Fig. 3g). Ectopically expressing FLL2WT increased the size and number of FCA-CFP bodies in tobacco leaves (Fig. 3h). These bodies were spherical and highly dynamic, mixing very rapidly after half-bleaching (Extended Data Fig. 6b-d, Supplementary Video 5), supporting that FCA-GFP bodies can behave as liquid droplets. This increase was lost through overexpression of either FLL2E201K or FLL2K202E, mutated in amino acids predicted to form a salt bridge (Fig. 3h, Extended Data Fig. 6e). The protein levels of FCA-CFP were not changed by FLL2 overexpression (Fig. 3i, Extended Data Fig. 6f). These data indicate that the coiled coil protein FLL2 promotes the phase separation of FCA to form nuclear bodies.
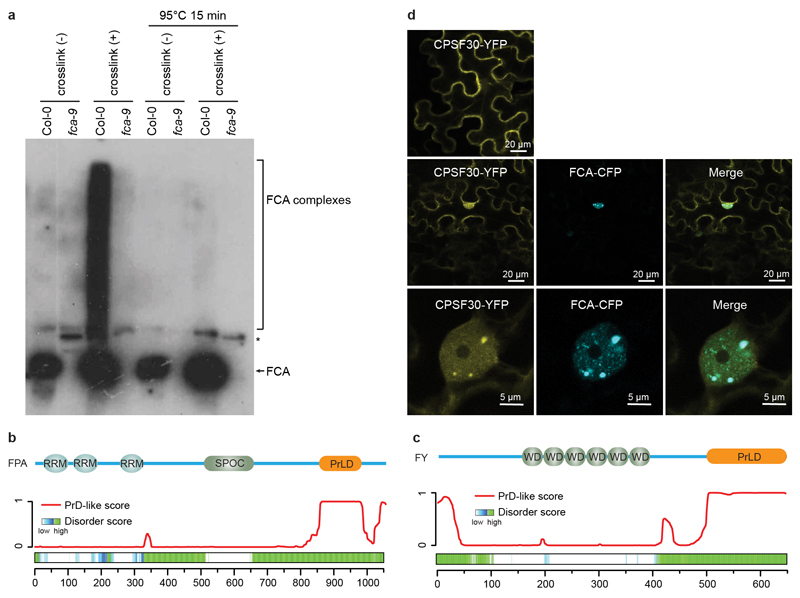
FCA promotes proximal polyadenylation of transcripts from many loci in the genome, previously classified as UAs4, as well as COOLAIR transcripts9. This process requires RNA 3’ end processing/polyadenylation factors, FY/Pfs2p10,23, Cstf64/Cstf779 and the RRM-containing protein FPA9,24. The model was that FCA, through interacting with FY, targets 3’ end processing machinery to the proximal polyadenylation site9. However, efforts to prove their in vivo interactions had so far been unsuccessful23. We speculated that FCA bodies are the sites where FCA dynamically and transiently interacts with FPA and 3’ end processing factors. To test this hypothesis, we developed crosslinked nuclear immunoprecipitation and mass spectrometry (clnip-MS, see Methods) to determine the interactors of FCA upon formaldehyde crosslinking: this gave large heterogenous FCA complexes (Extended Data Fig. 7). Interestingly, we found that FPA, FY, Cleavage/Polyadenylation Specificity Factors (CPSFs)25, FIP1 that links cleavage/polyadenylation factors to poly(A) polymerases26, and FLL2 co-purified with FCA (Extended Data Table 1, Supplementary Table 1). These constitute the polymerase and nuclease modules of the 3’ end processing machinery27. Without crosslinking none of those proteins were detected (Extended Data Table 1, Supplementary Table 2). Clnip-MS of FLL2 identified FCA, FPA and some of the 3’ end processing factors (Extended Data Table 1, Supplementary Table 3). Importantly, clnip-MS of FLD, which functions downstream of FCA to induce chromatin changes18, did not capture any of those factors (Supplementary Table 4). This indicates that the 3’ end processing factors specifically associate with FCA and FLL2.
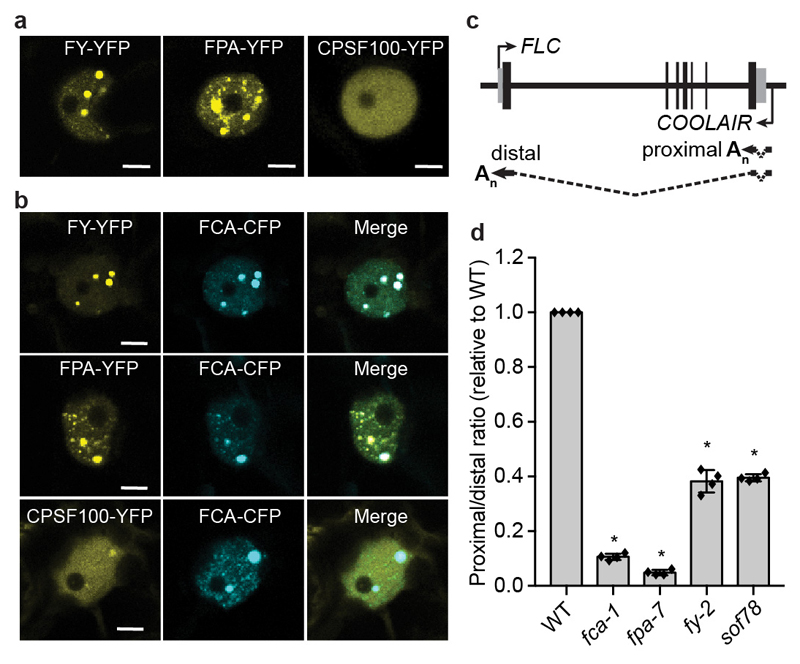
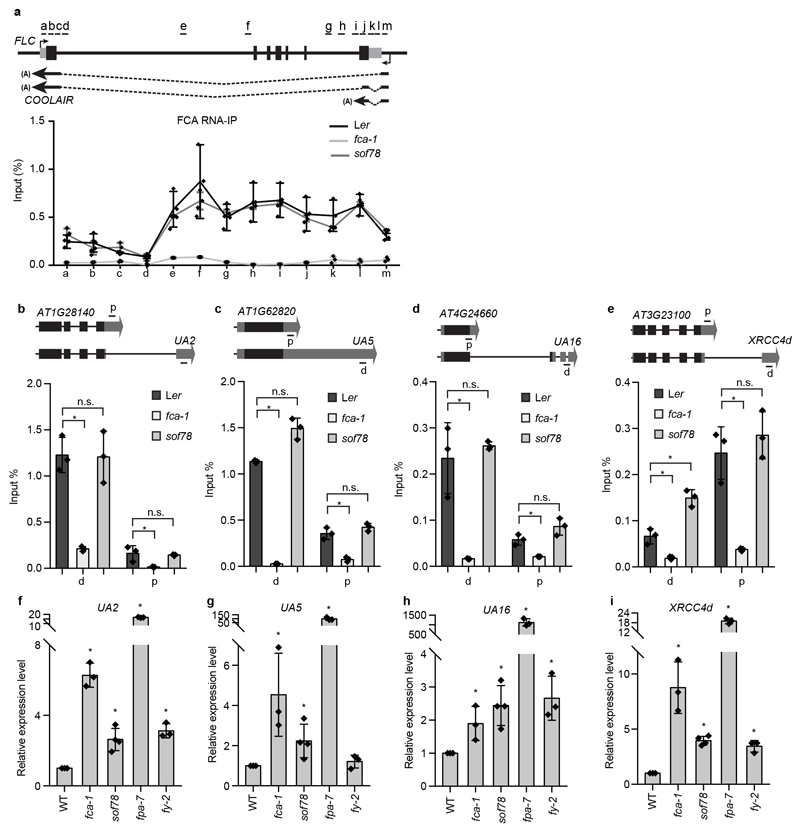
We next asked whether those 3’ end processing factors localized to FCA bodies. We overexpressed FY and FPA fused with YFP in tobacco leaves and found that they both formed nuclear bodies (Fig. 4a), which fully overlapped with FCA-CFP bodies (Fig. 4b). Consistent with this, FY and FPA are similar to FCA in that they are also highly disordered and contain PrLDs13 (Extended Data Fig. 8a, b). Interestingly, overexpression of CPSF30-YFP and CPSF100-YFP alone did not give rise to nuclear bodies (Fig. 4a, Extended Data Fig. 8c), but they were recruited to FCA-CFP bodies when co-expressed with FCA (Fig 4b, Extended Data Fig. 8c). These data support that the bodies are indeed sites where FCA associates with RNA 3’ end processing factors. FCA has been found to associate with FLC chromatin18. We found that immunoprecipitation of FCA enriched nascent transcripts of COOLAIR and UAs (Extended Data Fig. 9a-e) supporting a co-transcriptional mechanism, and this was independent of FLL2 (Extended Data Fig. 9a-e). Similar to fca, fpa and fy mutants, polyadenylation of proximal sites in COOLAIR and UA proximal polyadenylation was defective in sof78 (Fig. 4c, d, Extended Data Fig. 9f-i). Thus, we propose that the FCA nuclear bodies compartmentalize 3’ end processing factors and this enhances polyadenylation at specific 3’ processing sites (Extended Data Fig. 10). We envisage that there will be a wide size range of these highly dynamic FCA nuclear bodies, so an important next step will be to simultaneously image target loci and FLL2/FCA bodies. This will help establish the size of the functionally important unit and determine whether the large FCA-GFP droplets, observed using low-resolution microscopy, are functional or one extreme of the biomolecular condensate formation.
Fig. 4. FCA and FLL2 associate with 3’ processing factors and are important for polyadenylation at specific sites.
a, Fluorescence microscopy of tobacco leaf nuclei expressing indicated proteins. Images are representative of three independent experiments. Scale bars, 5 μm. b, Colocalization of FY-YFP, FPA-YFP and CPSF100-YFP with FCA-CFP in tobacco leaf nuclei. Images are representative of three independent experiments. Scale bars, 5 μm. c, Schematic representation of COOLAIR transcripts from the FLC locus. Black rectangles denote exons and dashed lines denote introns. d, The ratio of proximal to distal isoforms of COOLAIR transcripts in the indicated plants relative to wild type. Data are presented as the mean ± SD (n = 4). Asterisks indicate significant differences (P < 0.0001, two-tailed t test).
Coiled coils are α-helical super-secondary structures that mediate protein-protein interactions and oligomerization28. The yeast prion protein Sup35 contains a coiled coil region within the middle (M) domain29, a region involved in inducing liquid-like phase separation upon pH sensing30, implying coiled coil domains may play a general role in phase separation. Our findings thus help define the multivalent in vivo interactions driving liquid-liquid phase separation.
Methods
Plant materials and growth conditions
The parental C2 line18 and flowering time mutants fca-1 11, fpa-7 31 and fy-2 32 were previously described. fca-9 was provided by Chang- Hsien Yang (National Chung Hsing University, Taiwan). fll2-2 (GK-084H05) was obtained from the European Arabidopsis Stock Centre.
The Seeds were surface sterilized and sown on standard half-strength Murashige and Skoog (MS) medium (0.22% MS, 1% sucrose, 0.5% Phytagel, Sigma, P8169) media plates and kept at 4°C in the dark for 2 days before being transferred to long photoperiod conditions (16 h light of 120 μmol m-2 s-1/8 h dark). All RNA and protein experiments were done using 12-day-old seedlings unless specified.
DNA constructs and generation of transgenic plants
To generate pFCA::FCA-eGFP transgenic line, FCA genomic DNA including its promoter and 3’UTR was amplified and inserted into the pCambia1300 vector. FCA_ApaI fragment (FCA genomic DNA contains two ApaI sites) was swapped by FCA_ApaI fragment fused with GFP, which was inserted before the stop codon using the HindIII restriction site. The resulting construct was transformed into the fca-1 mutant.
For complementation of the sof78 mutant, a 3.9kb genomic fragment harbouring AT1G67170 was cloned into pCambia1300 vector and transformed into the sof78 mutant. To generate pFLL2::FLL2-eYFP and pFLL2::FLL2-HA transgenic lines, pFLL2::FLL2 with linker or HA tag and 3’UTR of FLL2 were separately amplified from genomic DNA. The PCR products were digested and sequentially cloned into an pENTR vector. eYFP sequence was then inserted between above two fragments. The resulting pENTR-FLL2 vectors were subsequently recombined into the binary destination vector pSLJ755I633. Those two constructs were transformed into the sof78 mutant.
All the constructs described above were electroporated into Agrobacterium tumefaciens GV3101 for transformation of Arabidopsis by the floral dip method.
The constructs for co-localization experiments were cloned by inserting coding sequences of FCA, FLL1, FLL2WT, FLL3, FY, CPSF30 and CPSF100 into the pCambia1300-35S-N1–YFP or pCambia1300-35S-N1–CFP vectors. 35S::FLL2E201K-YFP and 35S::FLL2K202E-YFP were cloned from 35S::FLL2WT-YFP by PCR-directed mutagenesis. 35S::FPA-YFP was described previously31.
The constructs for yeast two-hybrid assay were cloned by inserting coding sequences of FCA, FLL1, FLL2 and FLL3 into the pGADT7 and pGBKT7 vectors.
The constructs for in vitro protein expression were cloned by inserting coding sequences of FCA, FLL2, FCA-PrLD and FCA-RRMs into a modified pET11 expression vector (Novagen): a solubility tag, maltose binding protein (MBP) was followed by a tobacco etch virus protease (TEV) cleavage site and a green fluorescence protein (GFP) at N-terminus, a non-cleavable His6-tag at the C-terminus. FCA-PrLD was also cloned into a similarly modified expression vector without the GFP tag.
Primers used for vector construction are listed in Supplementary Table 5.
Mutagenesis screening and cloning of SOF78
Chemical mutagenesis of the parental line C2 and screening of sof78 mutants were carried out as described18. To map C2/sof78, the mutant was crossed to a Columbia line (containing the same transgenes) and the resulting F2 plants were screened for FLC-LUC bioluminescence. 310 plants with high FLC-LUC bioluminescence activity were pooled and the DNA was extracted and prepared for Illumina sequencing as described34 using 2 x 150-bp paired end reads to a depth of 20x coverage. Applying a previously described method35, we identified a single genomic region enriched for Ler alleles that did not correspond to the three transgenes and identified candidate sof78 causal mutations as polymorphisms that were not derived from Ler. The identified mutations were confirmed by Sanger sequencing.
FLC-LUC detection
Seedlings around 12 days after germination on MS medium plates were sprayed with 1 mM of luciferin (Promega) substrate solution and incubated in the dark at room temperature for 20 minutes. LUC bioluminescence activity of the seedlings was assayed as described9.
Flowering time analysis
Plants were grown in growth rooms with a photoperiod of 16 hours light and 8 hours dark. Temperature ranged between 23-25°C during the day and 20-22°C at night. The total leaf number (TLN) produced by the main apical meristem before switching the developmental program to the initiation flowering was counted to measure variation in flowering time.
Protein expression and purification
All proteins were expressed in Escherichia coli BL21 (DE3) cells (Tiangen) in the presence of 0.5 mM isopropyl β-D-1-thiogalactopyranoside (IPTG). Cells were induced overnight at 18°C, collected and resuspended in lysis buffer (20 mM HEPES pH 7.4, 500 mM KCl, 1 mM PMSF). The cells were then lysed using High Pressure homogenizer (ATS Engineering Limited) and centrifuged. The supernatants were first purified with Ni-NTA and amylose resin (GenScript), followed by purification on a Superdex 200 increase 10/300 column (SD200) (GE healthcare). Proteins were stored in storage buffer (20 mM HEPES pH 7.4, 150 mM KCl, and 1 mM DTT) at -80°C after being flash-frozen in liquid nitrogen.
Protein labelling
MBP-FCA-PrLD-His6 protein solution was exchanged with reaction buffer (0.1 M sodium bicarbonate buffer pH 8.3) using a SD200 column. Alexa Fluor™ 568 carboxylic acid (Succinimidyl Ester) (ThermoFisher, A20003) was added to MBP-FCA-PrLD-His6 proteins at 1:1 molar ratio, incubated for 1 hour at room temperature with continuous stirring. Free dye was removed using SD200 column. The labeled proteins were stored in storage buffer at -80°C.
In vitro phase separation assay
In vitro phase separation assay was performed in storage buffer. N-terminal MBP tags of MBP-GFP-FCA, MBP-GFP-FCA-PrLD, MBP-GFP-FCA-RRMs, MBP-GFP-FLL2, and MBP-FCA-PrLD were cleaved during droplet assembly with TEV protease overnight. Further droplet assembly for MBP-GFP-FCA, MBP-GFP-FCA-RRMs, and MBP-GFP-FLL2 was mixed with 10% (w/v) final concentration of polyethylene glycol 8000 (PEG) (Sigma). Phase separation of GFP-FCA in the presence of RNA were tested by adding Arabidopsis total RNA to 3.13 μM of GFP-FCA to the final concentration of 1.3-0.09 μg/mL.
Droplets were assembled in 384 low-binding multi-well 0.17 mm microscopy plates (384-well microscopy plates) (In Vitro Scientific) and sealed with optically clear adhesive film to prevent evaporation and observed under a NIKON A1 microscope equipped with 60x and100× oil immersion objectives. Co-phase separation between FCA-PrLD and FLL2 was done by mixing Alexa Fluor 568 labeled-FCA-PrLD with MBP-GFP-FLL2 to final concentrations of 0.5 μM.
Microscopy
Plants were grown vertically on MS plates with 1% (w/v) sucrose and 0.5% (w/v) Phytagel (Sigma- Aldrich, P8169). Analyses of subcellular localization were performed on Zeiss LSM780 confocal microscope using a 40x/1.2 water objective and LSM 780’s GaAsP spectral detector. GFP was excited at 488 nm and detected at 491-535 nm and YFP was excited at 514 nm and detected at 517-557 nm. All images are Z-stack maximum projections using a step size of 0.45 μm, spanning the entire width of the nucleus.
Analyses of colocalization were also performed on Zeiss LSM780 confocal microscope. YFP was excited at 514 nm and detected at 517-557 nm, CFP was excited at 458 nm and detected at 464-517 nm. YFP and CFP were acquired sequentially to avoid emission crosstalk. For microscopy of Arabidopsis cultured cells, cells were incubated with Vybrant® DyeCycle™ Ruby Stain (Thermo Scientific™, V10309) to stain the nuclei. Ruby was excited at 633 nm and detected at 638-686 nm.
For time-lapse microscopy of FCA nuclear droplets, a chamber was created on slides using SecureSeal™ adhesive sheets (Grace Bio-Labs, 620001) and filled with MS medium. 7-day-old seedlings were transferred into the chamber and observed under Andor Revolution XD Spinning disc confocal microscope using a 60x water immersion objective. Images were acquired every 15 sec for 15 min. At each time point, maximum projections from Z-stack of 14 steps with step size at 0.6 μm were applied. Image analysis was performed with the FIJI/ImageJ.
Fluorescence recovery after photobleaching (FRAP)
In vivo experiment: FRAP of FCA-eGFP bodies in Arabidopsis was performed as described36 on Andor Revolution XD Spinning disc confocal microscope system with Nikon ECLIPSE Ti microscope stand, Yokogawa CSU-X spinning disc and iXon 3 EMCCD camera. Using a 60x water immersion objective a region of an FCA nuclear body or nucleoplasm was bleached using a laser intensity of 50% at 488 nm. Recovery was recorded for every second (sec) for a total of 50 sec after bleaching. FRAP of FCA-YFP bodies formed in tobacco was performed on Zeiss LSM880 Airy scan confocal microscope, using a x40/1.1 water immersion objective lens. Bleaching was done using a 514-nm laser pulse (5 iterations, 50% intensity). To improve spatial resolution, the Airy scan detector was used in SR mode and images processed using Zen Black airy scan processing 2D method. Recovery was recorded for every 233 mili-second (msec). Analysis of the recovery curves was carried out with the FIJI/ImageJ.
In vitro experiments: In vitro FRAP experiments were carried out with samples in 384-well microscopy plates using a NIKON A1 microscope equipped with 60× and 100x oil immersion objective as above. Droplets were bleached with a 488-nm laser pulse (3 repeat, 70% intensity, dwell time 1 s). Recovery from photobleaching was recorded for the indicated time.
Yeast two-hybrid assay
Pairs of plasmids were co-transformed into the yeast strain AH109 following the manufacturer’s handbook (Clontech). The co-transformed yeast clones were first grown on SD medium without Leu and Trp and subsequently plated on SD medium without Ade, His, Leu and Trp.
RNA Immunoprecipitation
About 2.0g 12-day-old wet seedlings were crosslinked in 1% formaldehyde. Crosslinked plants were ground into fine powder and lysed in 8 mL Lysis buffer (20 mM Tris·HCl pH7.5; 20 mM KCl; 2 mM EDTA pH8.0; 2.5 mM MgCl2; 25% glycerol; 250 mM sucrose). The lysate was filtered through two layers of Miracloth (Merck, D00172956) and pelleted by centrifugation. The pellets were washed three times with 20 mL NRBT buffer (20 mM Tris·HCl pH7.5; 2.5 mM MgCl2; 25% glycerol; 0.2% Triton X-100), resuspended in 600 μL RIPA buffer (1xPBS; 1% NP-40; 0.5% sodium deoxycholate; 0.1% SDS, 20 u/mL RNaseOUT) and sonicated. Nuclear extract was incubated with FCA antibody and Protein A magnetic beads (Pierce) for 2 h and washed sequentially with Low Salt, High Salt and TE buffers. The immunoprecipitates were then resuspended in 200 μL RNA Elution buffer (100 mM NaCl; 50 mM Tris-HCl pH 7.0; 1 mM EDTA; 1% SDS) and boiled at 95°C for 15 min. 10 μL proteinase K, 1 μL RNaseOUT and 2 μL 0.1M DTT were added to each reaction and incubated at 65°C for 60 min. The reaction was then stopped with 1 mL Trizol reagent (Ambion). RNA was then isolated and analyzed.
RNA analysis
Total RNA or FCA-bound RNA was extracted, treated with TURBO™ DNase (Ambion) to remove DNA contamination and reversely transcribed by SuperScript® IV Reverse Transcriptase (Invitrogen) using gene-specific reverse primers. qPCR analysis was performed on LightCycler480 II (ROCHE) and qPCR data was normalized to UBC. Semi-qPCR was performed with GoTaq® G2 DNA Polymerase (Promega) and PCR products were analysed by agarose gel electrophoresis.
For measuring the proximal/distal ratio of COOLAIR, the levels of proximal and distal COOLAIR were first normalized to total COOLAIR. The value of proximal was then divided by that of distal. All primers are described in Supplementary Table 5.
Western blot analysis
Protein samples were separated by SDS-PAGE gel and transferred to PVDF membranes. Antibodies against FCA37, HA (Sigma, H3663), GFP (Roche, 11814460001) were used as primary antibodies. After the primary antibody incubation, horseradish peroxidase (HRP)-conjugated secondary antibodies (GE Healthcare) were used for protein detection by chemiluminescence (Thermo Scientific, 34095).
Crosslinked nuclear immunoprecipitation and mass spectrometry (clnip-MS)
12-day-old seedlings were crosslinked in 1% formaldehyde. Vacuum was applied gently and released slowly to avoid disruption of subcellular structures. Crosslinked plants were ground into fine powder and lysed in Lysis buffer (20 mM Tris·HCl pH7.5; 20 mM KCl; 2 mM EDTA pH8.0; 2.5 mM MgCl2; 25% glycerol; 250 mM sucrose). The lysate was filtered through two layers of Miracloth (Merck, D00172956) and pelleted by centrifugation. The pellets were washed three times with NRBT buffer (20 mM Tris·HCl pH7.5; 2.5 mM MgCl2; 25% glycerol; 0.2% Triton X-100), resuspended in RIPA buffer (1xPBS; 1% NP-40; 0.5% sodium deoxycholate; 0.1% SDS) and sonicated. Nuclear extract was incubated with FCA antibody, anti-HA Magnetic Beads (Thermo Scientific™, 88836) or anti-FLAG® M2 Magnetic Beads (Sigma, M8823) and washed sequentially with Low Salt, High Salt and TE buffers. The immunoprecipitates were boiled at 95°C for 15 min to reverse crosslinking. The protein samples were gel-purified and subjected to Mass Spectrometry analysis by nanoLC-MS/MS on an Orbitrap Fusion™ Tribrid™ Mass Spectrometer coupled to an UltiMate® 3000 RSLCnano LC system (Thermo Scientific, Hemel Hempstead, UK). Data were searched using Mascot server (Matrixscience, London, UK) and analyzed using the MaxQuant software38.
Transient transformation of Arabidopsis thaliana cell suspension cultures
The Arabidopsis Col-0 cells are subcultured in MS medium with B5 vitamins (1 x Murashige and Skoog basal salt mix; 1 x Gamborg’s B5 vitamins; 3 % Sucrose; 0.59 g/L MES buffer, pH5.7; 1 mg/L 2,4-D) weekly and maintained at 100-110 rpm at 24°C in the dark. Agrobacterium was inoculated into 10 mL LB medium and incubated overnight. Cells were collected, resuspend in the same volume of sterile M buffer (10 mM MgCl2; 10 mM MES, pH 5.6; 50 μg/mL Acetosyringone) and incubated at room temperature (20-22°C) for 2-4 hours. Cells were collected, resuspend in the 4 mL sterile M buffer. 200 μL of this culture was added to 50 mL freshly subcultured Arabidopsis cells and incubated for 48 hours before microscopy analysis.
Agro-infiltration of tobacco leaves
Agro-infiltration experiments were performed essentially as described39 except that Nicotiana benthamiana plants were used.
Genotyping
To genotype C2: FRI was genotyped by mixing two pairs of primers (FRI-JU223_F6+R6 and FRI-del_F1+R1) together. 35S::FCA transgene was genotyped with primers 35S::FCA_F6+R6. FLC-LUC transgene was genotyped with primers LUC3_F+R.
To genotype sof78 and fca-1 mutations, genomic DNA was amplified with primers sof78-dCAPs_F+R and fca-1-dCAPS_F+R, respectively. PCR products were digested with MseI and followed by 3% agarose gel electrophoresis.
fll2-2 was genotyped with the T-DNA left border specific primer GABI_F and At1g67170_R3 to detect the presence of the insertion. PCR using At1g67170_F3+R3 to tested whether the T- DNA insertion was homozygous.
Extended Data
Extended Data Fig. 1. Transgenic FCA-eGFP is functionally equivalent to endogenous FCA.
a, Top, genomic FCA locus indicating upstream and downstream genes (grey) and position of fca-1 mutation. Bottom, illustration of transgenic FCA-eGFP construct. Thick black boxes indicate exons, thin black boxes indicate UTRs and black lines indicate introns. b, Flowering time of indicated plants grown in a long day photoperiod. Data are presented as the mean ± SD (n = 20). Asterisk indicates a significant difference (P = 0.0001, two-tailed t test). c, Expression of spliced FLC relative to UBC in the indicated plants. Data are presented as the mean ± SD (n = 3). Asterisk indicates a significant difference (P = 0.0004, two-tailed t test). d, Expression of spliced FCAγ relative to UBC in the indicated plants. Data are presented as the mean ± SD (n = 3). Asterisk indicates a significant difference (P = 0.0003, two-tailed t test). e, The protein levels of FCA and FCA-GFP in the indicated plants as determined by western blot. Asterisks indicate non-specific signals. Data are representative of two independent experiments. For gel source data, see Supplementary Figure 1.
Extended Data Fig. 2. FCA undergoes phase separation in vitro.
a, Coomassie staining of indicated protein samples before and after TEV cleavage of the MBP tag. Arrowheads indicate the proteins labelled on top of the gel. Data are representative of three independent experiments. b, Phase separation of GFP-FCA in the presence of Arabidopsis total RNA was tested using 3.13 μM of GFP-FCA and RNA ranging from 0.09 to 1.3 μg/ml. Scale bar, 10 μm. Data are representative of three independent experiments. c, In vitro phase separation assay of GFP-FCA-PrLD at different protein concentrations. Scale bar, 50 μm. Data are representative of three independent experiments. d, FRAP of GFP-FCA puncta. Time 0 indicates the time of the photobleaching pulse. Scale bar, 1 μm. Data are representative of eight independent experiments. e, Plot showing the time course of the recovery after photobleaching GFP-FCA puncta. Data are presented as the mean ± SD (n = 8). f, GFP-FCA puncta neither grow in size, nor coalesce with each other. Time points are indicated in minutes above. Scale bar, 10 μm. Data are representative of three independent experiments. g, FRAP of GFP-FCA puncta in the presence of 10% (w/v) PEG. Time 0 indicates the time of the photobleaching pulse. Scale bar, 2 μm. Data are representative of nine independent experiments. h, Plot showing the time course of the recovery after photobleaching GFP-FCA puncta in the presence of 10% (w/v) PEG. Data are presented as the mean ± SD (n = 9). i, Fusion of GFP-FCA puncta in the presence of 10% (w/v) PEG. Time points are indicated in minutes above. Scale bar, 2 μm. Data are representative of three independent experiments. j, FRAP of GFP-FCA puncta in the presence of Arabidopsis total RNA. Time 0 indicates the time of the photobleaching pulse. Scale bar, 1 μm. Data are representative of eight independent experiments. k, Plot showing the time course of the recovery after photobleaching GFP-FCA puncta in the presence of Arabidopsis total RNA. Data are presented as the mean ± SD (n = 8).
Extended Data Fig. 3. Characterization of the sof78 mutation.
a, The seed development (top) and the petal number (bottom) of sof78 mutant and Ler wild type. Photos are representative of at least five independent experiments. b, FLC-LUC bioluminescence signal of indicated plants taken by CCD camera. Data are representative of three independent experiments. c, Expression of spliced FLC relative to UBC in the indicated genotypes. Data are presented as the mean ± SD (n = 4). Asterisk indicates a significant difference (P = 0.0014, two-tailed t test). d, Flowering time of indicated plants grown in long day photoperiod. Data are presented as the mean ± SD (n = 20). Asterisk indicates a significant difference (P < 0.0001, two-tailed t test). e, RT-PCR detection of FLC and UBC transcripts or PCR amplification of indicated fragments from genomic DNA. Data are representative of three independent experiments. f, Flowering time of indicated plants grown in long day photoperiod. Data are presented as the mean ± SD (n = 20). Asterisk indicates a significant difference (P < 0.0001, two-tailed t test). g, Flowering time of indicated plants grown in long day photoperiod. Data are presented as the mean ± SD (n = 8). Asterisks indicate significant differences (P ≤ 0.0077, two-tailed t test). h, Genomic FLL2 locus indicating upstream and downstream genes and positions of sof78 mutation and fll2-2 T-DNA insertion (top); illustration of transgenic FLL2-eYFP construct (bottom). Thick black boxes indicate exons, thin black boxes indicate UTRs and black lines indicate introns. i, RT-PCR detection of FLL2 and UBC transcripts in Col-0 and fll2-2. Data are representative of three independent experiments. j, Expression of spliced FLC relative to UBC in the indicated genotypes. Data are presented as the mean ± SD (n = 4). k, Flowering time of indicated plants grown in long day photoperiod. Data are presented as the mean ± SD (n = 12). l, Phylogenetic tree of FLX family proteins. The tree was drawn by PHYLIP program. Bootstrap values from 1000 trials are shown. m, FLC-LUC bioluminescence signal of indicated plants taken by CCD camera. Data are representative of three independent experiments. n, Flowering time of indicated plants grown in long day photoperiod. Data are presented as the mean ± SD (n = 10). Asterisk indicates a significant difference (P < 0.0001, two-tailed t test).
Extended Data Fig. 4. FLL2 encodes a coiled coil domain protein.
a, A fragment (55-243 aa) of FLL2 protein was blasted against the PDB_mmCIF70_5_Oct database using HHpred of MPI Bioinformatics Toolkit (https://toolkit.tuebingen.mpg.de/#/). Top 10 hits were shown. When the probability is larger than 95%, the homology is nearly certain. b, The alignment between coiled-coil domains of FLL2 and human ROCK1. Black arrowhead indicates the amino acid Glu mutated in sof78. c, A salt bridge was formed between E and R (indicated by red arrowheads in b) on two molecules of ROCK1. Data was obtained from Protein Contacts Atlas (http://www.mrc-lmb.cam. ac.uk/pca/). d, Plot showing the sequence conservation of FLL2. Analysis was done using the HmmerWeb server (https://www.ebi.ac.uk/Tools/hmmer/) by searching with Arabidopsis thaliana FLL2 within the taxonomy of plants “Ensembl genomes plants”, yielding 520 homologs within Streptophyta. The HMM logo shows the conservation for each amino acid for the 520 homologs. Black arrowheads indicate two amino acids predicted to form a salt bridge.
Extended Data Fig. 5. Characterization of FLL1 and FLL3.
a, Colocalization of FLL1-YFP and FLL3-YFP with FCA-CFP in tobacco leaf nuclei. Scale bars, 5 μm. Data are representative of three independent experiments. b, c, Top, protein domain structures of FLL1 and FLL3. Bottom, predictions of prion-like domains and disordered regions by PLAAC and D2P2 algorithms, respectively. d, Interactions of FCA with FLLs in yeast two-hybrid assay. Combinations of constructs were transformed into yeast AH109 strain and assayed on stringent medium. Three independent colonies were tested. E.V., empty vector. Data are representative of three independent experiments.
Extended Data Fig. 6. FLL2 promotes the formation of FCA nuclear bodies.
a, An example image showing the FCA-eGFP nuclear bodies in sof78 mutant background. 7-day-old Arabidopsis root tip was observed under confocal microscope. Region indicated in left panel was zoomed-in as right panel. Scale bars, 5 μm. Image is representative of eight independent experiments. b, A tobacco nucleus over-expressing FCA-YFP and FLL2. Scale bar, 5 μm. Data are representative of six independent experiments. c, Half-bleach of FCA-YFP body indicated in (b). Time 0 indicates the time of the photobleaching pulse. Scale bar, 1 μm. Data are representative of six independent experiments. d, Plot showing the time course of the recovery after photobleaching FCA body. Data are presented as the mean ± SD (n = 6). e, The effect of FLL2 overexpression on the pattern of FCA-CFP nuclear bodies assayed in tobacco leaf nuclei. Scale bars, 5 μm. Data are representative of three independent experiments. f, The protein level of FCA-CFP in indicated samples as determined by western blot. Asterisks indicate non-specific signal. Data are representative of three independent experiments. For gel source data, see Supplementary Figure 1.
Extended Data Fig. 7. Analysis of FCA, FPA, FY and CPSF30.
a, In vivo formaldehyde crosslinking gives much larger heterogenous FCA complexes. Nuclear extracts were prepared from crosslinked or non-crosslinked plants, half of the extracts were mixed with NuPAGE LDS Sample Buffer and boiled at 70°C, the other half extracts were reverse-crosslinked by heating at 95°C. Samples were analysed by western blot using FCA antibody. Data are representative of two independent experiments. For gel source data, see Supplementary Figure 1. b, c, Top, the annotated functional domains of FPA (a) and FY (b). Bottom, predictions of prion-like domains and disordered regions by PLAAC and D2P2 algorithms, respectively. d, The colocalization of CPSF30-YFP with FCA-CFP. CPSF30-YFP alone (top) or together with FCA-CFP (middle and bottom) are expressed in tobacco leaves. Images are representative of three independent experiments. Scale bars, top and middle, 20 μm; bottom, 5 μm.
Extended Data Fig. 8. Effect of sof78 mutation on the binding of FCA to the nascent transcripts of COOLAIR and UAs and proximal polyadenylation of UAs.
a-e, RNA-IP and qPCR analysis of FCA enrichment on the transcripts of COOLAIR (a), AT1G28140, UA2 (b), AT1G62820, UA5 (c), AT4G24660, UA16 (d) and AT3G23100, XRCC4d (e). Gene structures were shown at top. Data are presented as the mean ± SD (n = 3). Asterisks indicate significant differences (P ≤ 0.0381, two-tailed t test). Short black lines indicate positions of primers used for qPCR amplification. f-i, The expression levels of distally polyadenylated isoforms of UA2 (f), UA5 (g), UA16 (h) and XRCC4d (i) in the indicated plants relative to wild type. Data are presented as the mean ± SD (n = 3). Asterisks indicate significant differences (P ≤ 0.0099, two-tailed t test).
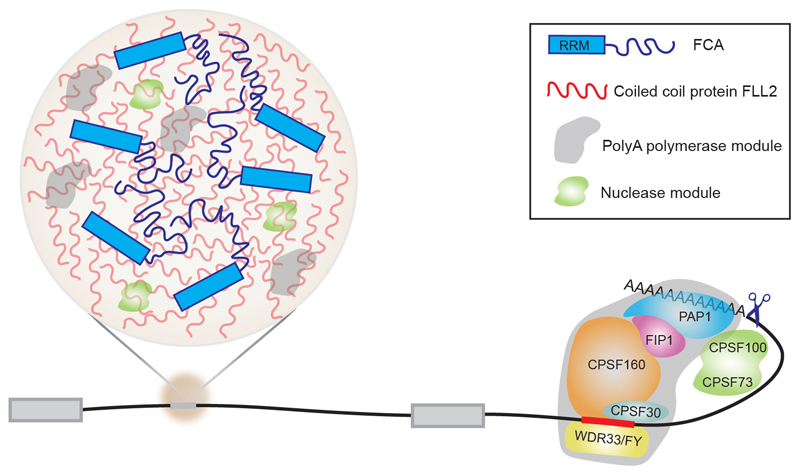
Extended Data Fig. 9. A working model for the role of the coiled coil protein FLL2 to promote nuclear bodies important for polyadenylation at specific sites.
At efficient polyA sites, the cleavage and polyadenylation specificity factor (CPSF) complex specifically recognizes the cis-acting motif upstream of the cleavage site, catalyzes pre-mRNA cleavage, and recruits polyA polymerase to initiate polyadenylation. At other sites, phase-separated FCA droplets compartmentalize 3’ end processing factors to enhance polyadenylation.
Extended Data Table 1. List of proteins identified by FCA and FLL2-HA affinity purification with or without formaldehyde crosslinking.
| No. of Matched Unique Peptides |
||||||||||
|---|---|---|---|---|---|---|---|---|---|---|
| Identified Protein | Accession No. | Mol. Mass (kDa) | FCA IP Crosslinking |
FCA IP No crosslinking |
FLL2-HA IP Crosslinking |
|||||
|
|
||||||||||
| IP1 | IP2 | IP3 | IP1 | IP2 | IP1 | IP2 | IP3 | |||
| FCA | AT4G16280 | 92 | 42 | 43 | 40 | 33 | 60 | 4 | 2 | 2 |
| FPA | AT2G43410 | 100 | 26 | 27 | 35 | 0 | 0 | 17 | 14 | 9 |
| FY | AT5G13480 | 72 | 8 | 9 | 10 | 0 | 0 | 0 | 0 | 0 |
| CPSF160 | AT5G51660 | 158 | 6 | 16 | 9 | 0 | 0 | 3 | 3 | 2 |
| CPSF100 | AT5G23880 | 82 | 3 | 10 | 6 | 0 | 0 | 0 | 0 | 0 |
| CPSF73 | AT1G61010 | 77 | 8 | 9 | 8 | 0 | 0 | 0 | 2 | 0 |
| CPSF30 | AT1G30460 | 28/70 | 2 | 3 | 3 | 0 | 0 | 0 | 0 | 0 |
| CFIS2 | AT4G25550 | 23 | 11 | 14 | 12 | 0 | 0 | 7 | 3 | 5 |
| AtFIPI | AT5G58040 | 133 | 9 | 7 | 6 | 0 | 0 | 0 | 3 | 0 |
| FLL2 | AT1G67170 | 40 | 4 | 3 | 4 | 0 | 0 | 21 | 22 | 25 |
Supplementary Material
Acknowledgements
We thank Dr M. M. Babu (MRC, Laboratory of Molecular Biology, Cambridge) and Prof. M. Howard (John Innes Centre) for helpful discussions. This work was supported by the European Research Council grant ‘MEXTIM’, the BBSRC Institute Strategic Programme GEN (BB/P013511/1), the European Union’s Horizon 2020 research and innovation programme under the Marie Sklodowska-Curie grant (800318), the JSPS overseas research fellowship to R.I., and the Medical Research Council grant (U105192713).
Footnotes
Author contributions
X.F. and C.D. conceived the study. X.F., Y.L. and G.C. performed all in vivo imaging experiments and analyses. X.F. performed the mass spectrometry experiments. R.I., B.R., D.W., M. F. and F.L. did the genetic identification and analysis of sof78 mutant. L.W. and P.L. performed and analysed in vitro phase separation assay. X.F., P.L. and C.D. wrote the manuscript, and all authors contributed ideas and reviewed the manuscript.
Competing interests
The authors declare no competing interests.
Data availability
Full lists of Mass spectrometry were provided as Supplementary Tables 1-4. All the other raw data that support the findings of this study are available from the corresponding authors upon reasonable request.
References
- 1.Banani SF, Lee HO, Hyman AA, Rosen MK. Biomolecular condensates: organizers of cellular biochemistry. Nat Rev Mol Cell Biol. 2017;18:285–298. doi: 10.1038/nrm.2017.7. [DOI] [PMC free article] [PubMed] [Google Scholar]
- 2.Shin Y, Brangwynne CP. Liquid phase condensation in cell physiology and disease. Science. 2017;357 doi: 10.1126/science.aaf4382. [DOI] [PubMed] [Google Scholar]
- 3.Li P, et al. Phase transitions in the assembly of multivalent signalling proteins. Nature. 2012;483:336–340. doi: 10.1038/nature10879. [DOI] [PMC free article] [PubMed] [Google Scholar]
- 4.Sonmez C, et al. RNA 3' processing functions of Arabidopsis FCA and FPA limit intergenic transcription. Proc Natl Acad Sci U S A. 2011;108:8508–8513. doi: 10.1073/pnas.1105334108. [DOI] [PMC free article] [PubMed] [Google Scholar]
- 5.Whittaker C, Dean C. The FLC Locus: A Platform for Discoveries in Epigenetics and Adaptation. Annu Rev Cell Dev Biol. 2017;33:555–575. doi: 10.1146/annurev-cellbio-100616-060546. [DOI] [PubMed] [Google Scholar]
- 6.Wu Z, et al. Quantitative regulation of FLC via coordinated transcriptional initiation and elongation. Proc Natl Acad Sci U S A. 2016;113:218–223. doi: 10.1073/pnas.1518369112. [DOI] [PMC free article] [PubMed] [Google Scholar]
- 7.Koornneef M, Hanhart CJ, van der Veen JH. A genetic and physiological analysis of late flowering mutants in Arabidopsis thaliana. Mol Gen Genet. 1991;229:57–66. doi: 10.1007/BF00264213. [DOI] [PubMed] [Google Scholar]
- 8.Sheldon CC, et al. The FLF MADS box gene: a repressor of flowering in Arabidopsis regulated by vernalization and methylation. Plant Cell. 1999;11:445–458. doi: 10.1105/tpc.11.3.445. [DOI] [PMC free article] [PubMed] [Google Scholar]
- 9.Liu F, Marquardt S, Lister C, Swiezewski S, Dean C. Targeted 3' processing of antisense transcripts triggers Arabidopsis FLC chromatin silencing. Science. 2010;327:94–97. doi: 10.1126/science.1180278. [DOI] [PubMed] [Google Scholar]
- 10.Simpson GG, Dijkwel PP, Quesada V, Henderson I, Dean C. FY is an RNA 3' end-processing factor that interacts with FCA to control the Arabidopsis floral transition. Cell. 2003;113:777–787. doi: 10.1016/s0092-8674(03)00425-2. [DOI] [PubMed] [Google Scholar]
- 11.Macknight R, et al. FCA, a gene controlling flowering time in Arabidopsis, encodes a protein containing RNA-binding domains. Cell. 1997;89:737–745. doi: 10.1016/s0092-8674(00)80256-1. [DOI] [PubMed] [Google Scholar]
- 12.Oates ME, et al. D(2)P(2): database of disordered protein predictions. Nucleic Acids Res. 2013;41:D508–516. doi: 10.1093/nar/gks1226. [DOI] [PMC free article] [PubMed] [Google Scholar]
- 13.Chakrabortee S, et al. Luminidependens (LD) is an Arabidopsis protein with prion behavior. Proc Natl Acad Sci U S A. 2016;113:6065–6070. doi: 10.1073/pnas.1604478113. [DOI] [PMC free article] [PubMed] [Google Scholar]
- 14.Molliex A, et al. Phase separation by low complexity domains promotes stress granule assembly and drives pathological fibrillization. Cell. 2015;163:123–133. doi: 10.1016/j.cell.2015.09.015. [DOI] [PMC free article] [PubMed] [Google Scholar]
- 15.Patel A, et al. A Liquid-to-Solid Phase Transition of the ALS Protein FUS Accelerated by Disease Mutation. Cell. 2015;162:1066–1077. doi: 10.1016/j.cell.2015.07.047. [DOI] [PubMed] [Google Scholar]
- 16.Riback JA, et al. Stress-Triggered Phase Separation Is an Adaptive, Evolutionarily Tuned Response. Cell. 2017;168:1028–1040 e1019. doi: 10.1016/j.cell.2017.02.027. [DOI] [PMC free article] [PubMed] [Google Scholar]
- 17.Kato M, et al. Cell-free formation of RNA granules: low complexity sequence domains form dynamic fibers within hydrogels. Cell. 2012;149:753–767. doi: 10.1016/j.cell.2012.04.017. [DOI] [PMC free article] [PubMed] [Google Scholar]
- 18.Liu F, et al. The Arabidopsis RNA-binding protein FCA requires a lysine-specific demethylase 1 homolog to downregulate FLC . Mol Cell. 2007;28:398–407. doi: 10.1016/j.molcel.2007.10.018. [DOI] [PubMed] [Google Scholar]
- 19.Marquardt S, et al. Functional consequences of splicing of the antisense transcript COOLAIR on FLC transcription. Mol Cell. 2014;54:156–165. doi: 10.1016/j.molcel.2014.03.026. [DOI] [PMC free article] [PubMed] [Google Scholar]
- 20.Zimmermann L, et al. A Completely Reimplemented MPI Bioinformatics Toolkit with a New HHpred Server at its Core. J Mol Biol. 2018;430:2237–2243. doi: 10.1016/j.jmb.2017.12.007. [DOI] [PubMed] [Google Scholar]
- 21.Kayikci M, et al. Visualization and analysis of non-covalent contacts using the Protein Contacts Atlas. Nat Struct Mol Biol. 2018;25:185–194. doi: 10.1038/s41594-017-0019-z. [DOI] [PMC free article] [PubMed] [Google Scholar]
- 22.Yang L, Embree LJ, Tsai S, Hickstein DD. Oncoprotein TLS interacts with serine-arginine proteins involved in RNA splicing. J Biol Chem. 1998;273:27761–27764. doi: 10.1074/jbc.273.43.27761. [DOI] [PubMed] [Google Scholar]
- 23.Manzano D, et al. Altered interactions within FY/AtCPSF complexes required for Arabidopsis FCA-mediated chromatin silencing. Proc Natl Acad Sci U S A. 2009;106:8772–8777. doi: 10.1073/pnas.0903444106. [DOI] [PMC free article] [PubMed] [Google Scholar]
- 24.Hornyik C, Terzi LC, Simpson GG. The spen family protein FPA controls alternative cleavage and polyadenylation of RNA. Dev Cell. 2010;18:203–213. doi: 10.1016/j.devcel.2009.12.009. [DOI] [PubMed] [Google Scholar]
- 25.Hunt AG, et al. Arabidopsis mRNA polyadenylation machinery: comprehensive analysis of protein-protein interactions and gene expression profiling. BMC Genomics. 2008;9:220. doi: 10.1186/1471-2164-9-220. [DOI] [PMC free article] [PubMed] [Google Scholar]
- 26.Forbes KP, Addepalli B, Hunt AG. An Arabidopsis Fip1 homolog interacts with RNA and provides conceptual links with a number of other polyadenylation factor subunits. J Biol Chem. 2006;281:176–186. doi: 10.1074/jbc.M510964200. [DOI] [PubMed] [Google Scholar]
- 27.Casanal A, et al. Architecture of eukaryotic mRNA 3'-end processing machinery. Science. 2017;358:1056–1059. doi: 10.1126/science.aao6535. [DOI] [PMC free article] [PubMed] [Google Scholar]
- 28.Lupas AN, Bassler J. Coiled Coils - A Model System for the 21st Century. Trends Biochem Sci. 2017;42:130–140. doi: 10.1016/j.tibs.2016.10.007. [DOI] [PubMed] [Google Scholar]
- 29.Fiumara F, Fioriti L, Kandel ER, Hendrickson WA. Essential role of coiled coils for aggregation and activity of Q/N-rich prions and PolyQ proteins. Cell. 2010;143:1121–1135. doi: 10.1016/j.cell.2010.11.042. [DOI] [PMC free article] [PubMed] [Google Scholar]
- 30.Franzmann TM, et al. Phase separation of a yeast prion protein promotes cellular fitness. Science. 2018;359 doi: 10.1126/science.aao5654. [DOI] [PubMed] [Google Scholar]
- 31.Baurle I, Smith L, Baulcombe DC, Dean C. Widespread role for the flowering-time regulators FCA and FPA in RNA-mediated chromatin silencing. Science. 2007;318:109–112. doi: 10.1126/science.1146565. [DOI] [PubMed] [Google Scholar]
- 32.Henderson IR, Liu F, Drea S, Simpson GG, Dean C. An allelic series reveals essential roles for FY in plant development in addition to flowering-time control. Development. 2005;132:3597–3607. doi: 10.1242/dev.01924. [DOI] [PubMed] [Google Scholar]
- 33.Jones JD, et al. Effective vectors for transformation, expression of heterologous genes, and assaying transposon excision in transgenic plants. Transgenic Res. 1992;1:285–297. doi: 10.1007/BF02525170. [DOI] [PubMed] [Google Scholar]
- 34.Rowan BA, Patel V, Weigel D, Schneeberger K. Rapid and inexpensive whole-genome genotyping-by-sequencing for crossover localization and fine-scale genetic mapping. G3 (Bethesda) 2015;5:385–398. doi: 10.1534/g3.114.016501. [DOI] [PMC free article] [PubMed] [Google Scholar]
- 35.Schneeberger K, et al. SHOREmap: simultaneous mapping and mutation identification by deep sequencing. Nat Methods. 2009;6:550–551. doi: 10.1038/nmeth0809-550. [DOI] [PubMed] [Google Scholar]
- 36.Rosa S. Measuring Dynamics of Histone Proteins by Photobleaching in Arabidopsis Roots. Methods Mol Biol. 2018;1675:455–465. doi: 10.1007/978-1-4939-7318-7_26. [DOI] [PubMed] [Google Scholar]
- 37.Macknight R, et al. Functional significance of the alternative transcript processing of the Arabidopsis floral promoter FCA. Plant Cell. 2002;14:877–888. doi: 10.1105/tpc.010456. [DOI] [PMC free article] [PubMed] [Google Scholar]
- 38.Tyanova S, et al. Visualization of LC-MS/MS proteomics data in MaxQuant. Proteomics. 2015;15:1453–1456. doi: 10.1002/pmic.201400449. [DOI] [PMC free article] [PubMed] [Google Scholar]
- 39.Fang Y, Spector DL. Identification of nuclear dicing bodies containing proteins for microRNA biogenesis in living Arabidopsis plants. Curr Biol. 2007;17:818–823. doi: 10.1016/j.cub.2007.04.005. [DOI] [PMC free article] [PubMed] [Google Scholar]
Associated Data
This section collects any data citations, data availability statements, or supplementary materials included in this article.
Supplementary Materials
Data Availability Statement
Full lists of Mass spectrometry were provided as Supplementary Tables 1-4. All the other raw data that support the findings of this study are available from the corresponding authors upon reasonable request.


