Abstract
The phase diagram of molecular or colloidal systems depends strongly on the range and angular dependence of the interactions between the constituent particles. For instance, it is well known that the critical density of particles with “patchy” interactions shifts to lower values as the number of patches is decreased [see Bianchi et al. Phys. Rev. Lett. 97, 168301 (2006)]. Here, we present simulations that show that the phase behavior of patchy particles is even more interesting than had been appreciated. In particular, we find that, upon cooling below the critical point, the width of the liquid-vapor coexistence region of a system of particles with tetrahedrally arranged patches first increases, then decreases, and finally increases again. In other words, this system exhibits a doubly re-entrant liquid-vapor transition. As a consequence, the system exhibits a very large deviation from the law of rectilinear diameter, which assumes that the critical density can be obtained by linear extrapolation of the averages of the densities of the coexisting liquid and vapor phases. We argue that the unusual behavior of this system has the same origin as the density maximum in liquid water and is not captured by the Wertheim theory. The Wertheim theory also cannot account for our observation that the phase diagram of particles with three patches depends strongly on the geometrical distribution of the patches and on the degree to which their position on the particle surface is rigidly constrained. However, the phase diagram is less sensitive to small angular spreads in the patch locations. We argue that the phase behavior reported in this paper should be observable in experiments on patchy colloids and may be relevant for the liquid-liquid equilibrium in solutions of properly functionalized dendrimers.
I. Introduction
Colloids can be used as building blocks for self-assembling materials.1–4 The nature of the phases that can be formed depends on the interactions between the colloids, which in some cases can lead to anomalous phase diagrams.5–7 Hence, the range of colloidal materials that can be made depends on our ability to manufacture colloids with tailor-made interactions. We can tune colloidal interactions by changing the range of the colloidal interactions, the shape of the colloids, and the angular distribution of attractive interactions. Also, exploring the behavior of mixtures of different types of colloidal patchy particles is gaining relevance.8–11 Here, we focus on the latter aspect: “patchiness,” i.e., the degree to which colloidal interactions can reproduce a predetermined “valency” by changing the number, strength, and location of attractive patches on their surface.1,12
In recent years, there has been considerable progress toward the synthesis of patchy colloids (see, e.g., Ref. 13), but the geometry of synthetic patchy colloidal particles cannot yet be controlled to a degree that allows unambiguous comparison with simulations.14–23 It is fair to ask if there are convincing reasons to improve the geometry control of synthetic colloids. Below, we argue that the answer to this question is “yes:” the properties of patchy colloids are highly nontrivial and, moreover, depend on the distribution of the attractive patches on their surface.24 In particular, we will show that ideal tetrahedral patchy colloids show unexpected re-entrant condensation and that the phase behavior of colloids with three patches depends sensitively on the distribution of the patches, showing that control over geometry is important. However, a small spread in the location of the patches around their average position has limited effect on the predicted phase behavior.
II. Patchy Particle Model for MD Simulations
In this work, we use molecular dynamics (MD) simulations to study the phase behavior of patchy colloids. For MD simulations, it is convenient (although not essential25,26) to use a continuous potential to describe the interaction between patches.
The model that we have used (henceforth referred to as MD-Patchy) can be easily implemented in well parallelized open-source MD packages. MD-Patchy is sufficiently efficient to allow us to run large numbers of long simulations on large systems, within a reasonable amount of time. Using MD is important, as we shall be studying direct coexistence (DC): NVT Monte Carlo (MC) simulations are notoriously slow in equilibrating such systems, but the grand-canonical MC simulations of Ref. 27 should not suffer from this problem.
We have used the MD-Patchy model to evaluate Liquid-Vapor (L-V) diagrams of colloidal patchy particles with different numbers of patches or valencies (M), patch geometries, and specificity. We start by validating the model against the results previously reported by Bianchi et al.27 and discussing how the results of our model contrast with the predictions of Wertheim’s perturbation theory.28–32 To that end, we calculated the L-V equilibrium for colloidal particles with four patches (M = 4). We use the shorthand notation p-p (i.e., M = 4 p-p) to describe a model for which all four patches are equivalent (any patch can attract any other patch). In contrast, p-ap means that there are two patches of type A and two patches of type B such that attraction is only possible between A and B. The M = 4 p-ap case will be considered in Sec. IV D. In addition, we have considered particles with three patches of the p-p type, M = 3°–120° (where 120° indicates that the angles between the vectors from the center of the patchy particle to each patchy site are 120°). We then demonstrate that the location of the L-V binodal depends not only on the number of patches but also on their angular distribution and their specificity.
In what follows, we model patchy particles as (almost) hard-spheres (HS) with diameter σ, decorated with M attractive sites (“patches”) on their surface (see Fig. 1). Each patch represents a particle-particle binding site. For the model of the almost hard spheres, we use a potential of the form proposed in Ref. 33,
| (1) |
where λa = 49 and λr = 50 are the exponents of the attractive and repulsive terms chosen for computational convenience. The interaction strength εR accounts for the energy of the pseudohard-sphere interaction (PHS) and σ is our unit of length. r denotes the center-to-center distance between hard-sphere particles. For the associative sites or patches, we use a continuous attractive square-well (CSW) interaction proposed in Ref. 34,
| (2) |
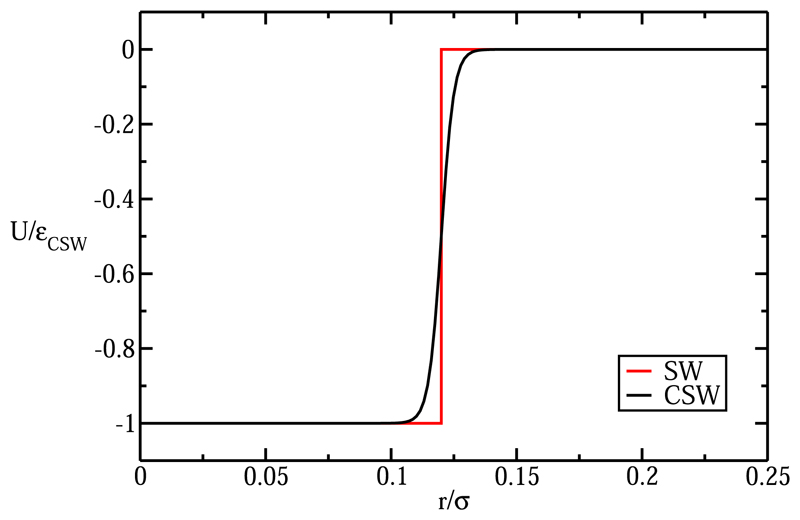
where r is the distance between the centers of two attractive patches, rw is the radius of the attractive well, while α controls the steepness of the well. εCSW is the unit of energy in our simulations. In Fig. 2, we show a comparison of the CSW potential and the more conventional discontinuous square-well potential.
Fig. 1.
Different patchy particles modeled in this work. Hard-sphere cores are depicted by gray spheres while attractive sites are represented by red and blue hemispheres. Vectors from the center of the hard sphere to the attractive sites on the surface are drawn to show the distribution of the sites. From the left to the right, colloidal particles with four attractive sites in a tetrahedral arrangement (M = 4 p-ap, where only sites of different colors are allowed to interact, and M = 4 p-p, where all attractive sites can interact) and three attractive sites of the p-p type in an equatorial plane arrangement with angles between the vectors of 120° (M = 3°–120°) and with angles between vectors of 90°, M = 3°–90°.
Fig. 2.
Comparison of the continuous representation of the square-well potential (CSW) described in Eq. (2) and the corresponding square-well interaction (SW). In both cases, rw was set equal to 0.12 σ.
Given that all potentials used are continuous and differentiable, they can be employed in conventional Molecular Dynamics simulations. Each colloidal patchy particle is characterized by M + 1 interaction sites: one central site accounts for the hard-spherelike interaction and M sites located on a spherical surface with radius σ/2 representing the attractive sites. In our colloidal patchy particles, both the hard-sphere plus attractive sites are defined as a multicenter rigid body.
The choice of the mass is irrelevant for equilibrium simulations. We chose the masses of the interaction sites to be equal to 5% of the mass of the central particle (with the latter equal to 3.32 × 10⁻²⁶ kg). This ratio fixes the moment of inertia of the patchy particles, but again this choice has no effect on the equilibrium properties. In what follows, we chose α = 0.005 σ and rw = 0.12 σ. For this small value of rw, the valency of each individual patch is one (i.e., each attractive site can interact with at most one other patch at a time). Our model is essentially identical to the one used by Bianchi et al.27
In what follows, we use reduced units: T* = kBT/εCSW, and time as In order to keep the isotropic HS-like interaction in our simulations as similar as possible to a pure HS interaction, we follow Ref. 33 and fix kBT/εR at a value 1.5.33,35 We then control the effective strength of the attraction by varying εCSW such that the reduced temperature T* = kBT/εCSW is of order 𝒪(0.1).
III. Methods and Simulation Details
To locate the boundaries between the various phases of our model systems, we used the Direct Coexistence (DC) simulation method.35–37 DC simulates coexistence by preparing periodically extended slabs of the two coexisting phases, e.g., the liquid and the vapor, in the same simulation box. For the liquid-vapor equilibrium DC simulations, we prepare the initial configurations by using the following procedure. We first equilibrate the liquid phase in an NPT simulation at p* = 0 and at low T* (where the equilibrium vapor pressure is negligible) using a cubic box. After the liquid has been properly equilibrated, we elongate the periodic box in one direction (say, x) by flanking the original simulation box by two empty cubic boxes. We then perform constant NVT MD simulations at different temperatures. Once the system has reached equilibrium, we estimate the equilibrium densities of each phase by computing a density profile along the long side of the box. By calculating the pressure tensor during the simulation, the L-V interfacial free energy (γ) can be evaluated using the following expression:
| (3) |
where LN denotes the length of the long edge of the simulation box, pN denotes the normal component of the pressure tensor perpendicular to the interface, and pT denotes the average of the tangential components of the pressure tensor.
We estimate the critical temperature in L-V diagrams, by fitting the density difference between the coexisting low-density and high-density fluid phases of the upper points of the phase diagram to the expression
| (4) |
where ϕl and ϕυ are the volume fractions of the coexisting phases and d is a fitting parameter. The critical packing fraction, ϕc, is estimated assuming that the law of rectilinear diameter holds close to
| (5) |
We note that our estimate of the critical point is approximate and subject to finite size effects. We did not attempt to carry out a systematic finite-size scaling analysis38 because we are mainly interested in the qualitative features of the phase diagram. To compute the Liquid-Solid (L-S) coexistence lines, we also used the DC methodology. We start by preparing an initial configuration consisting of a half-liquid half-solid simulation box. We equilibrate a NPT simulation of the bulk solid phase and then melt it (NVT simulation at a high temperature). Once melted, we equilibrate the melted liquid phase in a NPxT simulation, keeping constant the cross section of the simulation box. Next, we “glue” the liquid and the solid box together, avoiding particle overlaps, and we equilibrate the liquid-solid interface for a short time. To locate the coexistence pressure, we choose isotherms and perform NPxT simulations at different values of Px. Finally, our estimate for the coexistence point is half way between the lowest pressure for which the crystal slab grows and the highest one for which it melts.
We carry out all the simulations in LAMMPS.39 Our typical system sizes for evaluating the L-V diagram were 1200 patchy particles for the lowest temperatures and 2400 for the highest ones where finite size effects can be larger due to the proximity of a critical point. To reach the equilibrium in a typical simulation of a system of 2400 particles at moderate T*, it took around eight days of computation using 16 central processing units (CPUs) working in parallel. Regarding the simulations performed to evaluate freezing lines, systems sizes were of about 3000 patchy particles, with half of the system forming the crystalline slab and the other half belonging to the liquid phase. By using the same number of CPUs, these simulations usually took six days. With respect to the numerical details of our simulations, the timestep chosen for the Verlet integration of the equations of motion was Δt = 0.0004 in reduced units (that corresponds to 0.5 fs in the LAMMPS input file). The cutoff radius for both HS and CSW interactions is 1.175 σ. We use the Nosé-Hoover thermostat40,41 for NVT simulations with a typical relaxation time of 0.1 in reduced units. In the case of NPT simulations, the Nosé-Hoover barostat was used42 (in combination with the Nosé-Hoover thermostat) with a typical relaxation time of 0.5 in reduced units. To account for the rotational motion of the patchy particles, we described the colloidal particles as rigid bodies, using the method implemented in LAMMPS.43 The geometries of the various patch distributions are shown in Fig. 1. All the files needed for running an example simulation of the MD-Patchy model in LAMMPS can be downloaded from the webpage.44 Notice that the example is for the M = 4 p-p case, but the files can be easily modified to simulate any other type of colloidal patchy particles.
IV. Results
A. Validation of the model against a discontinuous potential
To validate our MD-Patchy model, we compare our simulation results for the L-V equilibrium with the earlier simulations of Bianchi et al.,10,27 who used a discontinuous potential (i.e., with a HS potential and patchy sites interacting through short range square well potentials) that is very well approximated by our MD-Patchy model. In particular, we computed the L-V coexistence curves for particles with three and four patches. Notice that particles with only two patches do not have L-V equilibrium.45
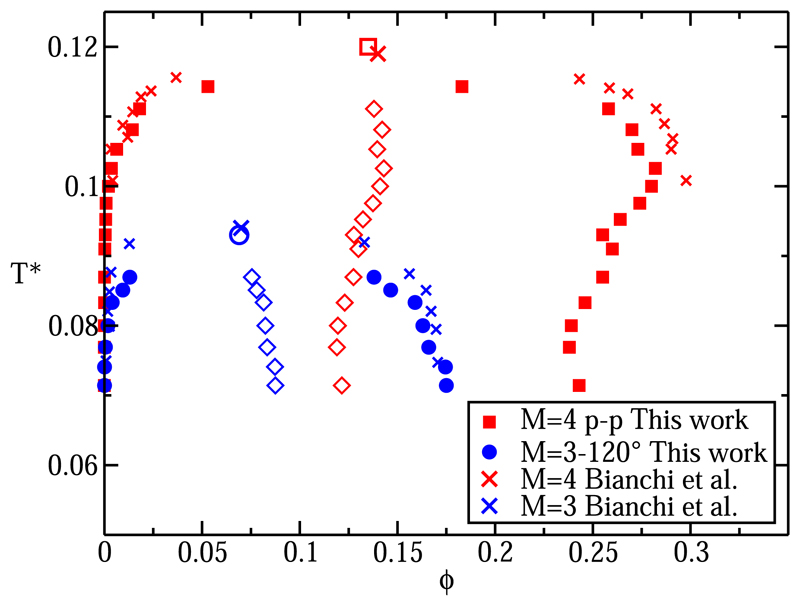
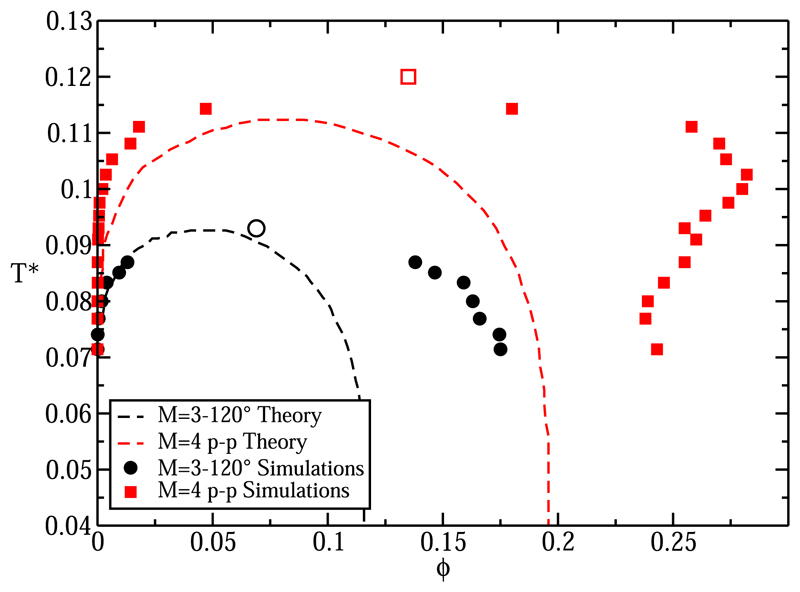
In Fig. 3, we compare our estimates for the location of the critical point with those of Bianchi et al.10,27 As found in Refs. 10 and 27, Fig. 3 shows that increasing the valency expands the L-V equilibrium region shifting T* and toward higher values. However, interestingly, we find that for the four-patch system, the liquid branch of the L-V coexistence curve shows a maximum and a minimum as the temperature is decreased below
Fig. 3.
L-V equilibrium curves for M = 4 p-p (red squares) and M = 3°–120° (blue circles). Empty squares (M = 4 p-p) and circle (M = 3°–120°) account for the estimated location of the critical points obtained via Eqs. (4) and (5) and crosses account for the calculated equilibrium packing fractions and critical points of a discontinuous potential from Refs. 10 and 27. Empty diamonds account for the averaged packing fractions between the liquid and the vapor phases. Only the four upper ones (in both cases) have been used for estimating the location of critical point.
To verify that the observed maximum and minimum in the density of the liquid coexisting with the vapor phase are not artefacts, we repeated the simulations starting from different initial conditions, one with a density higher than the computed liquid-phase coexistence density and the other with a lower one. Both simulations converged to similar values of density of the coexisting liquid.
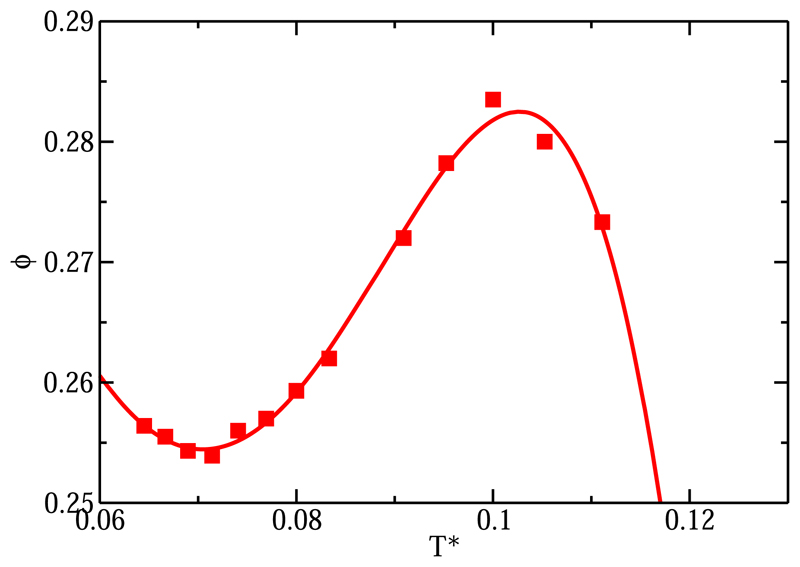
As an additional check, we computed the volume fraction of the M = 4 p-p fluid for several temperatures along the p* = 0 isobar (Fig. 4), which also shows a nonmonotonic temperature variation of the liquid density. Earlier simulations had found evidence for the presence of a weak minimum in the pressure as a function of temperature at T* ≈ 0.105 for hard, tetrahedral patchy particles.26 In addition, in a study of a different but related model (tetrahedral patchy origami particles), Ciarella et al. presented evidence for a nonmonotonic density dependence of the internal energy of the system.46 In fact, direct inspection of the phase diagram reported in this paper suggests a nonmonotonic variation of the density of the coexisting fluid with temperature, but the corresponding density histograms do not show a clear trend, and the authors do not comment on this aspect of the phase diagram.46 A density maximum was not reported in the phase diagram of tetrahedral patchy particles in Ref. 47, but this may be due to the fact that the models studied in that paper had different patch-patch interactions. We note that a doubly re-entrant binodal is also predicted by Wertheim’s first order perturbation theory, but only for particles with two types of patches, for a range of interaction strength ratios48 that could be argued to be mimicking a tetrahedral arrangement (although strictly speaking, such geometrical information is absent from the Wertheim theory).
Fig. 4.
Packing fraction of the fluid for the isobar of p* = 0 for the four-patch colloid (M = 4 p-p, red squares).
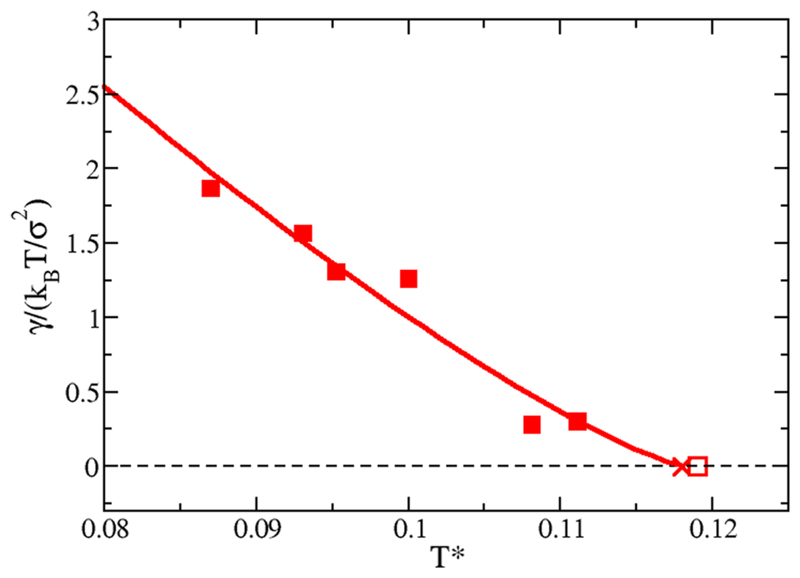
To estimate the critical points (empty square for M = 4 p-p and empty circle for M = 3°–120°) of Fig. 3, we use Eqs. (4) and (5). As shown in Fig. 3, for M = 3°–120°, the law of rectilinear diameter works reasonably well, but for M = 4 p-p, it fails below temperatures of T* = 0.1. In both systems, only the 4 upper points (empty diamonds) have been used to estimate the critical packing fraction. As a comparison, we also determine the critical temperature by fitting the liquid-vapor interfacial free energies as a function of temperature. can be extracted by assuming that just below γ scales as ( − T*)1.26 (see Fig. 5). The fact that γ is zero at is well known,49 and similar results as the ones shown in Fig. 5 have been also previously reported for other types of colloidal patchy particles.50
Fig. 5.
Liquid-vapor interfacial free energies for M = 4 p-p. The empty square represents the value of estimated using Eq. (4). The cross corresponds to the estimate estimate obtained in Ref. 27.
B. Comparison with Wertheim theory
In the work of Bianchi et al.,10,27 the simulations results are compared with the predictions of Wertheim’s first order thermodynamic perturbation theory (TPT1),27,30–32 for various patch geometries. We do the same because later we will compare simulations of systems with different patch arrangements that, at least within the Wertheim theory, should have the same phase diagram. Figure 6 shows our simulation results for the M = 3°–120° and M = 4 p-p L-V phase diagrams, together with the theoretical predictions based on Wertheim’s theory from Ref. 27 (dashed red curve for M = 4 p-p and dashed black curve for M = 3°–120°). The theoretical prediction for the L-V coexistence curve is reasonable for the three-patch system and better than for the four-patch system. Crucially, in the case of the four-patch system, the presence of a maximum and a minimum in density is not predicted by perturbation theory.10,27,51 This failure of TPT1 is not surprising as the limitations of this theory for the description of tetrahedral fluids (as in the case of water) are well known.52–54
Fig. 6.
Comparison between the results of the MD-Patchy model and Wertheim’s perturbation theory for M = 3°–120° and M = 4 p-p in the L-V T*–ϕ diagram. Symbols account for simulation results, and dashed lines (red for M = 4 p-p and black for M = 3°–120°) accounts for the theoretical predictions.
The shape of the LV coexistence curve predicted by Wertheim’s perturbation theory depends on several factors such as the number of associative sites, the specificity of the interactions among the different sites, and the range of the interaction. However, the theory does not account for the effect of the geometrical distribution of the interaction sites on the surface of the particles and whether they are symmetrical or asymmetrical.10,55,56
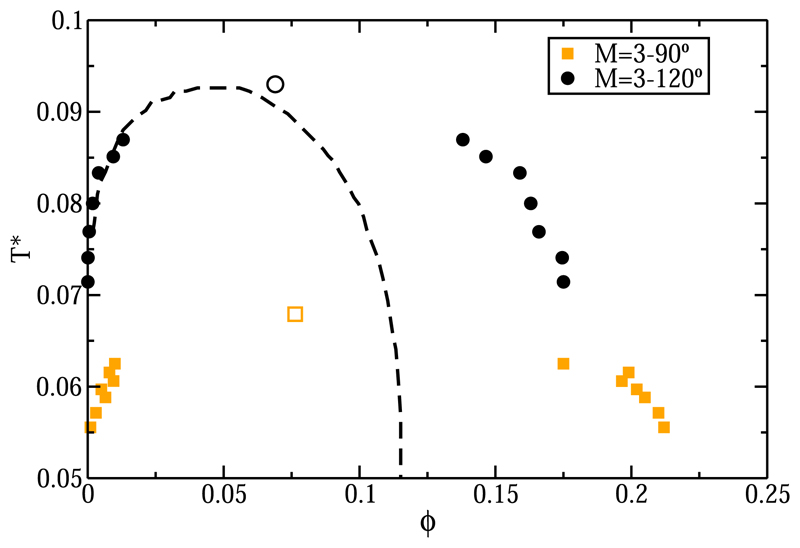
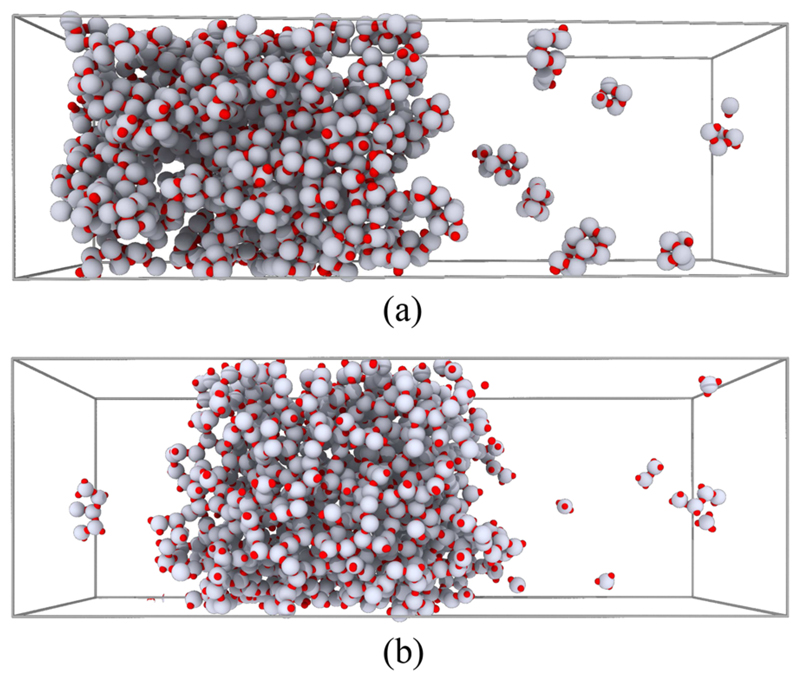
In order to study whether the geometry of the patch arrangement has a pronounced effect on the L-V equilibrium, we designed a three-patch system with vectors from the HS particle to the interaction sites that are all mutually perpendicular (see Fig. 1). Figure 7 shows the L-V phase diagram for the M = 3°–90° system. Although the packing fraction for the liquid branch and the critical ϕ are comparable at low temperatures, the value of for M = 3°–90° is considerably lower than the one of the M = 3°–120° system. Figure 7 also shows the theoretical prediction for the three-patch system. We find that the Wertheim theory is in much better agreement with the M = 3°–120° L-V results than with the ones for the M = 3°–90° model. It seems likely that the L-V diagram of M = 3°–90° compares poorly with TPT1 because it can form “inert” cubic structures (see Fig. 8); the TPT1 does not account for this possibility. At this stage, it is not yet known if a recently proposed generalization of Wertheim’s theory for the assembly of rings and closed loop structures57 would perform better for the case of M = 3°–90°.
Fig. 7.
L-V phase diagram in the T*–ϕ plane for both three-patch systems, one with patches located on the equatorial plane (M = 3°–120°, black circles) and the other with a Cartesian arrangement. (M = 3°–90°, orange squares). Empty symbols account for the estimation of the critical points in each case. Dashed black line represents the L-V equilibrium from Wertheim’s theory for M = 3.
Fig. 8.
(a) Snapshot of a direct coexistence simulation of the Cartesian three-patch system (M = 3°–90°) at T* = 0.057. Small closed structures (cubes) can be observed in the vapor phase. (b) The same for a system of M = 3°–120° at T* = 0.0833. Notice that in (b) no closed structures appear in the vapor phase.
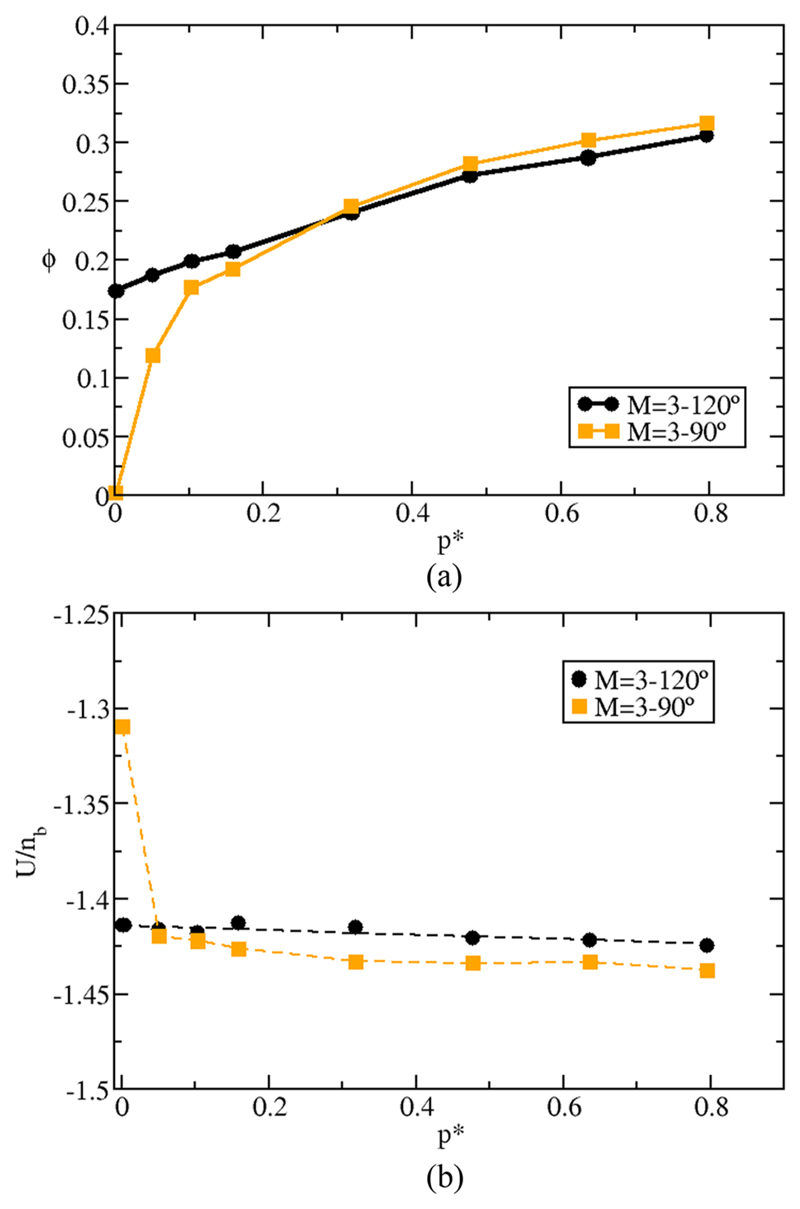
While it is not surprising that different patch geometries result in different phase diagrams, the magnitude of the effect is unexpectedly large. Figure 9 shows ϕ (a) and U (b) as a function of p* for the two different 3-patch models at T* = 0.075. In both cases, the simulations were started from a fluid equilibrated at p* = 0.8. Subsequently, the pressure was decreased down to p* = 0.01. For the M = 3°–120° system, T* = 0.075 is below the critical temperature, and as we start from a liquid density, the system remains liquid upon decreasing the pressure down to the coexistence region. In contrast, for the M = 3°–90° system, T* = 0.075 is above and hence ϕ tends to zero as p* → 0. Yet for pressures above p* = 0.1, the two 3-patch systems behave similarly (see Fig. 7). Not surprisingly, similar behavior is observed for the potential energy [Fig. 9(b)].
Fig. 9.
(a) Packing fraction for the M = 3°–120° three-patch colloid (black circles) and for the M = 3°–90° one (orange squares) as a function of pressure p* for the isotherm of T* = 0.075. (b) Same as in (a) but for the potential energy (U). Units of U are given in number of bonds per particle (nb). Notice that the potential energy also includes the contribution from the HS repulsive interactions.
C. Flexibility vs rigidity
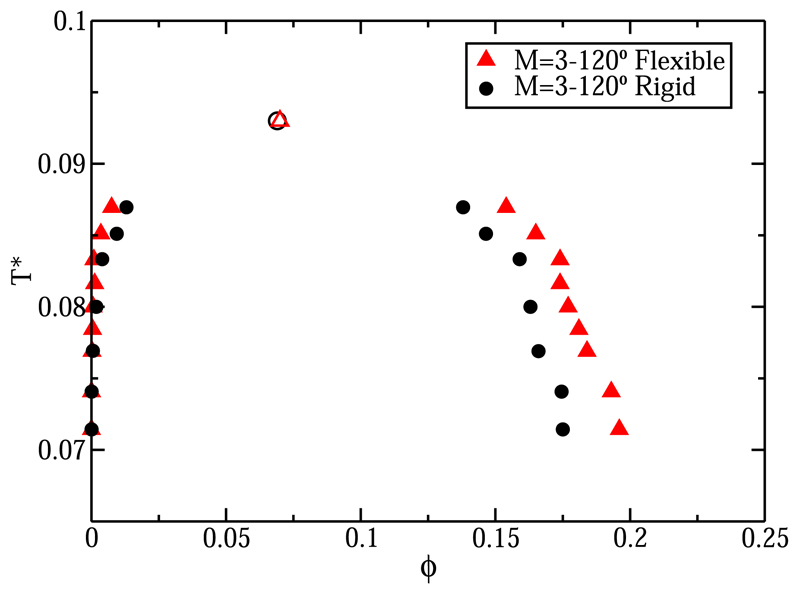
Having established that the phase diagram of a patchy-particle fluid is sensitive to the geometric distribution of patches, it is clearly interesting to know what the effect of relaxing the geometric constraints on the location of the attractive patches is. To investigate this, we consider how the L-V phase diagram of the M = 3°–120° three-patch system changes if we allow the patches to fluctuate moderately (±15° as maximum) around their original position. To implement flexibility in our model, we introduce a bond-angle potential with a strength of about 2 εCSW between the vectors joining the center of the particle to the patchy interaction sites. The distance from the particle center to the patches was kept constant at σ/2. Figure 10 shows that the L-V coexistence densities for the flexible (red triangles) system are very similar to those of the rigid system (black circles). To be more precise, in both cases, the critical volume fraction and temperature are approximately the same, and the main difference appears in the liquid branch where ϕ is slightly higher for the flexible model. However, density shift is a minor effect compared to the effect of the overall patch geometry on the location of the L-V coexistence curve.
Fig. 10.
L-V phase diagram for the rigid M = 3°–120° three-patch colloid (black circles) and for the flexible one (red triangles). Empty symbols mean the estimated critical points for each model.
D. Effect on patch specificity
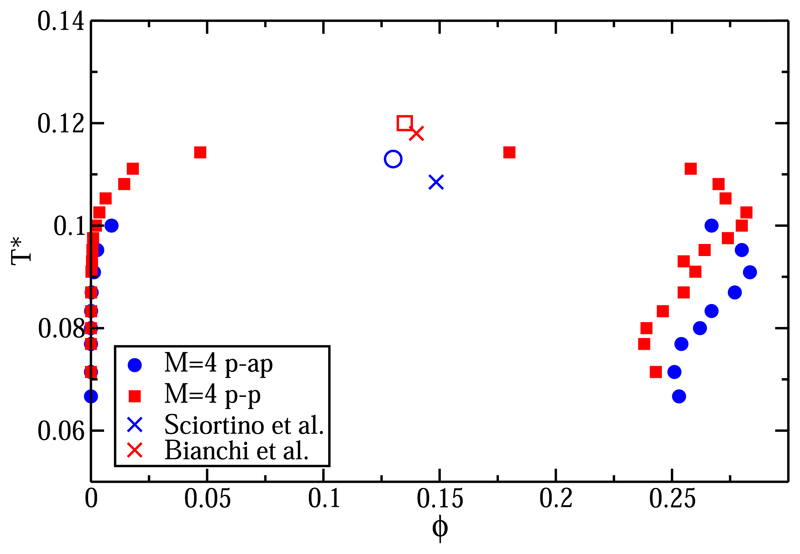
As shown in Ref. 47, the phase behavior of patchy particle systems depends strongly on whether all patches interact equally strongly or certain patches can interact only with specific complementary patches. The effect of selective patch-patch interactions is well known from the study of a patchy particle model for water [the primitive model of water (PMW)58]. The latter model consists of a HS particle decorated with four associative sites that are tetrahedrally arranged. In the PMW, two of the patches represent the hydrogen atoms (sites A) and the other two patches represent the lone-pair electrons (sites B). In PMW, only A sites are allowed to interact with B sites. In Fig. 11, we compare our results for the non-specific four-patch system, where all sites were equivalent (denoted in Fig. 11 as M = 4 p-p), to a specific four-patch system (denoted M = 4 p-ap for patch-antipatch), where only A-B interactions are attractive, as in the PMW. In Fig. 11, we also include the values for the critical points estimated for the M = 4 p-p case from Refs. 10 and 27 and for the PMW model (which is slightly different from our model in terms of the distance from the lone pair patches to the center of the particles, 0.45 σ, and in terms of the cutoff of the patchy interaction, 0.15 σ) from Refs. 26 and 59. In Fig. 11, we show that both systems exhibit L-V phase diagrams with a maximum and a minimum in density. However, when only specific interactions are allowed (blue circles), the location of the critical temperature is shifted to lower values. This decrease in critical temperature is consistent with the earlier simulations of Filion et al.47,59 However, the model used in Ref. 47 was different from the one used in the present work and did not show clear evidence of a nonmonotonic variation with the temperature of the density of the liquid phase. The shift in the critical temperature between the M = 4 p-p and M = 4 p-ap systems (ΔT* ≈ 0.015 is well accounted for (ΔT* ≈ 0.01) by TPT1 (see Ref. 53 for the PMW case and Ref. 27 for the M = 4 p-p model).
Fig. 11.
Coexistence densities for the L-V equilibrium of a four-patch colloid with four equivalent patches (M = 4 p-p) and for a four-patch colloid with two patches type A and two patches of type B, where attractive interactions are only allowed between A-B ones (M = 4 p-ap). Crosses indicate the location of the critical points for the discontinuous version of the M = 4 p-p reported in Refs. 10 and 27 and for the PMW model reported in Refs. 26 and 59.
E. Liquid-solid vs liquid-vapor equilibrium
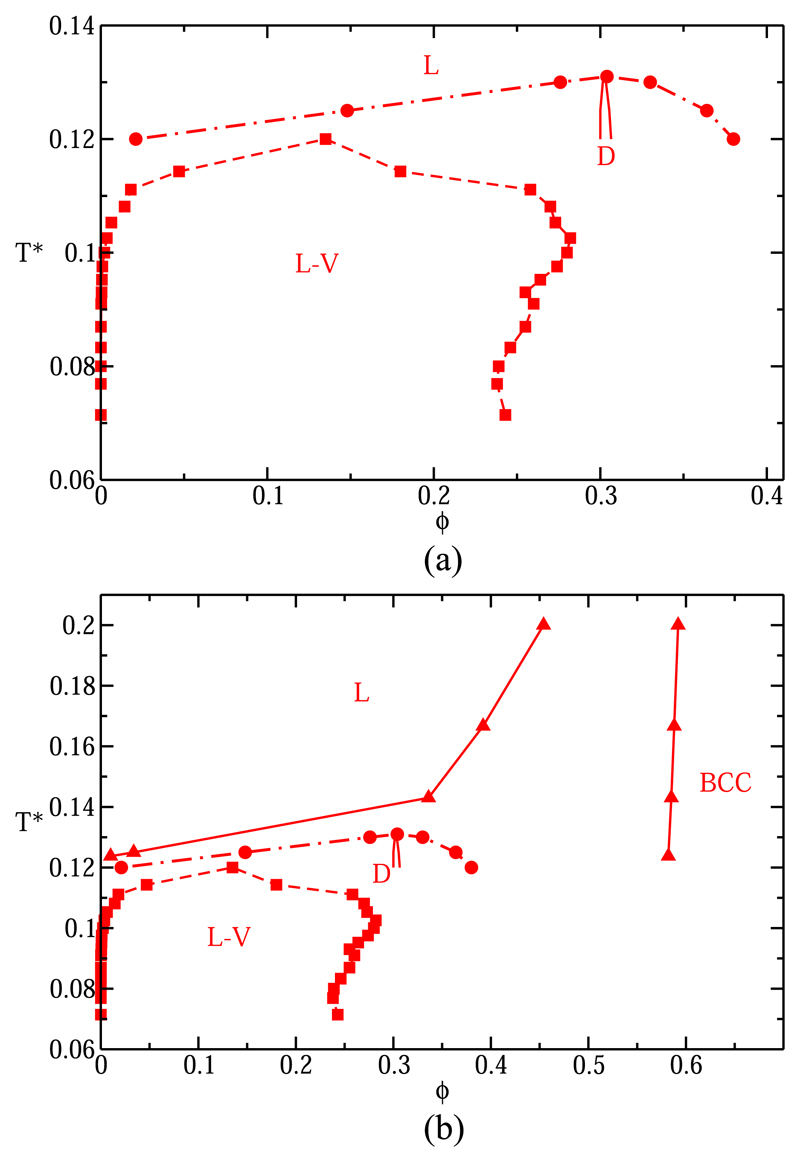
Using the MD-Patchy model described above, we can also study solid-fluid coexistence for patchy particles. We have carried out such simulations for the four-patch system60 (M = 4 p-p), considering two different solid crystalline phases, namely, a low-density diamond structure (D) and a BCC-like interpenetrating double-diamond structure (BCC), which is a high-density solid phase formed by two interpenetrated but not interconnected diamond structures (i.e., the analogous of ice VII in the phase diagram of water). Although we denote this structure as BCC as the spheres form a simple BCC lattice, notice that each sphere is bonded to only four nearest neighbors [as in the NaTI (B32) structure]. Both these crystal phases resemble different ice phases. The diamond phase can be interpreted as cubic ice I and the BCC-like phase as ice VII. These structural similarities are independent of allowing patch-patch interactions (instead of patch-antipatch as in water), as they emerge simply from the tetrahedral geometry of the patches around the hard core. By means of NPT direct coexistence simulations, we have identified the coexistence pressure for several isotherms by bracketing it between the lowest pressure at which the solid crystallized and the highest one at which it melted. In Fig. 12(a), we show the coexistence packing fractions between the liquid and the vapor (red squares) and between the liquid and the diamond phase (red circles and thick line). The L-V equilibrium is metastable with respect to the diamond phase, which has a re-entrant stability as ϕ (pressure) increases. We note that the meta-stable diamond structure is always less stable than the liquid for T* > 0.131. As we increase the pressure at constant temperature T* = 0.126, we observe first a liquid phase, which freezes into the diamond phase. As we keep increasing the pressure beyond the point where the low density fluid has been fully converted into diamond, the diamond phase melts again. We find that the density of the diamond phase varies by barely 0.2% between T* = 0.06 and T* = 0.12.
Fig. 12.
T*–ϕ diagram for the p-p four-patch colloid. L-V equilibrium is represented by squares joined by dashed lines. In (a), liquid packing fractions for the liquid-diamond transition are represented by circles, and the thick continuous line accounts for the diamond packing fraction at coexistence conditions. (b) The same as in (a) but also considering the coexistence packing fractions along the freezing line between liquid and BCC (triangles).
The maximum of the diamond-liquid coexistence curve in our model is at T* = 0.131 and ϕ = 0.305, which is similar to the one reported in for the PMW model (approximately T* = 0.13 and ϕ = 0.3).53 At the highest point on the diamond-liquid coexistence curve, the density of both phases is the same. However, the solid-liquid transition is still first a first order transition since the melting enthalpy is nonzero.
We note that the L-D curves for the p-p and p-ap 4-patch models behave almost identically; this in contrast to the LV binodals.
If we now also consider the high density crystal phase, BCC, we find [see Fig. 12(b)] that BCC is always more stable than the diamond phase, as the fluid coexisting with the BCC phase has a lower density (and hence a lower free energy) than the D phase. The coexistence ϕ between the liquid and the BCC crystal phase (red triangles) is shown in Fig. 12(b). Our results obtained for the L-BCC coexistence curve are in good agreement with the ones reported previously for the same freezing line of a p-p four-patch system in Ref. 61 using a discontinuous colloidal patchy model.62 Hence, the L-V coexistence occurs in a temperature density regime where the fluid is less stable than both the D and BCC phases.
V. Concluding Remarks
One of the striking features of the L-V phase coexistence curve of the 4-patch model is that the density maximum is very close to the critical temperature. This is clearly very different for water, where the density maximum at low pressures is at temperatures that are far removed from the critical temperature. It would be interesting if experimental systems could be prepared such that they would exhibit a density maximum close to the critical temperature. One consequence of the unusual shape of the L-V coexistence curve is that the law of rectilinear diameter (i.e., the rule that suggests that the critical density can be found from a linear extrapolation of the average of the densities of the coexisting liquid and vapor) has an anomalously small region of validity.
Acknowledgments
This project was funded by the European Research Council (ERC) under the European Union Horizon 2020 Research and Innovation programme (Grant Agreement No. 803326). We also acknowledge financial support from the Winton Programme for the Physics of Sustainability. A.G. is funded by an EPSRC studentship (EP/N509620/1). C.V. acknowledges funding from Grant No. FIS2016/78117-P of the MEC. This work was performed using resources provided by the Cambridge Tier-2 system operated by the University of Cambridge Research Computing Service (http://www.hpc.cam.ac.uk) funded by EPSRC Tier-2 capital Grant No. EP/P020259/1. We gratefully acknowledge F. Sciortino for useful comments. A.G. personally acknowledges J. Zufia.
Footnotes
Jorge R. Espinosa: http://orcid.org/0000-0001-9530-2658
Adiran Garaizar: http://orcid.org/0000-0002-9320-2984
Carlos Vega: http://orcid.org/0000-0002-2417-9645
Daan Frenkel: http://orcid.org/0000-0002-6362-2021
Rosana Collepardo-Guevara: http://orcid.org/0000-0003-1781-7351
References
- 1.Zhang Z, Glotzer S. Self-assembly of patchy particles. Nano Lett. 2004;4:1407–1413. doi: 10.1021/nl0493500. [DOI] [PubMed] [Google Scholar]
- 2.Pons-Siepermann IC, Glotzer SC. Design of patchy particles using quaternary self-assembled monolayers. ACS Nano. 2012;6(5):3919–3924. doi: 10.1021/nn300059x. [DOI] [PubMed] [Google Scholar]
- 3.Pons-Siepermann IC, Glotzer SC. Design of patchy particles using ternary self-assembled monolayers. Soft Matter. 2012;8(23):6226–6231. doi: 10.1021/nn300059x. [DOI] [PubMed] [Google Scholar]
- 4.Teixeira PIC, Tavares JM. Phase behaviour of pure and mixed patchy colloids: Theory and simulation. Curr Opin Colloidal Interface Sci. 2017;30:16–24. [Google Scholar]
- 5.Russo J, Tavares JM, Teixeira PIC, da Gama MT, Sciortino F. Re-entrant phase behaviour of network fluids: A patchy particle model with temperature-dependent valence. J Chem Phys. 2011;135(3):034501. doi: 10.1063/1.3605703. [DOI] [PubMed] [Google Scholar]
- 6.Russo J, Tavares JM, Teixeira PIC, da Gama MT, Sciortino F. Reentrant phase diagram of network fluids. Phys Rev Lett. 2011;106(8):085703. doi: 10.1103/PhysRevLett.106.085703. [DOI] [PubMed] [Google Scholar]
- 7.Oleksy A, Teixeira PIC. Liquid-vapor interfaces of patchy colloids. Phys Rev E. 2015;91(1):012301. doi: 10.1103/PhysRevE.91.012301. [DOI] [PubMed] [Google Scholar]
- 8.Heras Ddl, Tavares JM, da Gama MMT. Phase diagrams of binary mixtures of patchy colloids with distinct numbers and types of patches: The empty fluid regime. J Chem Phys. 2011;134(10):104904. doi: 10.1063/1.3561396. [DOI] [PubMed] [Google Scholar]
- 9.Seiferling F, de las Heras D, Telo da Gama MM. Percolation in binary and ternary mixtures of patchy colloids. J Chem Phys. 2016;145(7):074903. doi: 10.1063/1.4960808. [DOI] [PubMed] [Google Scholar]
- 10.Bianchi E, Tartaglia P, Zaccarelli E, Sciortino F. Theoretical and numerical study of the phase diagram of patchy colloids: Ordered and disordered patch arrangements. J Chem Phys. 2008;128(14):144504. doi: 10.1063/1.2888997. [DOI] [PubMed] [Google Scholar]
- 11.de las Heras D, Tavares JM, Telo da Gama MM. Phase diagrams of binary mixtures of patchy colloids with distinct numbers of patches: The network fluid regime. Soft Matter. 2011;7:5615–5626. doi: 10.1063/1.3561396. [DOI] [PubMed] [Google Scholar]
- 12.Duguet E, Hubert C, Chomette C, Perro A, Ravaine S. Patchy colloidal particles for programmed self-assembly. C R Chim. 2016;19:173–182. [Google Scholar]
- 13.Gong Z, Theodore Hueckel G-RY, Sacanna S. Patchy particles made by colloidal fusion. Nature. 2017;550:234–238. doi: 10.1038/nature23901. [DOI] [PubMed] [Google Scholar]
- 14.Doppelbauer G, Bianchi E, Kahl G. Self-assembly scenarios of patchy colloidal particles in two dimensions. J Phys: Condens Matter. 2010;22(10):104105. doi: 10.1088/0953-8984/22/10/104105. [DOI] [PubMed] [Google Scholar]
- 15.Romano F, Sciortino F. Colloidal self-assembly: Patchy from the bottom up. Nat Mater. 2011;10:171. doi: 10.1038/nmat2975. [DOI] [PubMed] [Google Scholar]
- 16.Romano F, Sanz E, Sciortino F. Crystallization of tetrahedral patchy particles in silico. J Chem Phys. 2011;134(17):174502. doi: 10.1063/1.3578182. [DOI] [PubMed] [Google Scholar]
- 17.Bianchi E, Doppelbauer G, Filion L, Dijkstra M, Kahl G. Predicting patchy particle crystals: Variable box shape simulations and evolutionary algorithms. J Chem Phys. 2012;136(21):214102. doi: 10.1063/1.4722477. [DOI] [PubMed] [Google Scholar]
- 18.Wang Y, Wang Y, Breed DR, Manoharan VN, Feng L, Hollingsworth AD, Weck M, Pine DJ. Colloids with valence and specific directional bonding. Nature. 2012;491(7422):51. doi: 10.1038/nature11564. [DOI] [PubMed] [Google Scholar]
- 19.Coluzza I, van Oostrum D, Capone B, Reimhult E, Dellago C. Sequence controlled self-knotting colloidal patchy polymers. Phys Rev Lett. 2013;110(7):075501. doi: 10.1103/PhysRevLett.110.075501. [DOI] [PubMed] [Google Scholar]
- 20.McManus JJ, Charbonneau P, Zaccarelli E, Asherie N. The physics of protein self-assembly. Curr Opin Colloid Interface Sci. 2016;22:73–79. [Google Scholar]
- 21.Audus DJ, Starr FW, Douglas JF. Valence, loop formation and universality in self-assembling patchy particles. Soft Matter. 2018;14(9):1622–1630. doi: 10.1039/c7sm02419c. [DOI] [PMC free article] [PubMed] [Google Scholar]
- 22.Tavares JM, Dias C, Araújo N, Telo da Gama M. Dynamics of patchy particles in and out of equilibrium. J Phys Chem B. 2017;122(13):3514–3518. doi: 10.1021/acs.jpcb.7b10726. [DOI] [PubMed] [Google Scholar]
- 23.Rovigatti L, Russo J, Romano F. How to simulate patchy particles. Eur Phys J E. 2018;41(5):59. doi: 10.1140/epje/i2018-11667-x. [DOI] [PubMed] [Google Scholar]
- 24.Millan JA, Ortiz D, Glotzer SC. Effect of shape on the self-assembly of faceted patchy nanoplates with irregular shape into tiling patterns. Soft Matter. 2015;11(7):1386–1396. doi: 10.1039/c4sm01612b. [DOI] [PubMed] [Google Scholar]
- 25.Saika-Voivod I, Samllenburg F, Sciortino F. Understanding tetrahedral liquids through patchy colloids. J Chem Phys. 2013;139:234901. doi: 10.1063/1.4840695. [DOI] [PubMed] [Google Scholar]
- 26.De Michele C, Gabrielli S, Tartaglia P, Sciortino F. Dynamics in the presence of attractive patchy interactions. J Phys Chem B. 2006;110(15):8064–8079. doi: 10.1021/jp056380y. [DOI] [PubMed] [Google Scholar]
- 27.Bianchi E, Largo J, Tartaglia P, Zaccarelli E, Sciortino F. Phase diagram of patchy colloids: Towards empty liquids. Phys Rev Lett. 2006;97:168301. doi: 10.1103/PhysRevLett.97.168301. [DOI] [PubMed] [Google Scholar]
- 28.Wertheim MS. Fluids with highly directional attractive forces. IV. Equilibrium polymerization. J Stat Phys. 1986;42:477. [Google Scholar]
- 29.Wertheim MS. Fluids with highly directional attractive forces. III. Multiple attraction sites. J Stat Phys. 1986;42:459. [Google Scholar]
- 30.Wertheim MS. Fluids with highly directional attractive forces. II. Thermodynamic perturbation theory and integral equations. J Stat Phys. 1984;35:35. [Google Scholar]
- 31.Wertheim MS. Fluids with highly directional attractive forces. I. Statistical thermodynamics. J Stat Phys. 1984;35:19. [Google Scholar]
- 32.Chapman WG, Gubbins KE, Jackson G, Radosz M. Saft: Equation-of-state solution model for associating fluids. Fluid Phase Equilib. 1989;52:31. [Google Scholar]
- 33.Jover J, Haslam AJ, Galindo A, Jackson G, Muller EA. Pseudo hard-sphere potential for use in continuous molecular-dynamics simulation of spherical and chain molecules. J Chem Phys. 2012;137(14):144505. doi: 10.1063/1.4754275. [DOI] [PubMed] [Google Scholar]
- 34.Espinosa JR, Vega C, Sanz E. The mold integration method for the calculation of the crystal-fluid interfacial free energy from simulations. J Chem Phys. 2014;141(13):134709. doi: 10.1063/1.4896621. [DOI] [PubMed] [Google Scholar]
- 35.Espinosa JR, Sanz E, Valeriani C, Vega C. On fluid-solid direct coexistence simulations: The pseudo-hard sphere model. J Chem Phys. 2013;139(14):144502. doi: 10.1063/1.4823499. [DOI] [PubMed] [Google Scholar]
- 36.Ladd A, Woodcock L. Triple-point coexistence properties of the Lennard-Jones system. Chem Phys Lett. 1977;51(1):155–159. [Google Scholar]
- 37.Garcia-Fernandez R, Abascal JLF, Vega C. The melting point of ice ih for common water models calculated from direct coexistence of the solid-liquid interface. J Chem Phys. 2006;124(14):144506. doi: 10.1063/1.2183308. [DOI] [PubMed] [Google Scholar]
- 38.Wilding NB, Binder K. Finite-size scaling for near-critical continuum fluids at constant pressure. Physica A. 1996;231:439. [Google Scholar]
- 39.Plimpton S. J Comput Phys. 1995;117:1. [Google Scholar]
- 40.Hoover WG. Canonical dynamics: Equilibrium phase-space distributions. Phys Rev A. 1985;31:1695. doi: 10.1103/physreva.31.1695. [DOI] [PubMed] [Google Scholar]
- 41.Nosé S. A unified formulation of the constant temperature molecular dynamics methods. J Chem Phys. 1984;81:511. [Google Scholar]
- 42.Hoover WG. Constant-pressure equations of motion. Phys Rev A. 1986;34:2499–2500. doi: 10.1103/physreva.34.2499. [DOI] [PubMed] [Google Scholar]
- 43.Kamberaj H, Low RJ, Neal M. Time reversible and symplectic integrators for molecular dynamics simulations of rigid molecules. J Chem Phys. 2005;122(22):224114. doi: 10.1063/1.1906216. [DOI] [PubMed] [Google Scholar]
- 44.See http://www.collepardolab.org for files needed for running an example simulation of the M=4 p-p case of the MD-Patchy model in LAMMPS.
- 45.Tavares JM, Teixeira PIC, da Gama MT. Criticality of colloids with distinct interaction patches: The limits of linear chains, hyperbranched polymers, and dimers. Phys Rev E. 2009;80(2):021506. doi: 10.1103/PhysRevE.80.021506. [DOI] [PubMed] [Google Scholar]
- 46.Ciarella S, Gang O, Sciortino F. Toward the observation of a liquid-liquid phase transition in patchy origami tetrahedra: A numerical study. Eur Phys J E. 2016;39(12):131. doi: 10.1140/epje/i2016-16131-5. [DOI] [PubMed] [Google Scholar]
- 47.Dorsaz N, Filion L, Smallenburg F, Frenkel D. Spiers memorial lecture: Effect of interaction specificity on the phase behaviour of patchy particles. Faraday Discuss. 2012;159:9–21. [Google Scholar]
- 48.Tavares JM, Teixeira PIC. Phase diagrams of particles with dissimilar patches: X-junctions and Y-junctions. J Phys: Condens Matter. 2012;24:284108. doi: 10.1088/0953-8984/24/28/284108. [DOI] [PubMed] [Google Scholar]
- 49.Prausnitz JM, Lichtenthaler RN, de Azevedo EG. Molecular Thermodynamics of Fluid Phase Equilibria. Prentice-Hall; White Plains: 1999. [Google Scholar]
- 50.Teixeira PIC. Very low surface tension liquid–vapour interfaces of patchy colloids. Colloids Surf A. 2017;514:63–68. [Google Scholar]
- 51.De las Heras D, Da Gama MMT. Temperature (de) activated patchy colloidal particles. J Phys: Condens Matter. 2016;28(24):244008. doi: 10.1088/0953-8984/28/24/244008. [DOI] [PubMed] [Google Scholar]
- 52.Slovak J, Nezbeda I. On accuracy of Wertheim’s thermodynamic perturbation theory for primitive models of water. Mol Phys. 2003;101:789–798. [Google Scholar]
- 53.Vega C, Monson PA. Solid-fluid equilibrium for a molecular model with short ranged directional forces. J Chem Phys. 1998;109:9938. [Google Scholar]
- 54.Clark GNI, Haslam AJ, Galindo A, Jackson G. Developing optimal Wertheim-like models of water for use in statistical associating fluid theory (SAFT) and related approaches. Mol Phys. 2006;104(22–24):3561–3581. [Google Scholar]
- 55.Fusco D, Charbonneau P. Crystallization of asymmetric patchy models for globular proteins in solution. Phys Rev E. 2013;88(1):012721. doi: 10.1103/PhysRevE.88.012721. [DOI] [PubMed] [Google Scholar]
- 56.Fusco D, Charbonneau P. Soft matter perspective on protein crystal assembly. Colloids Surf B. 2016;137:22–31. doi: 10.1016/j.colsurfb.2015.07.023. [DOI] [PubMed] [Google Scholar]
- 57.Tavares JM, Almarza NG, Telo da Gama MM. Generalization of Wertheim’s theory for the assembly of various types of rings. Soft Matter. 2015;11:5828–5838. doi: 10.1039/c5sm00559k. [DOI] [PubMed] [Google Scholar]
- 58.Nezbeda I, Kolafa J, Kalyuzhnyi Y. Primitive model of water II. Theoretical results for the structure and thermodynamic properties. Mol Phys. 1989;68:143. [Google Scholar]
- 59.Romano F, Tartaglia P, Sciortino F. Gas–liquid phase coexistence in a tetrahedral patchy particle model. J Phys: Condens Matter. 2007;19(32):322101. [Google Scholar]
- 60.Doppelbauer G, Noya EG, Bianchi E, Kahl G. Competing ordered structures formed by particles with a regular tetrahedral patch decoration. J Phys: Condens Matter. 2012;24(28):284124. doi: 10.1088/0953-8984/24/28/284124. [DOI] [PubMed] [Google Scholar]
- 61.Noya EG, Vega C, Doye JPK, Louis AA. The stability of a crystal with diamond structure for patchy particles with tetrahedral symmetry. J Chem Phys. 2010;132:234511. doi: 10.1063/1.3454907. [DOI] [PubMed] [Google Scholar]
- 62.Doye JPK, Louis AA, Lin I-C, Allen LR, Noya EG, Wilber AW, Kok HC, Lyus R. Controlling crystallization and its absence: Proteins, colloids and patchy models. Phys Chem Chem Phys. 2007;9:2197–2205. doi: 10.1039/b614955c. [DOI] [PubMed] [Google Scholar]


