

Abstract
Vitamin C (ascorbic acid) and vitamin B3 (niacin) have been extensively studied since the 20th century. In the area of stem cell biology, vitamin C has shown its direct impact towards homeostasis and epigenetic changes.1 Vitamin B3 aids in maintaining healthy intestinal homeostasis and reducing gut inflammation by participating in the rapamycin signaling pathway.2 In this study, vitamin C and vitamin B3 (600 and 1200 μg/ml) have been explored as potential new biomaterials to study their effects on four types of intestinal stem cells which are isolated from mice bearing different microbiota. We observed that C3H ASF and 129 ASF IL-10 are more sensitive towards 600 μg/ml vitamin B3 and 1200 μg/ml vitamin C. The lowest growth rate and viability for all types of organoids was with 1200 μg/ml vitamin C. From qPCR analysis (quantitative Polymerase Chain Reaction analysis), MUC2 was upregulated for 129 ASF and C3H Conv when exposed to 600 μg/ml and 1200 μg/ml vitamin C. It suggests that large amounts of glycoprotein may be produced after adding high concentrations of vitamin C. Since inflammatory bowel disease has low level of MUC2, this finding may be helpful in restoring mucosal health by upregulating the MUC2 gene while altering patient’s microbiota.3 These results are expected to have a positive translational impact because this bottom-up strategy would be instrumental in developing Vitamin C and B3 based orally available therapeutic strategies and formula for advancing the fields of gastrointestinal regenerative medicine.
Keywords: Intestinal Stem cells, Organoids, Vitamin C, Vitamin B3, MUC2, PIK3CA
INTRODUCTION
Inflammatory bowel diseases (IBD) affect nearly 3.1 million adults in the United States as of 2015.4 IBD can range from having mild effects on people diagnosed with the disease, or they can drastically impact quality of life. Some ways in which this disease impacts the lives of people include abdominal pain and fatigue, chronic inflammation of the gut, as occurs in Crohn’s disease, as well as chronic ulceration and inflammation of the gut, as occurs in ulcerative colitis. The cause of these diseases is either genetic predisposition or by a disruption of the composition of the intestinal microbiota.5 By isolating intestinal stem cells, the intestine can be mimicked in order to obtain a better understanding of its microbiota, as well as of how IBD and other diseases of the gut can be cured or treated.
In 2009, Toshiro et al. first isolated intestinal stem cells that continuously grew into the so-called “organoids”, providing an innovative new three dimensional model to study intestine.6 A minigut, or organoid, is a self-renewable and self-assembling mini-organ that can keep differentiating and proliferating under a stabilized medium with determined growth factors or conditioned medium.7 Compared with different types of epithelium cell lines, organoids can mimic intestinal epithelium layer formation processes through various cell signaling pathways.8
Different from a monolayer, organoids can be considered as three dimensional systems that include different signaling pathways, different cell types, and different regions.9 There are two regions of organoid epithelium layers. The first region is called the villus-compartment, which contains enteroendocrine cells, enterocytes, and goblet cells. Second region is called the crypt-compartment, which includes the transient-amplifying (TA) region and the crypt base columnar (CBC) region, which includes Paneth cells and crypt base columnar cells.10 The way these cells interact with each other in the organoids is quite similar to the way they behave within the intestine. All of these cells have identical pathways, which are the (Wingless/Integrated) WNT/R-spondin signaling pathway that regulates cell proliferation and undifferentiated status and the BMP and Notch pathway that activates cell differentiation.11 Thus, the organoids have identical cell pathways and similar cell types when compared to the intestine epithelium itself. These advantages have been used to study various topics, such as modeling infectious diseases,12 applications to different drug delivery systems,13,14,15,16,17,18 how they serve as a new drug loading material,19 various studies on nanomaterial’s toxicity,20 modeling different virus infections,21,22 studying microbiota interactions23 and many more24,25,26,27.
By using this advanced model, we are able to take a look at the correlations between gut microbiota and vitamins C and B3. It is well-known that gut microbiota plays a very important role in regulating human health and controlling various diseases. For example, it has been shown that gut microbiota mediates the development of obesity-related metabolic disorders and insulin production. 28,29,30 Additionally, vitamins C and B3 impact Crohn’s disease, irritable bowel syndrome, and inflammatory bowel disease.31,32,33 Healthy microbiota can build healthy gut environments, which are beneficial in maintaining the intestinal immune system and for preventing inflammation.34 Recently, more and more studies have shown that there is bidirectional signaling between the development of the gut and the brain. Strong evidence has shown that gut microbiota plays a key role in modulating various signals through the gut-brain connection. For instance, Benakis et al. has shown that ischemic brain injury was reduced after alterations in the intestinal flora by regulating intestinal T cells. 35 Additionally, Erny et al. has shown that host microbiota constantly control the maturation and function of microglia in the central nervous system using germ-free mice and altered Schaedler flora (ASF, defined flora) mice.36
Vitamins play a key role in the human gut environment and in human health. Vitamin C (ascorbic acid) and vitamin B3 (Niacin) are water-soluble small molecules. Humans are unable to physiologically synthesize vitamin C in the body and therefore must introduce it through different sources of food. It is important that humans consume vitamin C due to its role in the functionality of healthy organs and tissues, as well as for tissue reparation and regeneration.37, 30 Vitamin C is absorbed from food by enterocytes through an ion channel. Vitamin B3, otherwise known as nicotinamide, nicotinic acid or niacin, is synthesized naturally in the body and is converted to NAD+. NAD+ is essential for many important processes in the body, one of which involves being reduced to NADH.38 Conversion of vitamin B3 to NAD+ takes place across the membranes of bacteria and mitochondria.39
Additionally, it has been shown that vitamin C supports stem cell survival and differentiation.40 There are two oxidoreductases located in the intestine that catalyze the transfer of electrons in order to recycle vitamin C for later use and that also enhance iron absorption. Vitamin C also affects the makeup and structure of extracellular matrix (ECM), which is an important influencer of stem cell behavior. ECM is involved in other signaling pathways that regulate cell proliferation and self-renewal. Vitamin B3 is an important precursor for coenzyme NAD+ and NADP synthesis. Studies have shown vitamin B3’s abilities in maintaining healthy intestinal hemostasis and reducing gut inflammation by participating in the rapamycin signaling pathway.41 Additionally, some studies have shown that vitamin B3 can be synthesized by large intestinal microbiota.42,43,44 It has also been shown that vitamin B3 is capable of alleviating severe intestinal colitis.45
Inspired by how the microbiota and vitamins C and B3 can influence intestinal development individually, we sought to explore vitamin C and B3 as new biomaterials to control stem cells fate for regenerative medicine. In particular, we were interested in seeing whether vitamins C and B3 have beneficial effects on different types of organoids. Thus, vitamin C and B3 (600 and 1200 μg/ml) were chosen to study their effects on four different types of organoids which were isolated from a C3H/HeN defined-flora mouse (C3H ASF), a C3H/HeN Conventional Raised mouse (C3H Conv), a 129S defined-flora mouse (129 ASF), and a 129S defined-flora IL-10 deficient (129 ASF IL-10) mouse. The C3H Conv and C3H ASF mice came from the same strain; however, the ASF mice only have eight specific bacterial species inside their GI tract, which are two Lactobacilli, one Bacteroides, one bacteria of the Flexistipes genus, and four Fusobacterium species.46 129 ASF and 129 ASF IL-10 mice both have the same types of microbiota species; however, the genetic backgrounds of these mice are different in that the IL-10 gene has been knocked out in the 129 ASF IL-10 mice. IL-10 gene is a key gene for regulating immune response during infections.47 It is also a gene that associated with other cytokines, such as TNF-∂ 48, IL-17, IL-2349, and IL-450. Thus, by editing IL-10, the whole IL-10 related pathway can be influenced, and it might cause significant phenotype changes.
The motivation of using those four types of mouse is to gain the understanding of how vitamin C and B3 responds to different microbiota, as well as the inflammatory gut environments. By comparing C3H ASF to C3H Conventional strains, since the only difference between them is the microbiota complexity, we can use those two types of mice to gain the understanding of how vitamins influenced organoids derived from different microbiota background. For comparing 129S ASF and 129S ASF IL-10 knock-out organoids, Interleukin 10 gene (IL-10) is anti-inflammatory related gene and served as a key immunoregulator during infections.47 By knocking out this gene, mouse has a strong tendency to develop gut colitis.51 Thus, by comparing 129S ASF IL-10 knock-out mice with 129S ASF, we can get some insights of how vitamin C and B3 reacts to an relatively inflamed gut environment by using organoids as a model. Thus, we can compare the influence of microbiota diversity (C3H CONV vs. C3H ASF), inflammation (129S ASF vs. 129S ASF IL-10 knock out), and different gene background (129S ASF vs. C3H ASF) by using organoids as an 3D gut model. Because of these differences among the four types of mice, this study can provide us a primary understanding of how various concentrations of vitamins influence intestinal health with complex gut, genetic, and strain backgrounds.
MATERIALS AND METHODS
Isolation of primary small intestinal crypts
Primary small intestinal crypts were isolated from C3H/HeN strain mice colonized with a known microbiota, the Altered Schaedler Flora (ASF), as described by Peng et al.13 All different types of mice were obtained from the gnotobiotic murine colony housed at the College of Veterinary Medicine, Iowa State University. All animal procedures were conducted with the approval of the Iowa State University Institutional Animal Care and Use Committee (IACUC). All methods and procedures in the experiments were performed in full compliance with the committee’s guidelines and regulations. Following humane euthanasia and with all the procedures have been proved by IACUC, the small intestine was excised and cut into pieces of 1 to 2 mm in length, and tissue specimens were washed four to five times using ice-cold PBS. Subsequently, crypts were dislodged from the intestinal tissue using 2 mM EDTA buffer and centrifuged at 100 g for 5 minutes at 4°C. Following re-suspension, the isolated crypt cells were implanted within Matrigel and added to a pre-heated 24-well plastic plate.
Preparation of intestinal stem cell culture solution
Advanced DMEM/F12 was purchased from Life Technologies, Carlsbad, CA, USA and Matrigel was purchased from Corning Inc., Corning, New York, U.S. Epidermal growth factor (EGF), noggin, and R-spondin-1 were purchased from PeproTech Inc. Rocky Hill, NJ, USA. Intestinal stem cell culture solution was prepared following the protocol provided by Peng et al.15 The culture medium was made by adding 2 mM GlutaMax, 10 mM HEPES, 100 μg/mL penicillin with 100 μg/mL streptomycin, N2 supplement (1×), B27 supplement (1×), 1 mM N-acetylcysteine, 500 μg/mL R-spondin-1, 100 ng/mL noggin, and 50 ng/mL EGF to an Advanced DMEM/F12 solution.
Vitamins C and B3 were purchased from Fisher Scientific, Pittsburgh, PA. In order to reach the required concentration, a 1000× stock solution was made for vitamins C and B3, which was diluted with culture solution for each experimental group. Organoids were isolated from 129 ASF IL-10, C3H Conv, C3H ASF, and 129 ASF mice. Different concentrations of vitamin C and B3 were added at day 1 of organoids’ culturing.
Quantification of organoids growth rate
Minigut growth was quantified at 5× magnification using bright-light microscopy with a bar scale. Thirty organoids were chosen randomly as representatives in each well and visualized using 5× magnification. Images taken at 5× magnification were used to measure surface area using ImageJ. First, the surface area growth rate for each minigut was calculated using the formula below:
# represents Day 1, 2, 3, 4, 5, 6, or 7.
Second, the surface area for each day was plotted linearly and the slopes were used for box plots. Statistical analysis, including two-way ANOVA test and Tukey test, was performed using JMP® statistical software.
Live/dead cell staining morphology
For live/dead cell viability staining, live/dead® reduced biohazard viability/cytotoxicity kit #1 (L-7013) was purchased from Thermo Fisher Scientific, Waltham, MA, USA. Culture medium was removed and 500 μL of HEPES-buffered saline solution (HBSS) was added in each well for washing. Components A and B from the kit (2 μL of each) were pipetted into 1 mL of HBSS. In each well, 300 μL of the solution was added and incubated in the dark for 30 min. Then, the dye solution was removed, and the wells were washed with fresh HBSS. Live/dead cells were observed and quantified under a fluorescence microscope.
Quantification of minigut viability via modified MTT method
The metabolic activities of organoids after eleven days incubation for each treatment group (600 μg/ml vitamin C, 1200 μg/ml vitamin C, 600 μg/ml vitamin B3, 1200 μg/ml vitamin B3 and control) were normalized by culturing with 10 mg/mL resazurin (Sigma-Aldrich, St. Louis, MO, USA) for 6 h at 37°C and 5% CO2. Fluorescence was recorded using 544 nm excitation/590 nm emission. Then, 5 mg/mL MTT (3-(4,5-dimethylthiazol-2-yl)-2,5-diphenyltetrazolium bromide) was added to the culture medium at a 1:10 dilution and incubated for 2 h in the same condition as before. After 2 h, the culture medium was removed and 200 μL of 2% sodium dodecyl sulfate (20% SDS, Sigma-Aldrich, St. Louis, MO, USA) was added and incubated for 2 h to solubilize the Matrigel. Then, 200 μL of dimethyl sulfoxide (DMSO, Sigma-Aldrich, St. Louis, MO, USA) was added to each well and incubated for 2.5 h. Absorbance was read at 570 nm on an optical plate reader. Then, absorbance at 570 nm for each well was normalized with the absorbance of resazurin using the formula below:
Quantitative PCR analysis
Matrigel was removed from organoids by treating with 1000 μl of Cell Recovery Solution (Corning Life Sciences) with shaking for 1 hour at 4°C followed by PBS washes. Total RNA was extracted by using a RNeasy Mini Kit (Qiagen, Valencia, CA) and the procedure was performed by following its manual. Concentrations and purifications of RNA was checked by NanoDrop® spectrophotometers. Primers were purchased from the DNA facility, Iowa State University, Ames, IA. Power SYBR™ Green RNA-to-CT™ 1-Step Kit was used. Later, gene expression differences were normalized by using housekeeping genes. 2−ΔΔCT values were calculated and analyzed. Primers are listed as Table 1.
Table 1.
Primers used for qPCR experiment.
| Gene | Forward | Reversed |
|---|---|---|
| PIK3CA | TCTGTCCTGGAACTCACTCT | GTTGGCACACGCCTTTAATC |
| CD44 | TGGTGGTGGTATATCTGTTGTC | GTACCTAGTGTACAATGGCTTCT |
| Ki67 | CCACACAGATGCCCTGTAAT | CTCTACTTTCCCACGTCTTGTC |
| NF-κB | CTGAAGAACCTCCTGACTTCTG | CATCTGCTGCTCCTACTCTATG |
| Ceacam 12 | ACAGCCTATGGTTGGCATATC | TCCTCTGACCCACAGATACTT |
| MUC2 | CTACCACCATTACCACCACTAC | GTCTCTCGATCACCACCATTT |
| IL-10 | CCCTTTGCTATGGTGTCCTTTC | AGGATCTCCCTGGTTTCTCTTC |
| Rpl13a | CACTCTGGAGGAGAAACGGAAGG | GCAGGCATGAGGCAAACAGTC |
RESULTS
Experimental design for comparing gut flora and genetic differences
For this study, as shown in Scheme 1, four types of mice were used. There were C3H/HeNRj Conventional Raised mice (C3H Conv), C3H/HeNRj Altered Schaedler Flora (C3H ASF) mice, 129S2/SvPasOrlRj Altered Schaedler Flora (129 ASF) mice, and 129S2/SvPasOrlRj Altered Schaedler Flora IL-10 knock out (129 ASF IL-10) mice. Intestinal stem cells were isolated from them and used for growing organoids. On the first day, 600 μg/ml or 1200 μg/ml of vitamin B3 or vitamin C were added to the cell culture solutions and the organoids were observed for seven days. For this study, there are five experimental groups (control: culture solution only; C600: vitamin C 600 μg/ml; B600: vitamin B3 600 μg/ml, C1200: vitamin C 1200 μg/ml, and B1200: vitamin B3 1200 μg/ml). There are also four different types of organoids used for each experimental group, which are C3H Conv, C3H ASF, 129 ASF, and 129 ASF IL-10. In total, there are 20 different ways to compare the data.
Scheme 1. Experimental design flowchart for testing effects of vitamin C and B3 on organoids.

Blue, red, black and green colored dots represent organoids isolated from different types of mice. Four different colored mice represent C3H/HeNRj Conventional Raised mice (Blue), C3H/HeNRj defined-flora mice (Red), 129S2/SvPasOrlRj Altered Schaedler Flora mice (Black), and 129S2/SvPasOrlRj Altered Schaedler Flora IL-10 knock out mice (Green).
Organoids growth rate comparisons
In order to analyze how different concentrations of vitamins C and B3 influenced organoids, growth rates of the organoids were plotted, as shown in Figure 1 and Figure 2. In Figure 1, comparisons were made between the same mouse strain and different vitamin concentrations. Vitamin B3 600 and 1200 μg/ml and vitamin C 600 and 1200 μg/ml were also compared with the control for the same types of organoids individually. Figure 1a shows the growth rate of 129 ASF under different concentrations of vitamins. The results, when compared with its control group, showed that the growth rate for the 129 ASF organoids after adding vitamin C 1200 μg/ml is significantly decreased. As shown in Figure 1b, after adding Vitamin C 1200 μg/ml, the growth rate for 129 ASF IL-10 was also significantly decreased. Despite the decreasing growth rates for C1200 groups, there is a slight increase in the growth rates for vitamin B3 600 μg/ml that is significant for the 129 ASF IL-10 organoids. In Figures 1c and 1d, both C1200 group show a significant decreased growth rate. However, as shown in Figure 1d, B600 has increased growth rates when compared with the control for C3H ASF organoids. From this figure, we are able to conclude that the addition of 1200 μg/ml of vitamin C decreased growth rates for all types of organoids and that the 600 μg/ml of vitamin B3 increased growth rates. In Figure 2, the growth rate data from Figure 1 was replotted to compare different organoids cultured with the same vitamin condition. For Figure 2a, b and c, which we compared the growth rate for conditions under 600 μg/ml of Vitamin C and 1200 μg/ml of Vitamin B3, however, there is no significant growth rate differences according to p-values.
Figure 1. Organoids growth rate comparison under same organoids type.
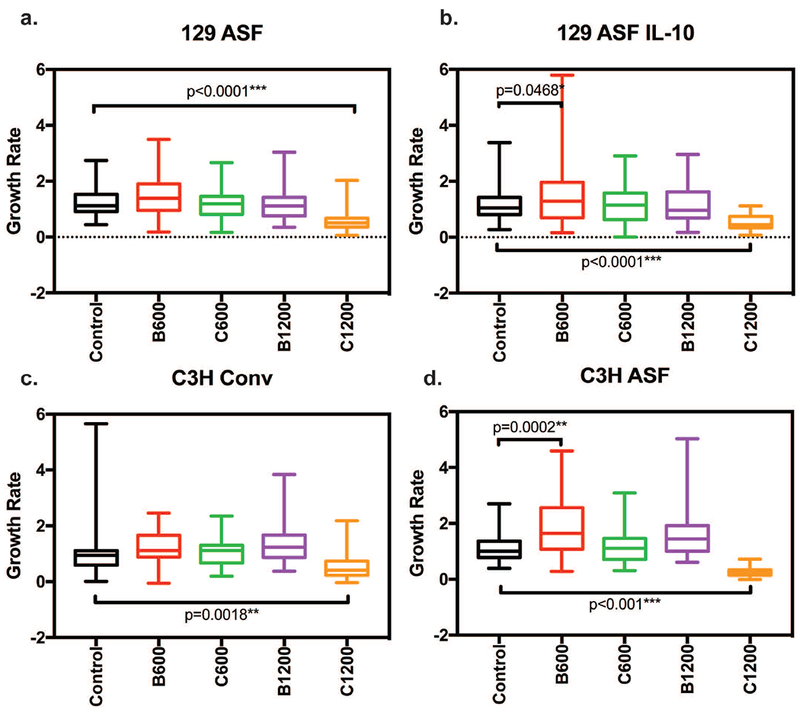
Thirty random organoids were tracked every day using 5× magnification and the surface area for each organoid was plotted linearly. Slopes from each linear regression were recorded and used. Five number summaries (Maximum, Minimum, Medium, 1st quartiles and 3rd quartiles) are shown in this plot for each experimental group. Two-way ANOVA and Tukey tests were used to calculate significances with a null hypothesis H0: Under the same type of organoids (C3H Conv, C3H ASF, 129S ASF, or 129S ASF IL-10), there is no growth rate differences between control and the other experimental groups (C600, B600, C1200 or B1200). Alpha value set at 0.05. * p-value <0.05; ** p-value <0.01; *** p-value <0.001. a) 129S ASF, b) 129 ASF IL-10, c) C3H Conv, and d) C3H ASF.
Figure 2. Organoids growth rate comparison under each same concentration groups.
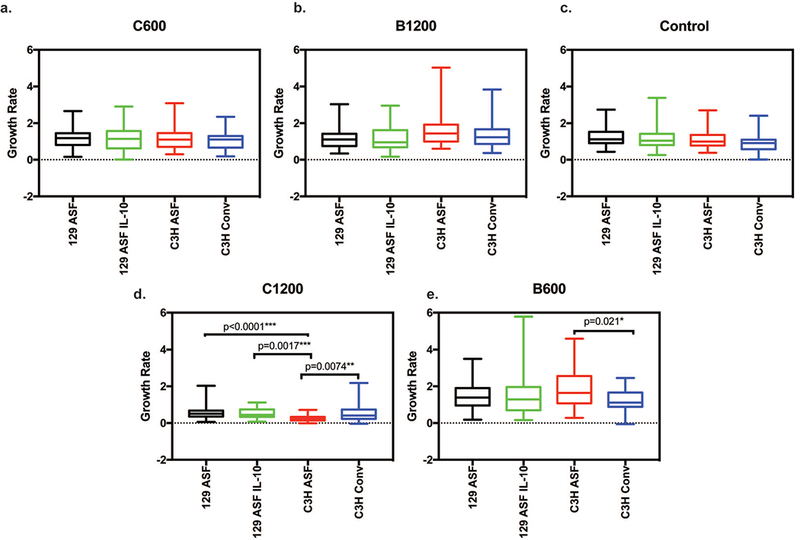
Thirty random organoids were tracked every day using 5× magnification and the surface area for each organoid was plotted linearly. Slope from each linear regression was recorded and used. Five number summaries (Maximum, Minimum, Medium, 1st quartiles and 3rd quartiles) are shown in this plot for each experimental group. Two-way ANOVA and Tukey tests were used to calculate significances with a null hypothesis H0: Under the same concentrations (C600, B600, C1200 or B1200), there is no growth rate differences between each organoid type (C3H Conv, C3H ASF, 129S ASF, or 129S ASF IL-10). Alpha value set at 0.05. * p-value <0.05; ** p-value <0.01; *** p-value <0.001. a) Vitamin C 600 μg/ml, b) Vitamin B3 1200 μg/ml, c) Control (no vitamin B3 or C added), d) Vitamin C 1200 μg/ml, and e) Vitamin B3 600 μg/ml.
Live/dead cell fluorescence image morphology and quantification
In addition to the growth rate comparisons among the organoids, a live/dead fluorescence end point test was performed on the last day of the experiment. Organoids were randomly selected and stained where green indicates live cells and red color indicates dead cells within each organoid. All images were taken under the same exposure time and 10 × magnification. Using the live/dead imaging from Figure 3, the live/dead fluorescence ratio was calculated and quantified for comparison (Figures 4a and 4b). Higher fluorescence ratios correspond to higher levels of live cells. After an ANOVA test and Tukey test, the majority of the ratios did not show any significant difference.
Figure 3. Live/dead cell fluorescence image morphologies at day 7.
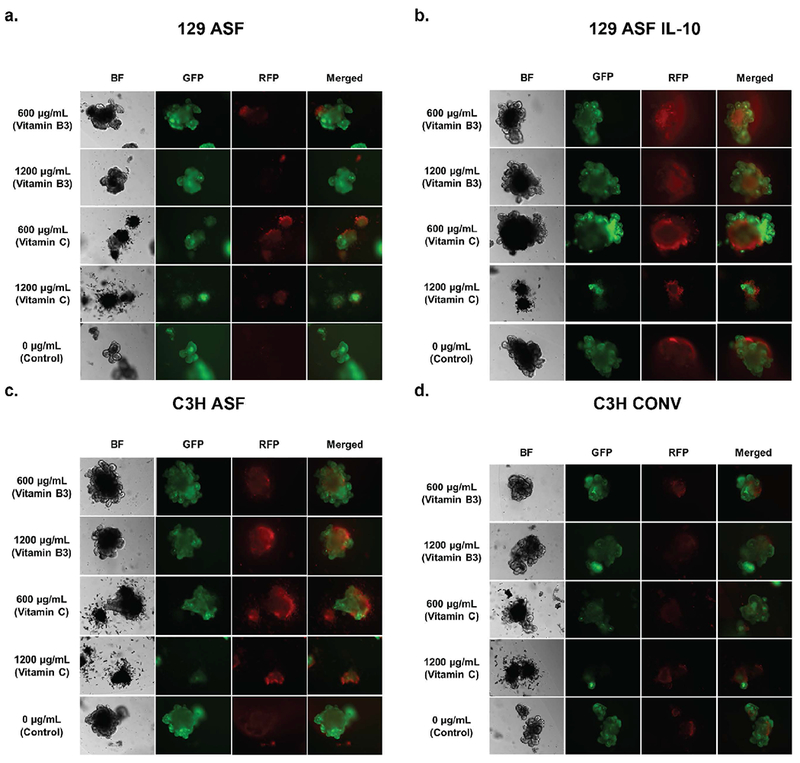
The 1st column are images taken under bright-field (BF). The second column represents images of green fluorescent protein (GFP), where green indicates live cells. The third column represents images of red fluorescent protein (RFP), where red indicates dead cells. Images were taken at 10× magnifications. All of the images are grouped based on different types of organoids. a. represents 129S ASF organoids, b. represents 129S ASF IL-10 knock-out organoids group, c. represents C3H ASF organoids, and d. represents C3H Conventional Raised organoids.
Figure 4. Live/dead cell fluorescence quantitative ratio at day 7.
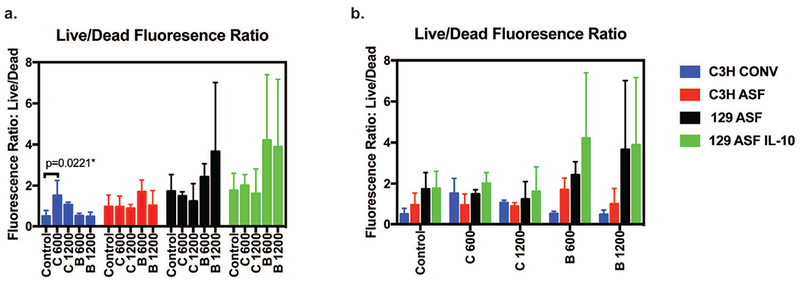
Fluorescence intensity from Live/Dead images were analyzed and the fluorescence intensity was measured. The y-axis is the ratio of the Live cell intensity divided by dead cell intensity. The higher the number, the more viable the cells are. The same data was used for plotting figure 4a and 4b in order to do different comparisons: under the same treatment groups or under the same type of organoids. A significance when comparing C3H Conv Control and Vitamin C 600 μg/ml groups was detected after an ANOVA test and Tukey test.
Quantitative viability test for organoids
In order to have a better understanding of cell viability, a colorimetric (3-(4,5-Dimethylthiazol-2-yl)-2,5-diphenyltetrazolium bromide) MTT assay was performed as an end point test. MTT results for each type of organoid were plotted as Figures 5a and 5b. Figure 5c summarizes the p values calculated from the Tukey statistical test from Figure 5a.
Figure 5. Quantitative viability test results.
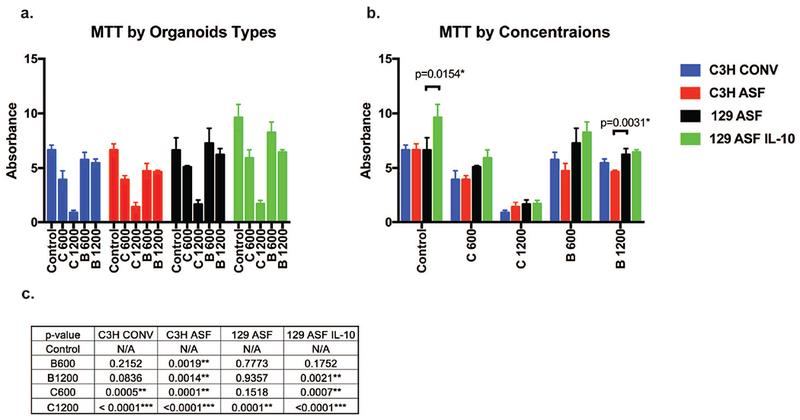
MTT assay was performed at day 7 of organoid growth. The same data was plotted differently for figure 5a and 5b in order to compare between the different groups. For 5a, organoids were compared under the same organoid type. For 5b, organoids were compared under the same concentration. For 5c, the p values for figure 5a are shown.
Gene expression analysis using qPCR
In Figure 6 gene expression levels were compared for different vitamin concentrations with the same type of organoids. For C3H Conv organoids, C3H Conv C600, C1200, B600 and B1200 are compared with C3H Conv control. For C3H ASF organoids, C3H ASF C600, C1200, B600 and B1200 are compared with C3H ASF control. For 129 ASF organoids, 129 ASF C600, C1200, B600 and B1200 are compared with 129 ASF control. For 129 ASF IL-10 organoids, 129 ASF IL-10 C600, C1200, B600 and B1200 are compared with 129 ASF IL-10 control group. For these images, red indicates higher gene expression compared to the control group (0 μg/ml vitamins) and green indicates inhibition of gene expression compared to control. Black indicates no difference between the control group and the other group. In Figure 7 quantitative PCR results were replotted and organized based on cell types.
Figure 6. Gene expression analysis.
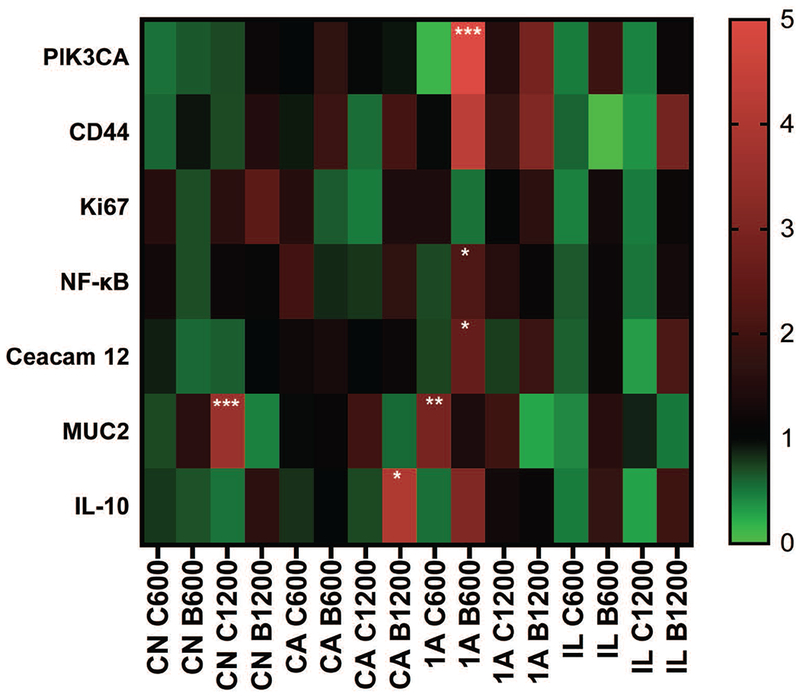
Comparisons were made between the experimental controls and other concentration groups (C600, C1200, B 600, and B 1200). CN: C3H Conventional Raised, CA: C3H ASF, 1A: 129 ASF, IL: 129 ASF IL-10. C600: Vitamin C 600 μg/ml, C1200: Vitamin C 1200 μg/ml, B600: Vitamin B3 600 μg/ml, B1200: Vitamin B3 1200 μg/ml. The heat map color represents averages of 2−ΔΔCT values. P-values were calculated based on an ANOVA test and Tukey tests with ∂ = 0.05. * p-value <0.05; ** p-value <0.01; *** p-value <0.001.
Figure 7. Gene expression analysis.
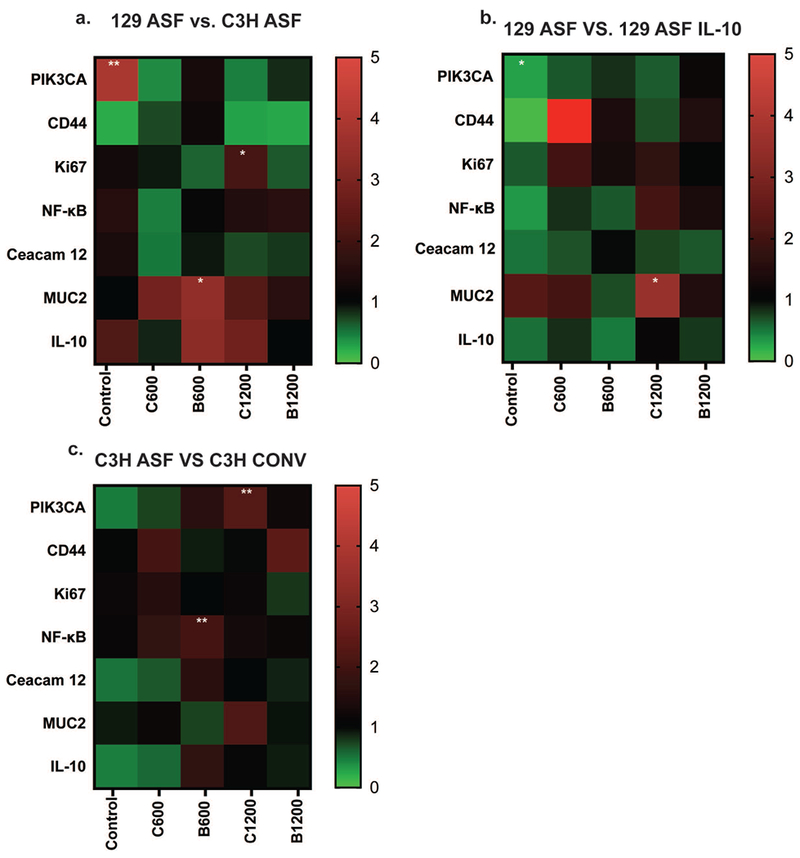
7a) Under the same experimental group (Control: No Vitamin Addition, C600, C1200, B 600, or B 1200), comparing 129 ASF gene expression with C3H ASF. 7b) Under same experimental group (Control: No Vitamin Addition, C600, C1200, B 600, or B 1200), comparing 129 ASF gene expression with 129 ASF IL-10. 7c) Under same experimental group (Control: No Vitamin Addition, C600, C1200, B 600, or B 1200), comparing C3H ASF gene expression with C3H Conv. C600: Vitamin C 600 μg/ml, C1200: Vitamin C 1200 μg/ml, B600: Vitamin B3 600 μg/ml, B1200: Vitamin B3 1200 μg/ml. The heat map color represents averages of 2−ΔΔCT values. P-values were calculated based on ANOVA test and Tukey tests with ∂ = 0.05. * p-value <0.05; ** p-value <0.01; *** p-value <0.001.
DISCUSSIONS
Among the 20 ways of comparison, there are a couple of major comparisons that of particular interest. These can be categorized into two different, major comparison groups. We will compare the influence of vitamins on each type of organoid individually, and we will also compare the influence of organoid type on each vitamin concentration. For example, we want to know how vitamin C at a concentration of 600 μg/ml influenced the 129 ASF organoids. We are also able to make a comparison between how 129 ASF and 129 ASF IL-10 differed at a concentration of 600 μg/ml for vitamin C. With these two different comparisons, we can use the collected data extensively. By comparing C3H Conv and C3H ASF under the same experimental group (control, C600, C1200, B600, and B1200), we can gain some insights on how the microbiota influenced the organoids.
By comparing C3H ASF with 129 ASF under the same experimental group (control, C600, C1200, B600, and B1200), we can obtain insight on the role that strain differences play when vitamins are added to the medium. By comparing 129 ASF with 129 ASF IL-10, we were able obtain insight on how the IL-10 knock out gene influenced organoids under same amounts of vitamin concentrations. Along with those three comparisons, we were also able to make comparisons within the same type of organoids on how different concentrations of vitamins changed the cells by comparing them (C600, B600, C1200, B1200) with the control (0 μg/ml of vitamins).
In regard to Figure 2, we are particularly interested in how the different types organoids are stressed under the same amount of vitamin concentrations. By using ANOVA and Tukey tests, there are two concentrations that show significant differences among the different types of organoids. These significant differences are shown in Figures 2d and 2e. In Figure 2d, vitamin C 1200 μg/ml was plotted for the four organoid types. C3H ASF has a lower growth rate compared to C3H Conv (p = 0.0074). C3H ASF also has a lower growth rate than 129 ASF. There is no statistical significance between 129 ASF IL-10 and 129 ASF under 1200 μg/ml of vitamin C. In Figure 2e, vitamin B3 600 μg/ml was plotted for each organoid. For this concentration, C3H CONV has a lower growth rate than C3H ASF. It is interesting to see that C3H ASF organoids are more sensitive to vitamin supplementation compared to the other types of organoids.
From Figure 3, 129 ASF IL-10 and C3H ASF organoids have more dead cells compared to the 129 ASF and C3H Conv organoids. Additionally, the green color is more intense for 129 ASF IL-10 and 129 ASF compared to C3H ASF and C3H Conv. From the bright field images, it is noticeable that 1200 μg/ml vitamin C disrupted the crypt structures and the integrity of the organoids. Furthermore, after adding 600 μg/ml of vitamin B3 to each type of organoid, there appeared to be an increased number of crypts compared to control. For C3H Conv, 1200 μg/ml and 600 μg/ml of vitamin B3 appeared to be healthier than control due to the organoid’s larger size and increased number of crypts.
One exception can be seen in comparing C600 and control of the C3H organoids, in which the C600 organoid had a higher fluorescence ratio than control. In Figure 4b each organoid type was compared with identical vitamin supplementation. Although there is no statistical significance difference, C3H ASF and C3H Conv have lower ratios compared to 129 ASF and 129ASF IL-10.
In Figures 5a and 5c vitamin concentrations were compared with control groups for each type of organoid individually. The results are consistent with the growth rates (Figures 1 and 2) with significant decreases in cell viability for 1200 μg/ml vitamin C. Additionally, 600 μg/ml of vitamin C also decreased cell viability for C3H Conv, C3H ASF, and 129 ASF IL-10 organoids. Additionally, for Vitamin B3 600 μg/ml, there is a slight decrease in cell viability for C3H ASF. In Figure 5b, MTT results were plotted based on vitamin concentration. Interestingly, the 129 ASF IL-10 control organoids are more viable compared with the other controls. Additionally, there was is a slight decrease in viability for the B1200 group for C3H ASF organoids compared to the other organoid types.
In order to understand the reason behind why the growth rates and cell viabilities differed across animal strains and vitamin concentrations, seven genes that influence cell proliferation were selected (PIK3CA, CD44, Ki67, NF-kB, Ceacam 12, MUC2, and IL-10). The PIK3CA gene is responsible for controlling cell signaling, including the production of new cells, cell growth, and proliferation.52 The CD44 protein is a cell-surface glycoprotein that is related to cell-cell interaction and lymphocyte activity.53 Ki67 contributes to controlling cell proliferation and the cell cycle.54 NF-kB, which is nuclear factor kappa light enhancer of activated B cells, is a complex of proteins that controls DNA transcription, cytokine production, and cell survival fate.55 Ceacam 12 is a member of the CEACAM gene family, which is a family of a Carcinoembryonic antigen-related cell adhesion molecules. This gene is related to tumor progression and metastasis. It is mostly found in the epithelium layer.56 MUC2 (Mucin 2) is related to goblet cells in the intestinal epithelium, which play a key role in protecting the epithelium layer.57 IL-10 (Interleukin 10) is a gene related to inflammation. With IL-10 and its potent anti-inflammatory properties, it has served as a key role in maintaining immune responses towards pathogens, and host inflammatory responses.58 As shown in Figures 6 and 7, quantitative PCR was performed and analyzed.
MUC2 was upregulated in vitamin C groups and downregulated in Vitamin B3 groups (Figure 6). MUC2 is secreted by goblet cells in the gut epithelial barrier and is a major secreted intestinal mucin. We know from Figures 1, 2 and 3 that high concentrations of vitamin C, 1200 μg/ml especially, disrupted the cell structure and results in lower growth rate and cell viability. However, MUC2 is also significantly upregulated for C3H Conv C1200 and 129 ASF C600 groups. Thus, upregulated signaling of MUC2 could be due to goblet cells in organoids somehow sensing the disruption, and are preparing for reparation and protection of the epithelial cells.59 From Parlato et al.59 a signal transduction pathway involving MUC2 and NF-kB for intestinal epithelial tissue repair has been mentioned. After the disruption of the intestinal epithelial layer, goblet cells will start secreting MUC2 and then TFF3 will be released and detected by enterocytes. After, NF-kB, p38, and ERK will be activated for cell differentiation and restitution. However, based on Figure 6, NF-kB gene expression for most experimental groups was downregulated or had no differences compared with control. This indicated that, although MUC2 might be secreted, cell reparation had failed. This could due to TFF3 release being unsuccessful.
PIK3CA mutation has been associated with endometrial, breast, and colorectal cancers.60 Upregulation of PIK3CA can induce cell amplification and proliferation.61 PIK3CA is highly expressed in organoids from the 129 ASF mouse strain compared with the C3H ASF strain (Figure 7a). Although most of the genes are downregulated and are not statistically different, PIK3CA expression in 129 ASF B600 is upregulated compared with control (p < 0.0001). Additionally, the majority of vitamin B groups are upregulated, and vitamin C groups are downregulated for PIK3CA.
Additionally, most of the 129 ASF groups are upregulated for MUC2 and IL-10 expression compared with C3H ASF. This strain difference can give us some insights regarding which one to choose for different studies. For instance, 129 ASF is more sensitive to cell disruptions and would be a better model for inflammatory bowel disease. Figure 7b compares 129 ASF and 129 ASF IL-10. We were anticipating upregulation of IL-10 expression in 129 ASF compared with 129 ASF IL-10 since the IL-10 gene was knocked out in the 129 ASF IL-10 strain. However, there was no statistically significant difference between these groups. All experimental groups resulted in downregulation of IL-10. IL-10 is known to be produced by macrophages, dendritic cells, B cells, and various T cells.47 The reason for this downregulation could due to the fact that organoids lack those immune-related cell types and that they only have epithelium. It could also due to the organoids having lost their ability for regulating the IL-10 gene during cell culturing. Figure 7c shows that most of the gene expressions are neutral, with the exception that NF-kB for the C3H ASF B600 group is slightly upregulated. Additionally, PIK3CA for C1200 is also upregulated for C3H ASF compared to C3H Conv.
CONCLUSION
Based on our cell viability, live/dead staining, live/dead fluorescence ratios, and cell growth rate results, we suggest that C3H ASF organoids are more sensitive to vitamins B3 and C compared to the other organoids studied here. Higher concentrations of vitamin C tended to cause reduction in cell sizes, decreasing in growth rates but upregulation for MUC2. Adding 600 μg/ml of vitamin B3 to the organoids lead to higher growth rates, an increase in the number of crypts, and viable organoids compared with control groups. From the qPCR analysis, MUC2 and PIK3CA gene expression had the most significant regulation, where 1200 μg/ml vitamin C tended to result in an upregulation of MUC2, and 600 μg/ml B600 tended to cause a downregulation of PIK3CA. Differences in gene expression levels were also influenced by mouse strain. When comparing 129 ASF with C3H ASF, MUC2 and IL-10 genes tended to be upregulated. MUC2 was downregulated for 129 ASF organoids compared to the 129 ASF IL-10 organoids.
Here, we provide some insights connecting vitamins with different microbiota environment, different strain backgrounds, and different genetic backgrounds. It is interesting to see that strain differences are affected differently for the same concentrations of vitamins. With this comparison, a concentration dependent vitamin C or B3 dose might be applied in vivo to intestinal diseases. These results are expected to have a positive translational impact because this bottom-up strategy would be instrumental in developing Vitamin C and B3 based orally available therapeutic strategies and formula for advancing the fields of gastrointestinal regenerative medicine.
ACKNOWLEDGMENTS
Dr. Wang is grateful for the support from Crohn’s & Colitis Foundation of America (CCFA) Career Award (No. 348137), PhRMA Foundation Research Starter Award (No. RSGTMT17), and McGee-Wagner Interdisciplinary Research Foundation. The research was also supported (TAB) by NIH (2RO1 DK095662) and VA Merit (1I01CX001353) grants.
REFERENCES
- 1.D’Aniello C, Cermola F, Patriarca EJ, et al. (2017) Vitamin C in Stem Cell Biology: Impact on Extracellular Matrix Homeostasis and Epigenetics. Stem Cells International 2017; 2017. [DOI] [PMC free article] [PubMed] [Google Scholar]
- 2.Kumar JS, Subramanian VS, Kapadia R, et al. Mammalian colonocytes possess a carrier-mediated mechanism for uptake of vitamin B3 (niacin): studies utilizing human and mouse colonic preparations. AJP: Gastrointestinal and Liver Physiology 2013. [DOI] [PMC free article] [PubMed] [Google Scholar]
- 3.Sibila O, Garcia-Bellmunt L, Giner J, et al. Airway Mucin 2 is decreased in patients with severe chronic obstructive pulmonary disease with bacterial colonization. Annals of the American Thoracic Society 2016. [DOI] [PMC free article] [PubMed] [Google Scholar]
- 4.Dahlhamer JM, Zammitti EP, Ward BW, et al. Prevalence of Inflammatory Bowel Disease Among Adults Aged ≥18 Years — United States, 2015. MMWR. Morbidity and Mortality Weekly Report 2016; 65:1166–1169. [DOI] [PubMed] [Google Scholar]
- 5.Guinane CM, Cotter PD. Role of the gut microbiota in health and chronic gastrointestinal disease: Understanding a hidden metabolic organ. Therapeutic Advances in Gastroenterology 2013. [DOI] [PMC free article] [PubMed] [Google Scholar]
- 6.Sato T, Vries RG, Snippert HJ, et al. Single Lgr5 stem cells build crypt-villus structures in vitro without a mesenchymal niche. Nature 2009; 459:262–5. [DOI] [PubMed] [Google Scholar]
- 7.Leushacke M, Barker N. Ex vivo culture of the intestinal epithelium: strategies and applications. Gut 2014; 63:1345–1354. [DOI] [PubMed] [Google Scholar]
- 8.Yin X, Mead BE, Safaee H, et al. Engineering Stem Cell Organoids. Cell Stem Cell 2016; 18:25–38. [DOI] [PMC free article] [PubMed] [Google Scholar]
- 9.Edmondson R, Broglie JJ, Adcock AF, et al. Three-Dimensional Cell Culture Systems and Their Applications in Drug Discovery and Cell-Based Biosensors. ASSAY and Drug Development Technologies 2014. [DOI] [PMC free article] [PubMed] [Google Scholar]
- 10.Leushacke M, Barker N. Ex vivo culture of the intestinal epithelium: strategies and applications. Gut 2014; 63:1345–54. [DOI] [PubMed] [Google Scholar]
- 11.Date S, Sato T. Mini-Gut Organoids: Reconstitution of the Stem Cell Niche. Annual Review of Cell and Developmental Biology 2015; 31:269–289. [DOI] [PubMed] [Google Scholar]
- 12.Liu F, Huang J, Ning B, et al. (2016) Drug discovery via human-derived stem cell organoids. Frontiers in Pharmacology 2016. [DOI] [PMC free article] [PubMed] [Google Scholar]
- 13.Peng H, Wang C, Xu X, et al. An intestinal Trojan horse for gene delivery. Nanoscale 2015; 7:4354–4360. [DOI] [PubMed] [Google Scholar]
- 14.Wang Q, Cheng H, Peng H, et al. (2015) Non-genetic engineering of cells for drug delivery and cell-based therapy. Advanced Drug Delivery Reviews 2015; 91:125–140. [DOI] [PubMed] [Google Scholar]
- 15.Zhao Y, Wang Z, Zhang Q, et al. Accelerated skin wound healing by soy protein isolate–modified hydroxypropyl chitosan composite films. International Journal of Biological Macromolecules 2018. [DOI] [PubMed] [Google Scholar]
- 16.Cheng G, Ma X, Li J, et al. Incorporating platelet-rich plasma into coaxial electrospun nanofibers for bone tissue engineering. International Journal of Pharmaceutics 2018. [DOI] [PubMed] [Google Scholar]
- 17.Wu G, Deng H, Jiang T, et al. Regulating the gaps between folds on the surface of silk fibroin membranes via LBL deposition for improving their biomedical properties. Colloids and Surfaces B: Biointerfaces 2017. [DOI] [PubMed] [Google Scholar]
- 18.Tu H, Yu Y, Chen J, et al. Highly cost-effective and high-strength hydrogels as dye adsorbents from natural polymers chitosan and cellulose. Polymer Chemistry 2017. [Google Scholar]
- 19.Davoudi Z, Peroutka-Bigus N, Bellaire B, et al. Intestinal organoids containing poly(lactic- co -glycolic acid) nanoparticles for the treatment of inflammatory bowel diseases. Journal of Biomedical Materials Research Part A 2018; 106:876–886. [DOI] [PMC free article] [PubMed] [Google Scholar]
- 20.Qi Y, Shi E, Peroutka-Bigus N, et al. Ex vivo study of telluride nanowires in minigut. Journal of Biomedical Nanotechnology 2018; 14:978–986. [DOI] [PubMed] [Google Scholar]
- 21.Garcez PP, Loiola EC, Da Costa RM, et al. Zika virus: Zika virus impairs growth in human neurospheres and brain organoids. Science 2016. [DOI] [PubMed] [Google Scholar]
- 22.Yin Y, Bijvelds M, Dang W, et al. Modeling rotavirus infection and antiviral therapy using primary intestinal organoids. Antiviral Research 2015; 123:120–131. [DOI] [PubMed] [Google Scholar]
- 23.Lukovac S, Belzer C, Pellis L, et al. Differential modulation by Akkermansia muciniphila and faecalibacterium prausnitzii of host peripheral lipid metabolism and histone acetylation in mouse gut organoids. mBio 2014. [DOI] [PMC free article] [PubMed] [Google Scholar]
- 24.Chiu A, Song W, Flanders JA, et al. Designing a retrievable and scalable cell encapsulation device for potential treatment of type 1 diabetes. Proceedings of the National Academy of Sciences 2017. [DOI] [PMC free article] [PubMed] [Google Scholar]
- 25.Lu Y-C, Fu D-J, An D, et al. Scalable Production and Cryostorage of Organoids Using Core-Shell Decoupled Hydrogel Capsules. Advanced Biosystems 2017. [DOI] [PMC free article] [PubMed] [Google Scholar]
- 26.Zhang Y, An D, Pardo Y, et al. High-water-content and resilient PEG-containing hydrogels with low fibrotic response. Acta Biomaterialia 2017. [DOI] [PubMed] [Google Scholar]
- 27.Song W, Tung CK, Lu YC, et al. Dynamic self-organization of microwell-aggregated cellular mixtures. Soft Matter 2016. [DOI] [PubMed] [Google Scholar]
- 28.Zhang X, Zhao Y, Xu J, et al. Modulation of gut microbiota by berberine and metformin during the treatment of high-fat diet-induced obesity in rats. Scientific Reports 2015. [DOI] [PMC free article] [PubMed] [Google Scholar]
- 29.Everard A, Belzer C, Geurts L, et al. Cross-talk between Akkermansia muciniphila and intestinal epithelium controls diet-induced obesity. Proceedings of the National Academy of Sciences 2013. [DOI] [PMC free article] [PubMed] [Google Scholar]
- 30.Shin NR, Lee JC, Lee HY, et al. An increase in the Akkermansia spp. population induced by metformin treatment improves glucose homeostasis in diet-induced obese mice. Gut 2014. [DOI] [PubMed] [Google Scholar]
- 31.Orel R, Trop TK. (2014) Intestinal microbiota, probiotics and prebiotics in inflammatory bowel disease. World Journal of Gastroenterology 2014; 20:11505–11524. [DOI] [PMC free article] [PubMed] [Google Scholar]
- 32.Marchesi JR, Adams DH, Fava F, et al. The gut microbiota and host health: a new clinical frontier. Gut 2016; 65:330–339. [DOI] [PMC free article] [PubMed] [Google Scholar]
- 33.Øyri SF, Muzes G, Sipos F. (2015) Dysbiotic gut microbiome: A key element of Crohn’s disease. Comparative Immunology, Microbiology and Infectious Diseases 2015. [DOI] [PubMed] [Google Scholar]
- 34.Thursby E, Juge N. Introduction to the human gut microbiota. Biochemical Journal 2017; 474:1823–1836. [DOI] [PMC free article] [PubMed] [Google Scholar]
- 35.Benakis C, Brea D, Caballero S, et al. Commensal microbiota affects ischemic stroke outcome by regulating intestinal γδ T cells. Nature Medicine 2016. [DOI] [PMC free article] [PubMed] [Google Scholar]
- 36.Erny D, De Angelis ALH, Jaitin D, et al. Host microbiota constantly control maturation and function of microglia in the CNS. Nature Neuroscience 2015. [DOI] [PMC free article] [PubMed] [Google Scholar]
- 37.Chambial S, Dwivedi S, Shukla KK, et al. (2013) Vitamin C in disease prevention and cure: An overview. Indian Journal of Clinical Biochemistry 2013. [DOI] [PMC free article] [PubMed] [Google Scholar]
- 38.Chiarugi A, Dolle C, Felici R, et al. The NAD metabolome--a key determinant of cancer cell biology. Nature Reviews. Cancer 2012. [DOI] [PubMed] [Google Scholar]
- 39.Huxley L, Quirk PG, Cotton NPJ, et al. The specificity of proton-translocating transhydrogenase for nicotinamide nucleotides. Biochimica et Biophysica Acta - Bioenergetics 2011. [DOI] [PubMed] [Google Scholar]
- 40.D’Aniello C, Cermola F, Patriarca EJ, et al. Vitamin C in Stem Cell Biology: Impact on Extracellular Matrix Homeostasis and Epigenetics. Stem Cells International 2017; 2017. [DOI] [PMC free article] [PubMed] [Google Scholar]
- 41.Smith PM, Howitt MR, Panikov N, et al. The Microbial Metabolites, Short-Chain Fatty Acids, Regulate Colonic Treg Cell Homeostasis. Science 2013. [DOI] [PMC free article] [PubMed] [Google Scholar]
- 42.Rowland I, Gibson G, Heinken A, et al. (2018) Gut microbiota functions: metabolism of nutrients and other food components. European Journal of Nutrition 2018. [DOI] [PMC free article] [PubMed] [Google Scholar]
- 43.Laparra JM, Sanz Y. (2010) Interactions of gut microbiota with functional food components and nutraceuticals. Pharmacological Research 2010. [DOI] [PubMed] [Google Scholar]
- 44.Delzenne NM, Neyrinck AM, Cani PD. Modulation of the gut microbiota by nutrients with prebiotic properties: Consequences for host health in the context of obesity and metabolic syndrome. Microbial Cell Factories 2011. [DOI] [PMC free article] [PubMed] [Google Scholar]
- 45.Bishop W M, Zubeck H M. Evaluation of Microalgae for use as Nutraceuticals and Nutritional Supplements. Journal of Nutrition & Food Sciences 2012. [Google Scholar]
- 46.Brand MW, Wannemuehler MJ, Phillips GJ, et al. The altered schaedler flora: Continued applications of a defined murine microbial community. ILAR Journal 2015; 56:169–178. [DOI] [PMC free article] [PubMed] [Google Scholar]
- 47.Couper KN, Blount DG, Riley EM. IL-10: The Master Regulator of Immunity to Infection. The Journal of Immunology 2008. [DOI] [PubMed] [Google Scholar]
- 48.Qin B, Wang J, Liang Y, et al. The Association between TNF-α, IL-10 Gene Polymorphisms and Primary Sjögren’s Syndrome: A Meta-Analysis and Systemic Review. PLoS ONE 2013. [DOI] [PMC free article] [PubMed] [Google Scholar]
- 49.Manti S, Leonardi S, Panasiti I, et al. Serum IL-10, IL-17 and IL-23 levels as “bioumoral bridges” between dyslipidemia and atopy. Cytokine 2017. [DOI] [PubMed] [Google Scholar]
- 50.Makita N, Hizukuri Y, Yamashiro K, et al. IL-10 enhances the phenotype of M2 macrophages induced by IL-4 and confers the ability to increase eosinophil migration. International Immunology 2015. [DOI] [PubMed] [Google Scholar]
- 51.Li MC, He SH. (2004) IL-10 and its related cytokines for treatment of inflammatory bowel disease. World Journal of Gastroenterology 2004. [DOI] [PMC free article] [PubMed] [Google Scholar]
- 52.Arcaro A, Guerreiro AS. The phosphoinositide 3-kinase pathway in human cancer: genetic alterations and therapeutic implications. Current genomics 2007. [DOI] [PMC free article] [PubMed] [Google Scholar]
- 53.Goodison S, Urquidi V, Tarin D. CD44 cell adhesion molecules. Molecular pathology : MP 1999. [DOI] [PMC free article] [PubMed] [Google Scholar]
- 54.Sun X, Bizhanova A, Matheson TD, et al. Ki-67 contributes to normal cell cycle progression and inactive X heterochromatin in p21 checkpoint-proficient human cells. Molecular and Cellular Biology 2017. [DOI] [PMC free article] [PubMed] [Google Scholar]
- 55.Lawrence T (2009) The nuclear factor NF-kappaB pathway in inflammation. Cold Spring Harbor perspectives in biology 2009. [DOI] [PMC free article] [PubMed] [Google Scholar]
- 56.Tchoupa AK, Schuhmacher T, Hauck CR. (2014) Signaling by epithelial members of the CEACAM family - Mucosal docking sites for pathogenic bacteria. Cell Communication and Signaling 2014. [DOI] [PMC free article] [PubMed] [Google Scholar]
- 57.Gipson IK. (2016) Goblet cells of the conjunctiva: A review of recent findings. Progress in Retinal and Eye Research 2016. [DOI] [PMC free article] [PubMed] [Google Scholar]
- 58.Lyer SS, Cheng G. Role of Interleukin 10 Transcriptional Regulation in Inflammation and autoimmune disease. National Institute of Health 2013. [DOI] [PMC free article] [PubMed] [Google Scholar]
- 59.Parlato M, Yeretssian G. (2014) NOD-like receptors in intestinal homeostasis and epithelial tissue repair. International Journal of Molecular Sciences 2014. [DOI] [PMC free article] [PubMed] [Google Scholar]
- 60.Samuels Y, Waldman T. Oncogenic mutations of PIK3CA in human cancers. Current Topics in Microbiology and Immunology 2010. [DOI] [PMC free article] [PubMed] [Google Scholar]
- 61.Pohlmann PR, Mayer IA, Mernaugh R. (2009) Resistance to trastuzumab in breast cancer. Clinical Cancer Research 2009. [DOI] [PMC free article] [PubMed] [Google Scholar]