Abstract
Purpose:
To report the technical aspects of noninvasive detection of cystathionine in human brain glioma with edited MRS, and to investigate possible further acquisition improvements for robust quantification of this metabolite.
Methods:
In vivo 1H MR spectra were acquired at 3 T in fifteen participants with an IDH-mutated glioma using a MEGA-PRESS sequence previously employed for 2-hydroxyglutarate detection (TR = 2 s, TE = 68 ms). The editing pulse was applied at 1.9 ppm for the edit-on condition and at 7.5 ppm for the edit-off condition. To evaluate the editing efficiency, spectra were acquired in one participant by placing the editing pulse for the edit-on condition at 1.9, 2.03 and 2.16 ppm. Cystathionine concentration was quantified using LCModel and a simulated basis set. To confirm chemical shifts and J-coupling values of cystathionine, the 1H NMR cystathionine spectrum was measured using a high-resolution 500 MHz spectrometer.
Results:
In twelve gliomas, cystathionine was observed in the in vivo edited MR spectra at 2.72 and 3.85 ppm, and quantified. The signal intensity of the cystathionine resonance at 2.72 ppm increased 1.7 and 2.13 times when the editing pulse was moved to 2.03 and 2.16 ppm, respectively. Cystathionine was not detectable in normal brain tissue.
Conclusions:
Cystathionine can be detected in vivo by edited MRS using the same protocol as for 2-hydroxyglutarate detection. This finding may enable a more accurate, noninvasive investigation of cellular metabolism in glioma.
Keywords: MEGA-PRESS, editing, brain glioma, 2-hydroxyglutarate, cystathionine
Introduction
Cystathionine is synthesized from homocysteine by the transsulfuration pathway, and is an immediate precursor of cysteine and glutathione, a major antioxidant (1). Decrease of glutathione levels in the brain induced by oxidative stress and elevated homocysteine levels in plasma and cerebrospinal fluid were suggested to play key roles in the pathogenesis of neurodegenerative diseases (1–4). In contrast, while the importance of cystathionine for the normal functioning of the brain was recognized several decades ago (5), the precise role of this amino acid in either healthy or diseased brain is still not clear. The presence of cystathionine at low concentration was reported in normal human brain tissue ex vivo (6), and its concentration was found to be higher in the brain than in other organs (7). Significant regional differences were observed within the brain (8–10), with the lowest concentration found in the cerebellum and cortex, and with the highest concentration found in the thalamus, ranging from 4.71 to 55.34 nmol/mg protein (11). The significance of variable cystathionine concentration in the brain is not known, and pharmacological studies have suggested a potential role as a neuromodulator (5,12).
Higher cystathionine levels in brain tumors compared to normal tissue were reported previously from ex vivo tissue analysis (6,13). In particular, tumors of glial origin showed the highest cystathionine concentrations, suggesting that cystathionine is preferentially synthesized in glial cells (6). In general, the average cystathionine level in higher grade gliomas (II/III, III/IV, IV) was higher relative to low grade gliomas (II), with no genetic information provided (13). Abnormal accumulation of cystathionine in breast cancer was also reported (14), and cystathionine was suggested to be a novel oncometabolite possibly contributing to drug resistance in cancer cells.
Abnormal cancer cell metabolism drives the accumulation of certain metabolites that may not be detected reliably using conventional MRS, due to the low concentration and the overlap with other metabolites. Edited MRS has been used in a number of studies to measure 2-hydroxyglutarate (2HG), a noninvasive marker of mutations in isocitrate dehydrogenase 1 and 2 genes (IDH½) in gliomas (15,16). Recently, we reported the detection of cystathionine using edited MRS, and explored the clinical utility of noninvasive cystathionine quantification in tumors, showing evidence of an association between cystathionine accumulation and 1p/19q codeletion in gliomas with IDH mutations (17).
In this work, we report further technical details regarding the measurement of cystathionine in human brain glioma in vivo with edited 1H MRS at 3 T. In vivo experiments, as well as simulations, allowed us to reliably assess the presence of cystathionine in the MR spectra of participants with glioma, and to investigate possible improvements in the acquisition strategy for an optimal detection and quantification of this metabolite.
Methods
Human participants
Fifteen participants (8 males; median age: 46 years, range: 32 – 68 years) with an IDH-mutated, 1p/19q codeleted glioma were included in the study. Additional inclusion criteria were: age > 18 years, Karnofsky performance status (KPS) > 60, and ability to provide written informed consent prior to inclusion in the study. These subjects were part of a larger cohort studied in our recent publication (17). The study was approved by the local ethical committee (CPP-Paris 6) in accordance with Declaration of Helsinki principles.
High-resolution 1H NMR spectroscopy
The 1H NMR spectrum of cystathionine was measured at physiological temperature (37°C) and pH (pH = 7) with a simple pulse-acquire sequence (repetition time (TR) = 3.4 s, number of averages = 16) using a high-resolution 500 MHz Varian INOVA spectrometer (Varian, Palo Alto, USA) equipped with a 5-mm probe.
In vivo MRI/MRS acquisition
Acquisitions were performed using a 3 T whole-body system (MAGNETOM Verio, Siemens, Erlangen, Germany) equipped with a 32-channel receive-only head coil. 3D FLAIR images (field-of-view = 255 × 255 × 144 mm3, resolution: 1.0 × 1.0 × 1.1 mm3, TR/TE = 5000/399 ms, scan time = 5.02 minutes) were acquired to position the spectroscopic VOI in the glioma (hyper-intense region in the images). MR spectra were acquired with a single-voxel spectral editing MEGA-PRESS sequence (18) using previously described procedures and parameters (TR = 2 s, TE = 68 ms, TE1 = 13.08 ms, TE2 = 54.92 ms, VOI > 6 cm3) (16). The editing pulse (single-banded 180-degree Shinnar-Le-Roux; duration = 19.2 ms; bandwidth = 62 Hz) was applied at 1.9 ppm for the edit-on condition and at 7.5 ppm for the edit-off condition, in an interleaved fashion (128 pairs of scans, scan time = 8.5 minutes). PRESS spatial localization utilized a 90° Hamming-filtered sinc pulse (duration = 2.32 ms, bandwidth = 3.83 kHz) and two 180° mao pulses (duration = 5.80 ms, bandwidth = 1 kHz). To evaluate the editing efficiency, two additional sets of spectra were acquired with editing pulse for the edit-on condition applied at 2.03 ppm and 2.16 ppm in one subject. The final spectra were calculated by subtracting the spectra acquired at the edit-on and edit-off conditions. For 8 subjects, the MEGA-PRESS acquisition was also performed in the contralateral region outside the visible lesions.
Water suppression was performed using variable power with optimized relaxation delays (VAPOR) and outer volume suppression techniques (19). Unsuppressed water scans were acquired from the same VOI for metabolite quantification and eddy current corrections using the same parameters as water suppressed spectra. B0 shimming was performed using a fast automatic shimming technique with echo-planar signal trains utilizing mapping along projections, FAST(EST)MAP (20).
In vivo MRS processing and quantification
The acquired spectra were processed in Matlab (MathWorks Inc., Natick, MA). Single-shot spectra were frequency and phase aligned using the total choline signal at 3.22 ppm. All spectra were analyzed using LCModel v6.3–0G (21) (Stephen Provencher, Inc., Oakville, ON, Canada) with the basis set simulated using the density matrix formalism (22) taking into account duration and patterns for 90° and 180° radiofrequency pulses, slice-selective gradients during 180° pulses, and timing used in vivo, as previously described (16). The basis set included 2-hydroxyglutarate (2HG), cystathionine, γ-aminobutyric acid (GABA), glutamate, glutamine, glutathione (GSH), N-acetylaspartate, N-acetylaspartylglutamate. The chemical shifts and J-coupling values of cystathionine are reported in Table 1. For the other metabolites, previously published chemical shifts and J-couplings were utilized (23,24).
Table 1.
Proton chemical shift and J-coupling values for cystathionine.
| Group | Chemical shift (ppm) | J-coupling (Hz) | Connectivity |
|---|---|---|---|
| 2CH | 3.85146 | 6.97 | 2-3 |
| 5.48 | 2-3’ | ||
| 3CH2 | 2.13537 | 14.78 | 3-3’ |
| 2.19154 | 8.49 | 3-4 | |
| 6.92 | 3-4’ | ||
| 6.30 | 3-4’ | ||
| 8.45 | 3’−4’ | ||
| 4CH2 | 2.70420 | 13.45 | 4-4’ |
| 2.72989 | |||
| 6CH2 | 3.07403 | 7.25 | 6-7 |
| 3.07403 | 4.32 | 6’−7 | |
| 14.75 | 6-6’ | ||
| 7CH | 3.9414 |
The quantification was carried out by scaling the signal using the unsuppressed water reference, assuming a tumor bulk water concentration of 55.5 mM, and a water transverse relaxation time constant (T2) of 150 ms (25,26). The reported concentrations are semiquantitative.
Tumor volumes were calculated from segmentation of FLAIR images using the ITK-SNAP software (www.itksnap.org) (27). The percentages of tumor tissue within the VOI were derived by overlaying the tumor masks with the corresponding VOIs.
Simulations
Using the same procedures which were used to generate the cystathionine spectrum for the basis set, a cystathionine PRESS spectrum with TE = 30 ms was also simulated. To assess the editing efficiency for both cystathionine and 2HG, MEGA-PRESS difference spectra at TE = 68 ms were simulated with the editing pulse during edit-on condition placed at 1.9, 2.03 and 2.16 ppm. The cystathionine resonance at 2.72 ppm and 2HG resonance at 4.02 ppm were evaluated as a function of the different editing pulse frequencies.
Results
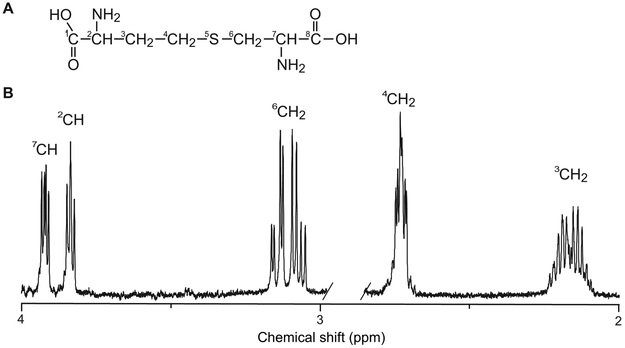
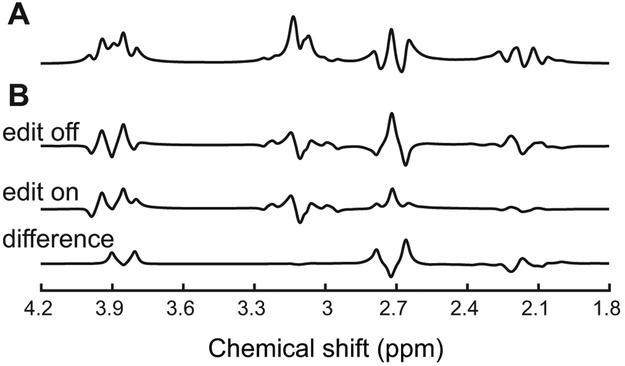
Cystathionine (2-amino-4-(2-amino-2-carboxyletheyl)sulfanylbutanoic acid) is a dipeptide formed by serine and homocysteine. Its chemical structure and high-resolution NMR spectrum are shown in Figure 1A and 1B, respectively. The chemical shifts, J-coupling constants, and connectivity are reported in Table 1. The 6CH2 and 7CH protons of the serine moiety form an ABX spin system with three doublet-of-doublets at 3.07, 3.14 and 3.94 ppm. The homocysteine moiety has two methylene groups and a methine group that are strongly coupled, forming an AMNPQ spin system. The signal from the single proton of the methine group forms a doublet of doublets centered at 3.85 ppm, while resonances from the four protons of the two methylene groups are grouped between 2.11 and 2.22 ppm, and 2.68 and 2.75 ppm. At the field strength of 3 T, the complex multiplets collapse into simplified resonance patterns, as shown in Figure 2A.
Figure 1. Structure and 1H NMR spectrum of cystathionine.
(A) Chemical structure and (B) high-resolution 1H NMR spectrum acquired at physiological temperature (37°C) and pH (pH = 7) obtained with a pulse-acquire sequence using a 500 MHz spectrometer. TR = 3.4 s, number of averages = 16.
Figure 2. Appearance of cystathionine at 3 T.
Simulated (A) PRESS spectrum with TE = 30 ms, and (B) MEGA-PRESS edit-off, edit-on and difference spectra with TE = 68 ms and editing pulse placed at 1.9 ppm using chemical shifts and J-coupling constants reported in Table 1. Simulated spectra are shown with 2 Hz line-broadening.
Under physiological conditions, all cystathionine resonances overlap with resonances of other compounds. The 4CH2 group from the homocysteine moiety is the least overlapped as it is only partially overlapped with resonances of the NAA multiplet and aspartate. The spectral overlap with other metabolites can be removed with the use of spectral editing methods such as MEGA-PRESS. Indeed, the cystathionine resonances at 2.13 and 2.19 ppm resonate within the bandwidth of the editing pulse placed at 1.9 ppm used for GABA and 2HG detection and are J-coupled to resonances at 2.70, 2.73, and 3.85 ppm. As a consequence, the edited spectrum has two major resonances at 2.72 and 3.85 ppm (Figure 2B). In the in vivo edited spectrum, the resonances at 2.72 ppm are clearly visible and do not overlap with any other metabolite, while resonances at 3.85 ppm overlap with glutamate, glutamine, and GSH signals (Figure 3).
Figure 3. In vivo detection of cystathionine.
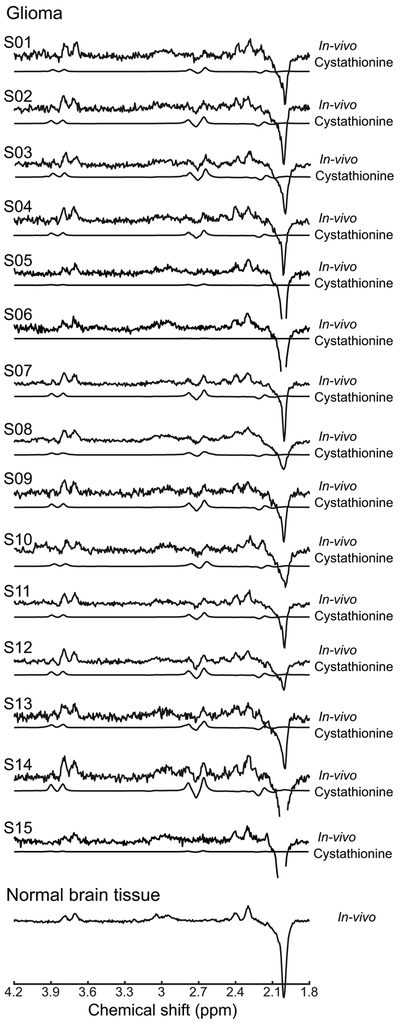
In vivo spectra from each of the 15 patients with glioma and one in vivo spectrum from normal brain tissue are shown with the cystathionine contribution fitted by LCModel. The cystathionine pattern is visible in 12 patients at 2.72 ppm in glioma, while it is not detectable in 3 patients nor in the normal tissue. Spectra are scaled with respect to the water signal. No line-broadening was applied. TR = 2 s, TE = 68 ms, 128 pairs of averages.
The cystathionine concentration in gliomas ranged from 0.2 mM to 4.1 mM, as reported previously (17). Cystathionine was not detectable in normal brain tissue (Figure 3). Integrated diagnosis with IDH and 1p/19q status according to the 2016 World Health Organization (28) are reported in Table 2, together with cystathionine and 2HG concentrations and associated Cramer-Rao lower bounds (CRLBs). The size of the spectroscopic VOI and the percentage of tumor in the VOI are also listed in Table 2 for each subject. In three subjects, the percentage of tumor tissue in the VOI was lower than 80%. In two of these, the cystathionine concentration was very low. In three cases in which cystathionine was below 1 mM, the cystathionine resonances could not be visually identified, and the signal-to-noise ratio, calculated as the maximum amplitude of the fitted signal between 2.6 and 2.8 ppm divided by the root-mean-square of the noise, was below 1.
Table 2.
Histomolecular features of the cohort, together with cystathionine and 2HG concentrations from edited MRS.
| Subject # |
Histological diagnosis | IDH status | 1p/19q codel | [Cystathionine, mM] (CRLB, %) |
[2HG, mM] (CRLB, %) |
VOI size, mL/ Tumor in VOI, % |
|---|---|---|---|---|---|---|
| S01 | Oligodendroglioma grade II | IDH1 R-132H | Yes | 2.4 (20) | 4.9 (10) | 8/90 |
| S02 | Oligodendroglioma grade II | IDH1 R-132H | Yes | 3.8 (11) | 1.7 (25) | 6.4/97 |
| S03 | Oligodendroglioma grade II | IDH1 R-132H | Yes | 2.0 (21) | 1.9 (22) | 8/94 |
| S04 | Oligodendroglioma grade II | IDH1 R-132H | Yes | 2.0 (14) | 1.7 (17) | 7.2/89 |
| S05 | Oligodendroglioma grade II | IDH1 R-132H | Yes | 0.8 (57) | 0.9 (57) | 12/75 |
| S06 | Oligodendroglioma grade II | IDH1 R-132H | Yes | 0.2 (221) | 1.0 (38) | 10/50 |
| S07 | Anaplastic oligodendroglioma grade III | IDH1 R-132H | Yes | 4.0 (7) | 2.6 (11) | 8/91 |
| S08 | Anaplastic oligodendroglioma grade III | IDH1 R-132H | Yes | 3.2 (11) | 2.7 (11) | 20/87 |
| S09 | Anaplastic oligodendroglioma grade III | IDH1 R-132H | Yes | 2.0 (26) | 2.2 (25) | 8/97 |
| S10 | Anaplastic oligodendroglioma grade III | IDH1 R-132H | Yes | 1.5 (32) | 9.6 (6) | 9.7/88 |
| S11 | Anaplastic oligodendroglioma grade III | IDH1 R-132H | Yes | 3.9 (11) | 3.1 (14) | 8/100 |
| S12 | Anaplastic oligodendroglioma grade III | IDH1 R-132H | Yes | 3.7 (8) | 2.0 (16) | 10.6/100 |
| S13 | Anaplastic oligodendroglioma grade III | IDH1 R-132H | Yes | 4.1 (14) | 1.2 (45) | 8/98 |
| S14 | Anaplastic oligodendroglioma grade III | IDH1 R-132C | Yes | 2.9 (16) | 1.1 (38) | 8/45 |
| S15 | Anaplastic oligodendroglioma grade III | IDH1 R-132H | Yes | 0.5 (79) | 1.2 (36) | 9/91 |
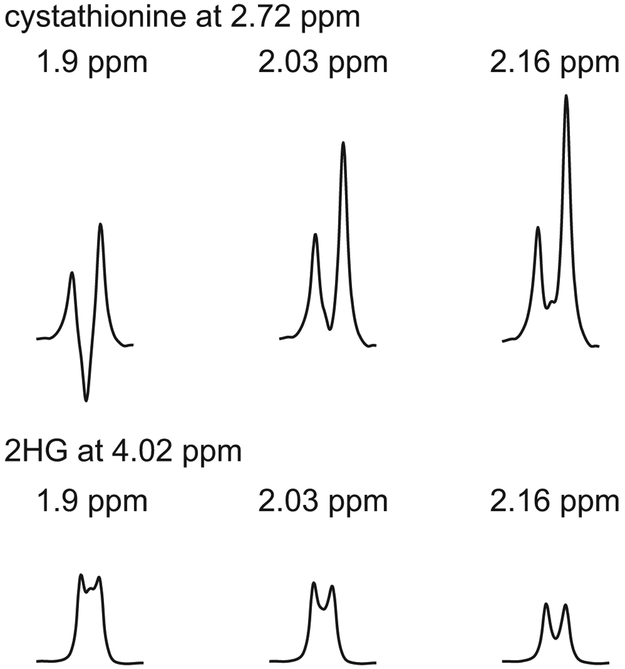
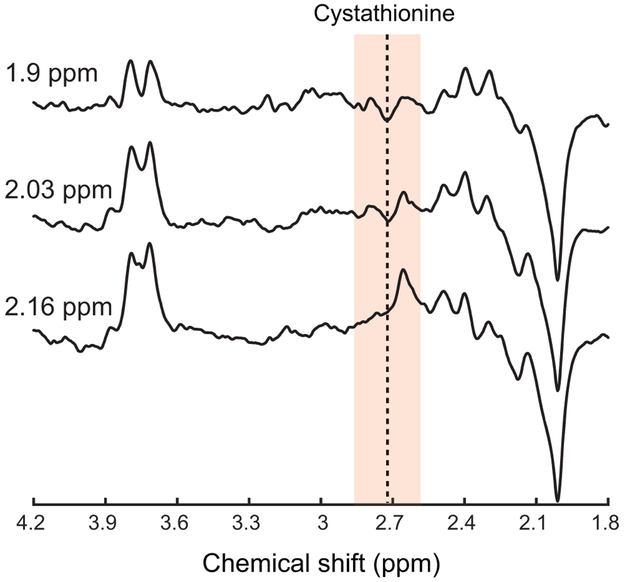
The signal intensity of the cystathionine resonance at 2.72 ppm increased 1.7 and 2.13 times when the editing pulse was moved to 2.03 and 2.16 ppm, respectively (Figure 4). A similar increase in the editing efficiency of cystathionine was also observed in vivo (Figure 5). The signal intensity of 2HG decreased 9% and 33% when the editing pulse was moved to 2.03 and 2.16 ppm, respectively (Figure 4).
Figure 4. Editing efficiency for cystathionine and 2HG.
Simulated MEGA-PRESS difference spectra at TE = 68 ms with the editing pulse during edit-on condition placed at 1.9, 2.03 and 2.16 ppm focusing on (top) cystathionine resonance at 2.72 ppm and (bottom) 2HG resonance at 4.02 ppm.
Figure 5. Editing efficiency for cystathionine in vivo.
MEGA-PRESS difference spectra at TE = 68 ms acquired in a participant with glioma with the editing pulse during the edit-on condition placed at 1.9, 2.03 and 2.16 ppm. 2HG was not observed in this participant. TR = 2 s, 96 pairs of scans.
Discussion
The cystathionine signal at 2.72 ppm as well as the 2HG signal at 4 ppm are detected with no overlap with other metabolites when using edited MRS. The cystathionine signal was unexpectedly observed during our previous study focusing on the measurement of 2HG (16), and identified as cystathionine based on the agreement with phantom and simulated spectra (17). While the editing efficiency is optimal for 2HG detection using an editing pulse placed at 1.9 ppm, a significant improvement can be achieved with regards to cystathionine detection by tuning the editing pulse frequency. By using an editing pulse centered at 2.03 ppm, it is possible to achieve a 70% increase in the cystathionine signal with a relatively low loss of 2HG signal. Further gain in both the cystathionine and 2HG signals can be obtained by replacing the MEGA-PRESS sequence with a MEGA-LASER sequence, which has been shown to provide 60% more 2HG signal compared to MEGA-PRESS (29).
2HG detection by MRS has been shown to provide a unique way to noninvasively predict IDH mutations, with high clinical impact with respect to diagnosis and prognosis in patients with brain tumors (15,16,30). On the other hand, cystathionine accumulation could be linked to abnormalities in intermediary metabolisms in tumor cells. Although cystathionine is also present in small concentrations in healthy tissue, in this study it was not detectable in normal brain tissue. We have recently shown that higher cystathionine levels are associated with 1p/19q codeletion and that cystathionine could represent a noninvasive marker of abnormal expression of cystathionine-pathway genes such as cystathionine gamma-lyase (CTH) and cystathionine beta-synthase (CBS) (17). In a previous ex-vivo study, the changed profile of CTH activity and cystathionine levels in gliomas were correlated and both of them decreased with the increase of the grade of glioma malignancy (13). Additionally, our observations suggested that cystathionine increase is associated with enhanced CBS activity likely due to a compensatory mechanism induced by oxidative stress, and that this process may be exacerbated in the presence of 1p/19q codeletion due to reduced activity of CTH (located on chromosome 1p) (17). Notably, high CBS expression was suggested to confer better prognosis in IDH-mutated gliomas with 1p/19q codeletion (31). Further investigations are needed to evaluate the possible role of cystathionine as a marker of antioxidative activity in brain tumors and, eventually, its prognostic value.
Conclusions
Cystathionine can be detected and quantified reliably in glioma in vivo by edited MRS. Our findings open up the possibility to investigate in vivo the potential clinical relevance of cystathionine as a candidate marker of transsulfuration pathway disruption in brain glioma and other neurodegenerative diseases. The possibility of simultaneous detection of cystathionine and 2HG in brain tumors will allow for a more specific characterization of glioma sub-types, with great benefits for patient care and treatment.
Acknowledgements:
The authors would like to thank Neil Taylor from Chenomx Inc. (Edmonton, Alberta, Canada) for providing the chemical shifts and J-couplings of cystathionine, Sylvie Pailloux, Ph.D., for acquiring NMR spectrum, and Edward J. Auerbach, Ph.D., for implementing MRS sequences on the Siemens platform and for careful reading of the manuscript. FB and SL acknowledge support from Investissements d’avenir [grant number ANR-10-IAIHU-06 and ANR-11-INBS-0006]. DD and MM acknowledge support from following National Institutes of Health grants: BTRC P41 EB015894 and P30 NS076408. MS acknowledge support from INCa-DGOS-Inserm_12560 (SiRIC CURAMUS).
References
- 1.Vitvitsky V, Thomas M, Ghorpade A, Gendelman HE, Banerjee R. A functional transsulfuration pathway in the brain links to glutathione homeostasis. J Biol Chem. 2006;281:35785–35793. [DOI] [PubMed] [Google Scholar]
- 2.Isobe C, Murata T, Sato C, Terayama Y. Increase of total homocysteine concentration in cerebrospinal fluid in patients with Alzheimer’s disease and Parkinson’s disease. Life Sci. 2005;77:1836–1843. [DOI] [PubMed] [Google Scholar]
- 3.Seshadri S, Beiser A, Selhub J, et al. Plasma homocysteine as a risk factor for dementia and Alzheimer’s disease. New Engl J Med. 2002;346:476–483. [DOI] [PubMed] [Google Scholar]
- 4.Clarke R, Smith AD, Jobst KA, Refsum H, Sutton L, Ueland PM. Folate, vitamin B12, and serum total homocysteine levels in confirmed Alzheimer disease. Arch Neurol. 1998;55:1449. [DOI] [PubMed] [Google Scholar]
- 5.Werman R, Davidoff RA, Aprison MH. The inhibitory action of cystathionine. Life Sci. 1966;5:1431–1440. [DOI] [PubMed] [Google Scholar]
- 6.Lefauconnier J-M, Portemer C, Chatagner F. Free amino acids and related substances in human glial tumours and in fetal brain: comparison with normal adult brain. Brain Res. 1976;117:105–113. [DOI] [PubMed] [Google Scholar]
- 7.Tallan HH, Moore S, Stein WH. L-cystathionine in human brain. J Biol Chem. 1958;230:707–716. [PubMed] [Google Scholar]
- 8.Sturman JA, Gaull GE, Niemann WH. Cystathionine synthesis and degradation in brain, liver and kidney of the developing monkey. J Neurochem. 1976;26:457–463. [DOI] [PubMed] [Google Scholar]
- 9.Sturman JA, Rassin DK, Gaull GE. Relation of three enzymes of transsulphuration to the concentration of cystathionine in various regions of monkey brain. J Neurochem. 1970;17:1117–1119. [DOI] [PubMed] [Google Scholar]
- 10.Gjessing LR, Torvik A. Distribution of cystathionine in the human brain. Scan J Clin Lab Invest. 1966;18:565. [DOI] [PubMed] [Google Scholar]
- 11.Bronowicka-Adamska P, Zagajewski J, Czubak J, Wróbel M. RP-HPLC method for quantitative determination of cystathionine, cysteine and glutathione: an application for the study of the metabolism of cysteine in human brain. J Chromatogr B. 2011;879:2005–2009. [DOI] [PubMed] [Google Scholar]
- 12.Key B, White R. Neuropharmacological comparison of cystathionine, cysteine, homoserine and alpha-ketobutyric acid in cats. Neuropharmacology. 1970;9:349–357. [DOI] [PubMed] [Google Scholar]
- 13.Wróbel M, Czubak J, Bronowicka-Adamska P, Jurkowska H, Adamek D, Papla B. Is development of high-grade gliomas sulfur-dependent? Molecules. 2014;19:21350–21362. [DOI] [PMC free article] [PubMed] [Google Scholar]
- 14.Sen S, Kawahara B, Mahata SK, et al. Cystathionine: A novel oncometabolite in human breast cancer. Arch Biochem Biophys. 2016;604:95–102. [DOI] [PubMed] [Google Scholar]
- 15.Andronesi OC, Kim GS, Gerstner E, et al. Detection of 2-hydroxyglutarate in IDH-mutated glioma patients by in vivo spectral-editing and 2D correlation magnetic resonance spectroscopy. Sci Transl Med. 2012;4:116ra4–116ra4. [DOI] [PMC free article] [PubMed] [Google Scholar]
- 16.Branzoli F, Di Stefano AL, Capelle L, et al. Highly specific determination of IDH status using edited in vivo magnetic resonance spectroscopy. Neuro Oncol. 2018;20:907–916. [DOI] [PMC free article] [PubMed] [Google Scholar]
- 17.Branzoli F, Pontoizeau C, Tchara L, et al. Cystathionine as a marker for 1p/19q codeleted gliomas by in vivo magnetic resonance spectroscopy. Neuro Oncol. Epub ahead of print. [DOI] [PMC free article] [PubMed] [Google Scholar]
- 18.Mescher M, Merkle H, Kirsch J, Garwood M, Gruetter R. Simultaneous in vivo spectral editing and water suppression. NMR Biomed. 1998;11:266–272. [DOI] [PubMed] [Google Scholar]
- 19.Tkac I, Starcuk Z, Choi I-Y, Gruetter R. In vivo 1H NMR spectroscopy of rat brain at 1 ms echo time. Magn Reson Med. 1999;41:649–656. [DOI] [PubMed] [Google Scholar]
- 20.Gruetter R, Tkáč I. Field mapping without reference scan using asymmetric echo-planar techniques. Magn Reson Med. 2000;43:319–323. [DOI] [PubMed] [Google Scholar]
- 21.Provencher SW. Estimation of metabolite concentrations from localized in vivo proton NMR spectra. Magn Reson Med. 1993;30:672–679. [DOI] [PubMed] [Google Scholar]
- 22.Henry P-G, Marjanska M, Walls JD, Valette J, Gruetter R, Ugurbil K. Proton-observed carbon-edited NMR spectroscopy in strongly coupled second-order spin systems. Magn Reson Med. 2006;55:250–257. [DOI] [PubMed] [Google Scholar]
- 23.Govindaraju V, Young K, Maudsley AA. Proton NMR chemical shifts and coupling constants for brain metabolites. NMR Biomed. 2000;13:129–153. [DOI] [PubMed] [Google Scholar]
- 24.Kaiser LG, Marjańska M, Matson GB, et al. 1H MRS detection of glycine residue of reduced glutathione in vivo. J Magn Reson. 2010;202:259–266. [DOI] [PMC free article] [PubMed] [Google Scholar]
- 25.Madan A, Ganji SK, An Z, et al. Proton T2 measurement and quantification of lactate in brain tumors by MRS at 3 Tesla in vivo: lactate T2 measurement in brain tumors. Magn Reson Med 2015;73:2094–2099. [DOI] [PMC free article] [PubMed] [Google Scholar]
- 26.Berrington A, Voets NL, Plaha P, et al. Improved localisation for 2-hydroxyglutarate detection at 3T using long-TE semi-LASER. Tomography. 2016;2:94. [DOI] [PMC free article] [PubMed] [Google Scholar]
- 27.Yushkevich PA, Piven J, Hazlett HC, et al. User-guided 3D active contour segmentation of anatomical structures: Significantly improved efficiency and reliability. Neuroimage 2006;31:1116–1128. [DOI] [PubMed] [Google Scholar]
- 28.Louis DN, Perry A, Reifenberger G, et al. The 2016 World Health Organization classification of tumors of the central nervous system: a summary. Acta Neuropathol. 2016;131:803–820. [DOI] [PubMed] [Google Scholar]
- 29.Andronesi OC, Loebel F, Bogner W, et al. Treatment response assessment in IDH-mutant glioma patients by noninvasive 3D functional spectroscopic mapping of 2-hydroxyglutarate. Clin Canc Res. 2016;22:1632–1641. [DOI] [PMC free article] [PubMed] [Google Scholar]
- 30.Choi C, Ganji SK, DeBerardinis RJ, et al. 2-hydroxyglutarate detection by magnetic resonance spectroscopy in IDH-mutated patients with gliomas. Nat Med. 2012;18:624–629. [DOI] [PMC free article] [PubMed] [Google Scholar]
- 31.Fack F, Tardito S, Hochart G, et al. Altered metabolic landscape in IDH‐mutant gliomas affects phospholipid, energy, and oxidative stress pathways. EMBO Mol Med. 2017;9:1681–1695. [DOI] [PMC free article] [PubMed] [Google Scholar]


