

Abstract
The deleterious effects of PCB 126 are complex, and the role of the liver in modifying toxic insult is not well understood. We utilized metabolomics approaches to compare liver metabolites significantly affected by PCB 126 in control mice and a diet induced liver injury mouse model. In this 14-week study, mice were fed either an amino acid supplemented control diet (CD) or a methionine-choline deficient diet (MCD) which promoted nonalcoholic steatohepatitis (NASH) and were subsequently exposed to PCB 126. The liver metabolome was profiled by a global metabolomic analysis using LC-MS. There were clear differences between PCB 126 exposed and control mice in the hepatic metabolomic profiles (216 and 266 metabolites were altered in CD-fed and MCD-fed mice respectively after PCB 126 exposure). PCB 126 modulated glycerophospholipid metabolism, glutathione metabolism, and CoA biosynthesis pathways irrespective of diet; indicating that the disturbance in lipid metabolism and thiol metabolites are general markers of PCB 126 exposure irrespective of liver health. Additionally, metabolites associated with oxidative stress and mitochondrial dysfunction were greatly elevated in PCB 126 exposed mice with compromised livers (e.g., 4-hydroxy-nonenal glutathione, oxylipids, uric acid, and acylcarnitines). Moreover, PCB 126 exposure downregulated redox genes, and the effect was more pronounced in liver injury mice. In conclusion, this study demonstrates that PCB 126 could induce oxidative stress and metabolic dysfunction, and pre-existing liver injury can markedly modify PCB 126-induced metabolic changes. Using metabolic profiling, this study suggests mechanism of enhanced PCB 126 toxicity under liver injury settings.
Keywords: PCB 126, ROS, methionine-choline deficient diet, metabolomics, mass spectrometry, NASH
Introduction
Polychlorinated biphenyls (PCBs) are a group of bicyclic chlorinated hydrocarbons that continue to bioaccumulate because of their lipophilicity and resistance to physical, chemical, and enzymatic breakdown. PCBs are broadly classified as dioxin-like and non-dioxin like congeners based on their similarities in toxicity relative to 2,3,7,8-tetrachlorodibenzo-p-dioxin (TCDD). Exposure to dioxin-like PCBs has been shown to be strongly associated with a variety of adverse disorders encompassing neurological, reproductive, developmental, immunological, and metabolic effects, thereby posing a great threat to public health (Cave et al., 2010; Crinnion, 2011; Boucher et al., 2015; Park et al., 2016). Furthermore, exposure to both dioxin and non-dioxin liked PCBs have been correlated with liver dysfunctions such as nonalcoholic fatty liver disease (NAFLD) which is a spectrum of liver pathologies, ranging from simple steatosis to more severe stages including nonalcoholic steatohepatitis (NASH), liver fibrosis and cirrhosis. NAFLD and NASH have been estimated to affect more than 20% of the general population worldwide (Abd El-Kader and El-Den Ashmawy, 2015) with identifiable risk factors including obesity, hyperlipidemia and diabetes (Streba et al., 2015). In recent years, a “multiple-hit” theory has been proposed for disease progression in NAFLD from simple steatosis to severe forms such as steatohepatitis. For example, intake of high caloric diet could be a “first-hit” resulting in steatosis, while a “second-hit” could be sedentary lifestyle, or parallel cytotoxic events, such as hormonal or nutritional perturbation, or gut microbiota alteration. Moreover, numerous studies have recognized that environmental chemicals play a significant role in exacerbating liver disease, thereby acting as a “second-hit” (Arciello et al., 2013; He et al., 2013; Duval et al., 2017). Given the substantial prevalence of liver disease in the general population, and reports of hepato-toxicity with environmental chemical exposures, the mechanistic effects of environmental chemicals on liver disease progression warrant further investigation. One of the widely used animal models of NASH is the methionine- and choline-deficient diet (MCD) fed mice model. Despite the fact that there are significantly physiological differences between MCD diet-induced NASH models and human NASH, this model is useful to investigate PCB 126 effects under liver damaged conditions (Chiba et al., 2016), because it could effectively introduce severe hepatic steatosis and inflammation without secondary obesity, which otherwise could potentially change the distribution and disposition of lipophilic PCB 126, therefore blunt the effects of PCB 126 in liver. Also, the MCD-induced NASH model closely resembles human NASH histology; hence this model has been applied for studying adverse drug reactions and toxicities under pre-existing NASH conditions (Clarke et al., 2015; Li et al., 2018).
It is well documented that dioxin-like PCBs exert toxic effects primarily through activation of the aryl hydrocarbon receptor, which result in the upregulation of drug-metabolizing and detoxification enzymes. Because many enzymes induced by dioxin-like PCBs are linked to the generation of reactive oxygen species (ROS), oxidative stress or changes in redox status are commonly associated with dioxin-like PCBs exposures (Hennig et al., 2002; Ramadass et al., 2003; Green et al., 2008). Systemic analysis of small molecule metabolites (metabolomics) can provide insights into metabolic regulation. It can detect global metabolic changes in response to various stimuli in an unbiased manner. The majority of studies pertaining to the metabolic ramifications of PCBs exposure use models with no pre-existing disease states, and coincident observations across such studies include impaired gluconeogenesis, altered hepatic glucose production and lipid metabolism (Gadupudi et al., 2016; Wu et al., 2016; Wu et al., 2017). No current studies have evaluated the effects of liver disease on dioxin-like PCB induced toxicity under liver disease status. Our laboratory has previously demonstrated that exposure to PCB 126, the most potent dioxin-like PCB, increased peripheral inflammation in the MCD-induced liver injury mouse model. Aggravated PCB 126-induced inflammation in mice with preexisting liver injury was observed in the liver, adipose, spleen, and in the circulation (Wahlang et al., 2017). In the present study, MCD-fed mice were used to investigate the changes in hepatic metabolic profiles as a consequence of PCB 126 exposure. We sought to understand how PCB 126 mediated toxicity is manifested at the small molecule metabolites level, to discern the metabolomic differences of PCB 126 toxicity under normal and liver injury conditions, and to elucidate the metabolic basis for possible associations between liver injury and PCB 126-promoted cardiometabolic disease risk. The data obtained from the current study demonstrate that PCB 126 exposure can alter liver metabolome, exacerbate metabolic disturbances associated with liver injury, and aggravate redox stress that may predispose to cardiometabolic complications. Metabolic profiling provides a powerful tool to understand and identify dysfunctional pathways associated with liver disease and exposure risks to environmental pollutants.
Methods
Animal Experiments
The results from this study used samples from our previously reported work (Wahlang et al., 2017). Briefly, C57BL/6 male mice at 8 weeks of age were purchased from Taconic (Hudson, NY, USA) and were allowed to acclimate for a period of 1 week. Mice were divided into 4 study groups, including CD+vehicle, CD+PCB 126, MCD+vehicle, and MCD+PCB 126. Animals were fed either the amino acid control diet (CD; TD.94149; Envigo, Madison, WI, USA) or the methionine-choline deficient diet (MCD; TD.90262, Envigo) for a period of 4 weeks. Then the mice were treated by intragastric gavage with 1.53 µmol kg−1 of PCB 126 (AccuStandard, CT, USA) in corn oil or vehicle alone. Animals were euthanized (ketamine/xylazine, 100/20 mg kg−1 body weight, i.p.) at week 14. Tissues were harvested and stored at −80 °C prior to analysis. The animal protocol was approved by the University of Kentucky Institutional Animal Care and Use Committee.
Liver Metabolomic Profiling
A global metabolomics approach was performed using a pipeline developed by Metabolon Inc. (Durham, NC). Six liver samples were chosen at random from each treatment group and were extracted using an automated MicroLab STAR system (Hamilton Company, Salt Lake City, UT) in methanol. Quality control (QC) samples were prepared by pooling the liver samples, and the overall instrument and process variability was determined by calculating the median RSD for all endogenous metabolites present in 100% of the technical replicates of QC samples. Liquid chromatography-mass spectrometry analysis was carried out using a Waters ACQUITY ultra high-performance liquid chromatography (UHPLC) and a Thermo Scientific Q-Exactive orbitrap mass spectrometer (MS) interfaced with a heated electrospray ionization source. The orbitrap mass analyzer was operated at 35,000 mass resolution. Four separate injections were performed on each sample using different UHPLC-MS platforms designed for the detection of metabolite with various polarity and ionization property. The mass spectrometry analysis alternated between full scan and data-dependent MSn scans using dynamic exclusion. The scan range varied slighted between methods but covered 70–1000 m/z. Metabolites were identified by automated comparison of the ion features in the experimental samples with a reference library of chemical standard entries that included retention time, precursor ion, and their associated product ion mass spectra. This library allowed the rapid identification of metabolites with high confidence.
Data Analysis
Raw data for liver samples was extracted, peak-identified and processed using Metabolon’s hardware and software. LC-MS peaks were quantified using area-under-the-curve. Raw counts were log transformed to correct for heteroscedasticity and balance distributions, then the data were normalized by median centering (van den Berg et al., 2006). Metabolites with a missing intensity score, indicating low levels of that metabolite in the sample, were imputed with a small number (half of the minimum value for the study). Partial least-squares discriminant analysis (PLS-DA) was used to identify initial trends and clusters in data sets, which was performed using the Metaboanalyst 3.0 web portal (www.metaboanalyst.ca). Principal components denote the percentage of the contribution that can explain the original data set after linear transformation. Component 1 is defined as representing the highest possible variability in the data set after transformation is applied. Component 2 represents the second highest variability after transformation. Statistical analysis of fold changes by two-way ANOVA was used to determine metabolites with significant changes (p ≤ 0.05) for samples obtained from the CD and MCD mice. To identify the most relevant metabolic pathways involved in PCB 126 exposure, metabolic pathway analysis was employed using the MetaboAnalyst, and metabolites which showed significance change were mapped to the Kyoto Encyclopedia of Genes and Genomes (KEGG) pathways using Human Metabolome Database numbers.
Statistical analyses of gene expression data were performed using the GraphPad Prism version 7.04 for Windows (GraphPad Software Inc., La Jolla, CA, USA). Multiple group data were compared using Two Way ANOVA (column factor: diet and row factor: PCB 126) followed by Tukey’s post-hoc test for multiple comparisons, and p< 0.05 was considered statistically significant.
Quantitation of hepatic gene expression
Total cellular RNA was extracted from 20 mg frozen liver samples using the TRIzol reagent (Thermo Fisher Scientific Inc, Waltham, MA, USA). RNA purity and quantity were assessed with the NanoDrop 2000/2000c (Thermo Fisher Scientific Inc). cDNA was synthesized from total RNA using the QuantiTect Reverse Transcription Kit (Qiagen, Valencia, CA, USA). Real-time PCR was performed with Taqman Fast Advanced Master Mix (Thermo Fisher Scientific Inc) or Syber Green I GoTaq® qPCR Master Mix (Promega BioSciences. Sunnyvale, CA). Primer sequences of xanthine oxidase gene (XO/XDH, Mm00442110_m1) and β-actin (Actb, Mm02619580_g1) were purchased from Taqman Gene Expression Assays (Thermo Fisher Scientific Inc). Primer sequences of GPX1, GSTa1, SOD1, Grx1, Grx2, HO1 (Table S1) for SYBR Green reactions were designed using the Primer Express Software 3.0 for real-time PCR (Applied Biosystems) and synthesized by Integrated DNA Technologies, Inc. (Coralville, IA, USA). The gene expression levels were calculated using the 2−ΔΔCt method.
Results
PCB 126 exposure induce changes in the liver metabolome
Metabolites that could be protonated or deprotonation in electrospray ionization are within the metabolome coverage using LC-MS analysis. The intrinsic physiological responses of an organism after PCB 126 exposure could be reflected and propagated by the alteration in metabolic fingerprints. Metabolomic analysis of known compounds using LC-MS identified a total of 679 metabolites in mouse liver. The median RSD for metabolites detected in QC samples was 8%, indicating the analysis is highly reproducible. A PLS-DA was performed to delineate putative metabolites that contribute differential effects of diet and PCB 126 exposure on the mouse liver metabolome. There are clear differences between PCB 126 and vehicle treated mice in both CD- and MCD-fed mice (Figure 1A), with greater separation observed in the MCD groups, indicating considerable variation in the hepatic metabolite composition after PCB 126 exposure with concurrent liver injury. Analysis of statistically significant metabolites identified by two-way ANOVA (p ≤ 0.05) revealed that among the 216 significant metabolites whose abundance had changed in the CD groups, 84 metabolites increased in abundance after PCB 126 exposure, whereas 132 metabolites exhibited decreased levels. Of the 266 significant metabolites in MCD groups, 129 metabolites increased in abundance after PCB 126 exposure, whereas 137 metabolites exhibit decreased levels (Supplementary Table S2). All altered metabolites were next grouped by categories, which revealed major changes in lipids, amino acids, and carbohydrates (Figure 1B). To understand the functional role of these alterations in liver, the KEGG metabolic library was analyzed using Metaboanalyst.
Figure 1. Global metabolomic analysis of liver samples from CD- and MCD-fed mice in response to PCB 126.

(A) Partial least squares with discriminant analysis (PLS-DA) revealed distinctive changes of the metabolome after PCB 126 exposure in both CD and MCD groups. (B) Categorization of metabolites change significantly after PCB 126 exposure based on two-way ANOVA (p<0.05, fold change≥ 1 or <1) of normalized LC-MS data.
The most significant pathways were plotted in terms of hypergeometric test p values (vertical axis, shades of red) and impact (horizontal axis, circle diameter). The results showed different metabolic network reprogramming after PCB 126 exposure in CD- and MCD-fed mice (Figure 2). There were four most influenced (pathway impact >0.1, and p < 0.01) pathways in CD mice liver after PCB 126 exposure: (1) pantothenate and coenzyme A (CoA) biosynthesis; (2) glycerophospholipid metabolism; (3) glutathione metabolism, and (4) sphingolipid metabolism. In MCD+PCB 126 group, the above-mentioned pathways namely 1–3 were also changed, and there were five additional pathways that were impacted, including: (5) taurine and hypotaurine metabolism; (6) purine metabolism; (7) pyrimidine metabolism; (8) nicotinate and nicotinamide metabolism, and (9) glycolysis and gluconeogenesis. The results suggest that alterations of lipids and thiol metabolites were common metabolic features after PCB 126 exposure regardless of diet, and the metabolism disturbance effects due to PCB 126 exposure were more pronounced in MCD mice as more pathways were perturbed. It has been well established that lipid metabolism is changed after PCB exposure(Yadetie et al., 2014; Kania-Korwel et al., 2017), therefore, lipidomics was not explored further in the present study. Because metabolic pathways are interconnected and perturbation of certain central metabolites could have an impact on multiple metabolic pathways, we attempted to analyze effects of diet and PCB exposure on related metabolic pathways.
Figure 2. Metabolome view from pathway analysis performed using MetaboAnalyst.
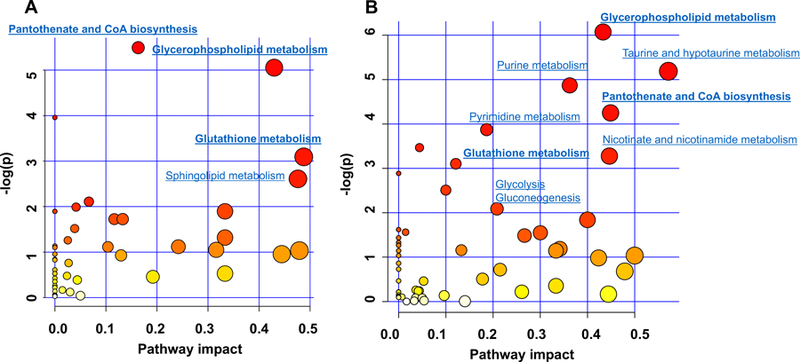
(A) Pathways that have been changed due to PCB 126 exposure in CD-fed mice. (B) Pathways that have been changed due to PCB 126 exposure in MCD-fed mice. Pathways were plotted according to hypergeometric test p-value (vertical axis, shades of red) and impact factor (horizontal axis, circle diameter).
PCB 126 exposure causes perturbations in carbohydrate metabolism
One of the most significant differences between the PCB 126 and vehicle treatment was carbohydrate metabolism, and the responses toward PCB 126 exposure were dramatically different between CD and MCD groups. In the CD groups, the metabolites in glycolysis pathway were decreased in PCB 126 exposed mice compared with the unexposed control mice. Those metabolites included glucose 6-phosphate, fructose 6-phosphate, fructose 1,6-diphosphate/glucose 1,6-diphosphate, and dihydroxyacetone phosphate. In addition, phosphoenolpyruvate, a gluconeogenic metabolite produced by phosphoenolpyruvate carboxykinase (PEPCK) was increased in PCB 126 exposed CD-fed mice. Furthermore, levels of glycogen metabolites in CD mice liver were significantly decreased after PCB 126 exposure, including maltohexaose (0.08-fold change compare with control), maltopentaose (0.13-fold), maltotetraose (0.22-fold), maltotriose (0.39-fold), and maltose (0.54-fold). These results indicate impaired glycogen metabolism and glycolysis after PCB 126 exposure in CD-fed mice. On the contrary, in the MCD groups, the levels of glucose 6-phosphate, fructose 1,6-diphosphate/glucose 1,6-diphosphate, and dihydroxyacetone phosphate were increased, while phosphoenolpyruvate was decreased in PCB 126-exposed mice compared with MCD control mice. No significant differences were observed with glycogen metabolites in the MCD+PCB 126 vs. MCD mice. Hepatic mRNA analysis from our previous study demonstrated that PCB 126 exposure in MCD-fed mice drastically decreased the expression of G6Pase (Wahlang et al., 2017), which is a major enzyme in gluconeogenesis and catalyzes the hydrolysis of glucose-6-phosphate to glucose. This is consistent with the observation that glucose-6-phosphate and the related glycolysis metabolites accumulated in MCD+PCB 126 mice. The Pepck-1 gene product is responsible for the decarboxylation of oxaloacetate to produce phosphoenolpyruvate, and the expression of Pepck-1 was decreased in livers from mice in the MCD+PCB 126 vs. the MCD group in our previous study (Wahlang et al., 2017). This contributed to the decrease of phosphoenolpyruvate in MCD+PCB mice. Taken together, in the presence of a compromised, liver PCB 126 led to downregulated gluconeogenic genes which contributed to disturbed carbohydrate metabolism.
Activated pentose phosphate pathway and nucleotide biosynthesis in response to PCB 126 exposure in MCD-fed mice
The pentose phosphate pathway is a metabolic pathway parallel to glycolysis. It generates ribose 5-phosphate, which is a precursor for the synthesis of nucleotides. As shown in Figure 3, PCB 126 exposure resulted in increases of ribulose 5-phosphate (4.12-fold) and ribose 1-phosphate (1.54-fold) in MCD mice. Additionally, 5-aminoimidazole-4-carboxamide ribonucleotide (AICAR, 1.45-fold) and inosine 5’-monophosphate (IMP, 71.6-fold), which are major intermediates in the biosynthesis of purine nucleotides, were significantly increased after PCB 126 exposure in MCD-fed mice but not in CD-fed mice. Interestingly, the hepatic level of uric acid was increased in CD mice exposed to PCB 126 in spite of the decreased precursor for purines. Pyrimidine de novo synthesis was also affected by PCB 126 in MCD-fed mice; N-carbamoylaspartate (14.3-fold) and orotate (2.1-fold) are important intermediates in synthesis of uridine monophosphate (UMP, 6.4-fold), which could be further used to produce cytidine monophosphate (CMP, 1.4-fold), all of these four metabolites were increased in the MCD-fed mice after exposure to PCB 126, however there were no significant changes in pyrimidine biosynthesis in CD-fed mice. These results indicate that PCB 126 exposure promoted increased levels of the nucleotide pool in the MCD-fed mice only.
Figure 3. Metabolite changes in response to PCB 126 exposure in the glycolysis, pentose phosphate pathway oxidative branch, and nucleotide biosynthesis.
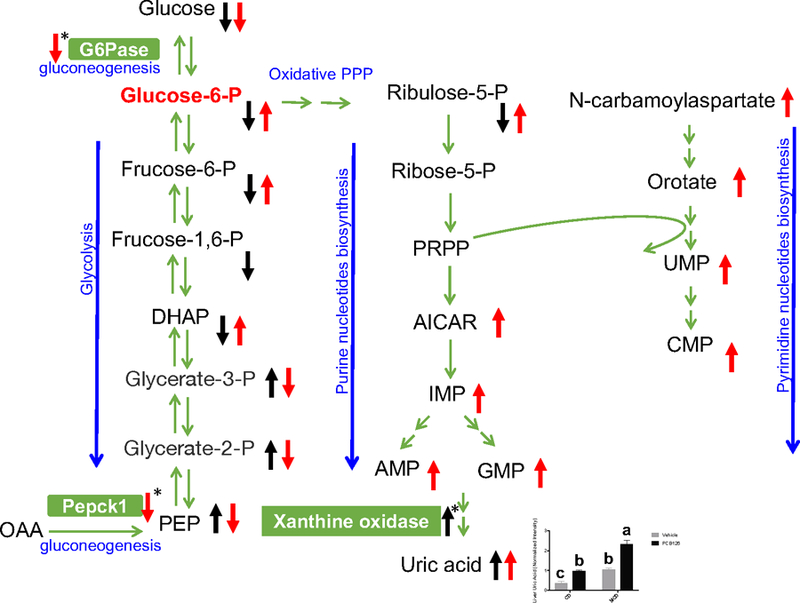
Black arrows: metabolites changes in CD+PCB 126 vs CD groups; red arrows: metabolites changes in MCD+PCB 126 vs MCD groups. Arrows with asterisk indicate hepatic gene expression changes. The bar chart represents the relative levels of uric acid in mice liver. The LC-MS peak area of uric acid was log transformed and normalized with its median value. Bars represent mean ± S.E.M. of six animals in each group. Different subscript letters (a, b, c) indicate statistical significance (p<0.05) by two-way ANOVA analysis. DHAP: dihydroxyacetone phosphate; PRPP: phosphoribosyl pyrophosphate; AICAR: 5-aminoimidazole-4-carboxamide ribonucleotide, IMP: inosine monophosphate, AMP: adenosine monophosphate; GMP: guanosine monophosphate; UMP: uridine monophosphate; CMP: cytidine monophosphate.
PCB 126 exposure exacerbates oxidative stress in MCD-fed mice
Cysteine is an essential substrate for the synthesis of glutathione (GSH) and CoA. Metabolomics study showed that liver cysteine levels were decreased after PCB 126 exposure in both CD- and MCD-fed mice (Figure 4). Correspondingly, reduced levels of GSH and CoA were also observed as a result of PCB 126 exposure. Consistent with the decreased GSH levels, cysteinylglycine, a metabolite derived from GSH hydrolysis, was significantly lower in PCB 126 exposed liver (Figure 4). These results indicate the depletion of thiol metabolites due to PCB 126 exposure.
Figure 4. Metabolism and relative levels of thiol metabolites in mice liver.
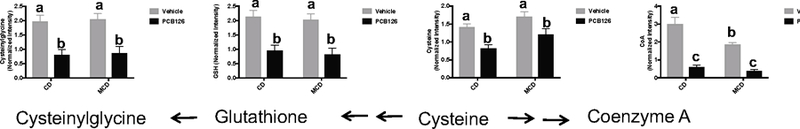
Bars represent mean ± S.E.M. of six animals in each group. The LC-MS peak areas for metabolites were log transformed and normalized with median value. Different subscript letters (a, b, c) indicate statistical significance (p<0.05) by two-way ANOVA analysis.
Liver metabolic profiles showed significant decreases of GSH/glutathione disulfide (GSSG) ratio in PCB 126 treated mice in both CD and MCD groups, which suggests that PCB 126 exposure can increase oxidative stress. 4-Hydroxy-nonenal (4-HNE) is the major lipid aldehyde formed as a consequence of oxidation of ω−6 unsaturated fatty acids in membrane lipids, and is considered as a toxic secondary messenger of oxygen free radicals (Volkel et al., 2005). Due to the reactivity of 4-HNE toward nucleophiles, glutathione conjugate of 4-HNE (HNE-GSH) is served as a marker of cellular 4-HNE exposure, which could represent 50–60% of the 4-HNE derived material in rodent hepatocytes if exogenously challenged with 4-HNE (Hartley et al., 1995). As shown in Figure 5A, increased levels of HNE-GSH in livers of both CD- and MCD-fed mice were observed after PCB 126 exposure. This provides further evidence that PCB 126 could induce redox stress. Bioactive oxidized linoleic acid metabolites and diols of linoleate epoxides have been implicated in oxidative stress and inflammatory disorders. Livers from CD-fed mice had slightly increased 9,10-DiHOME after PCB 126 exposure, while the increase of oxidized fatty acid metabolites was more pronounced in MCD mice in response to PCB 126, with 12,13-DiHOME, 9,10-DiHOME, 14,15-DHET, and 13-HODE/9-HODE being elevated by up to 3-fold compared to the unexposed MCD-fed mice. Compared with the CD mice, the oxidative stress markers were increased in MCD mice (Figure 5A and B), which is a characteristic of the MCD induced liver injury model (Jorgacevic et al., 2014; Machado et al., 2015); importantly PCB 126 exposure exaggerated this effect. These results indicate that PCB 126 can induce and/or worsen MCD-resulted oxidative stress.
Figure 5. Relative levels of redox metabolite markers in mice liver.
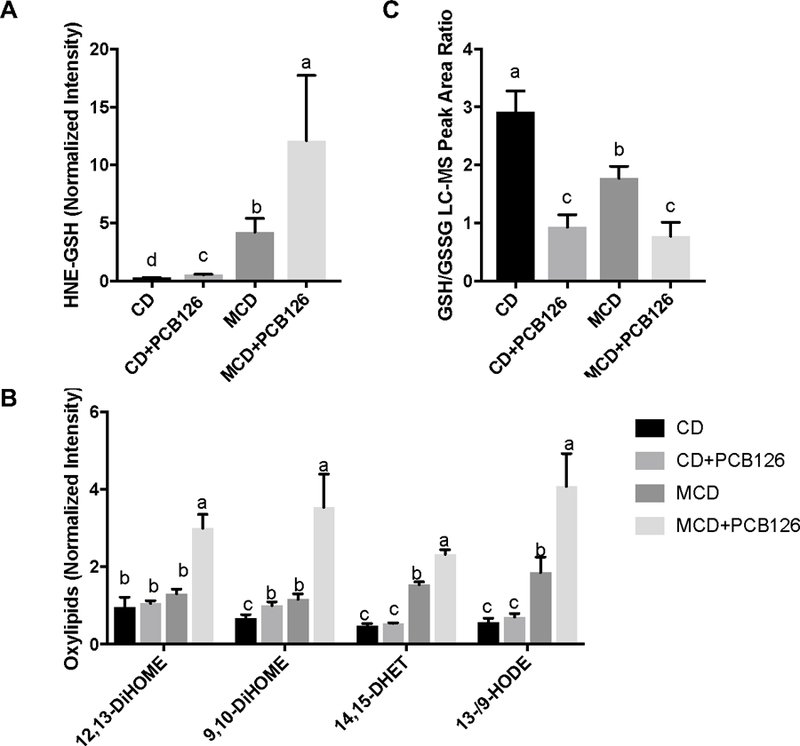
A: HNE-GSH; B: oxylipids; C: the LC-MS peak area ratio of GSH/GSSG. Bars represent mean ± S.E.M. of six animals in each group. The LC-MS peak areas for HNE-GSH and oxylipids were log transformed and normalized with median value. Different subscript letters (a, b, c, d) indicate statistical significance (p<0.05) by two-way ANOVA analysis. 12,13-DiHOME: 12,13-dihydroxy-9Z-octadecenoic acid; 9,10-DiHOME: 9,10-dihydroxy-12Z-octadecenoic acid; 14,15-DHET: 14,15-dihydroxyeicosatrienoic acid; 13-/9-HODE: 13-hydroxyoctadecadienoic acid/9-hydroxyoctadecadienoic acid.
PCB 126 compromises fatty acid β-oxidation in MCD-fed mice
Beta oxidation is the process by which fatty acids are processed progressively to release two-carbon segments in the form of acetyl CoA. Before oxidation, fatty acids have to be activated by linking to CoA in the cytosol, and membrane bound carnitine palmitoyltransferase 1 then exchanges CoA with a carnitine molecule, producing fatty acylcarnitine, which passes the inner mitochondrial membrane into the matrix. Hepatic metabolomic analysis showed that PCB 126 had different effects on acylcarnitine profiles from mice fed with CD and MCD. Main long chain acylcarnitines (carnitine C16:0, C18:0, C18:1, C20:0, and C20:4) were increased in livers of PCB 126-exposed, MCD-fed mice (Figure S1A), indicating possible changes in fatty acid β-oxidation associated with PCB 126 exposure in this particular model. Furthermore, short-chain dicarboxylic acids produced by ω-oxidation were increased in response to PCB 126 exposure, including pimelate, suberate, azelate, and undecanedioate, suggesting an accelerated ω-oxidation (Figure S1B), which is a subsidiary pathway when β-oxidation is blocked (Wanders et al., 2011; Miura, 2013). Notably, accumulated biomarkers of altered β-oxidation and ω-oxidation that were found in the MCD+PCB 126 group were absent in the CD+PCB 126 group (Figure S1).
PCB 126 exposure alters redox-related gene expression
To further determine the mechanism for PCB 126 induced redox stress, the hepatic expression of mRNAs encoding anti-oxidation enzymes was investigated, including GPx1, GSTa1, SOD1, HO1, Grx1, Grx2, and XO/XDH. The results showed that treatment with PCB 126 in CD-fed mice significantly downregulated hepatic mRNA expressions of GPx1, SOD1, HO1, Grx1 and Grx2 (Figure 6). In addition, XO/XDH mRNA was upregulated after PCB 126 exposure in CD-fed mice (Fig. 7A). In liver injury mice, hepatic mRNA expression for GSTa1, SOD1, HO1, Grx1 and Grx2 was downregulated compared with CD-fed mice, and PCB 126 exposure further decreased GSTa1 gene expression. These data suggested that PCB 126 disrupted redox homeostasis through downregulation of anti-oxidative genes.
Figure 6. Effects of PCB 126 on the expression of hepatic genes.
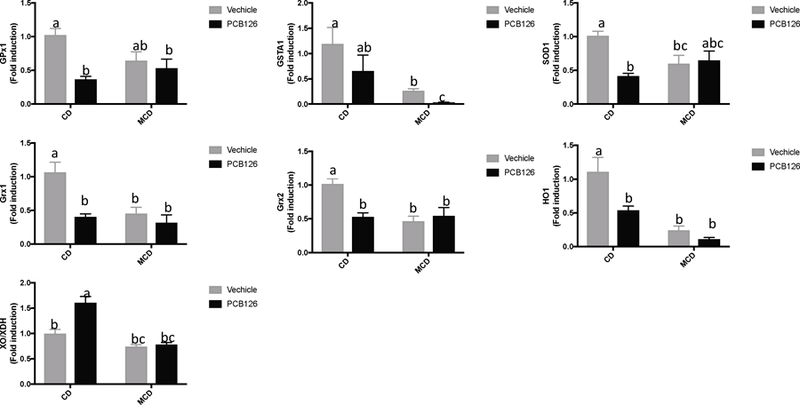
Bars represent mean ± S.E.M. of six samples in each group. Different subscript letters (a, b, c) indicate statistical significance (p<0.05) by two-way ANOVA analysis. CD: control diet fed mice, MCD: methionine choline deficient diet fed mice.
Figure 7. Pathway relationship of major metabolic alterations in CD and MCD diet fed mice after PCB 126 exposure.
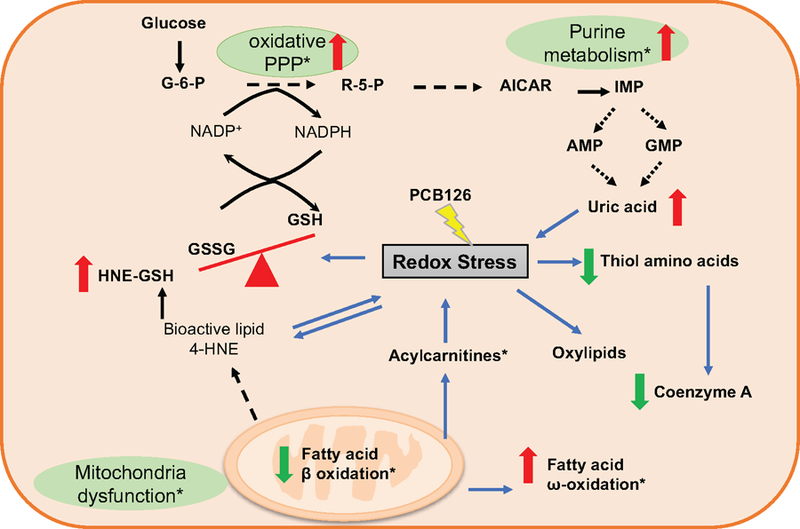
This scheme depicts pathways related to perturbations in pentose phosphate pathway, purine metabolism, fatty acid oxidation, and lipid peroxidation, with a specific emphasis on those linked to redox stress. Metabolites with increased levels are indicated in red and with upward arrows; those with decreased levels are indicated in green and with downward arrows. The metabolites/pathways that changed only in MCD+PCB 126 vs MCD groups are marked with asterisk. See also Table S2 for r
Discussion
We recently demonstrated that exposure to PCB 126 in the presence of liver injury aggravated systemic inflammation by inducing toxicity directly in liver and other organ systems, especially the vascular endothelium. A compelling observation was the drastic increase in inflammatory cytokines and early markers of vascular inflammation in the MCD+PCB 126 mice (Wahlang et al., 2017). Several studies have shown that oxidative stress plays a pivotal role in mediating the production and secretion of cytokines (Naik and Dixit, 2011; Incalza et al., 2018), thus linking ROS with inflammation and endothelial dysfunction. In the present study, liver metabolomic results showed that PCB 126-induced ROS was evident for both CD- and MCD-fed mice, and this could lead to changes in cellular antioxidant defense systems that are mainly composed of thiol metabolites. It is widely recognized that MCD diet can result in significant ROS production and mitochondrial DNA damage (Anstee and Goldin, 2006), which could explain the dramatic increases of lipid peroxidation metabolites observed in MCD group compared to the CD group (Figure 5), and PCB 126 exposure could exacerbate ROS in vivo, as indicated by considerable increases of HNE-GSH and oxylipids compared to the unexposed, MCD-fed mice. These results indicate that ROS was upregulated with PCB 126 exposure as well as with MCD feeding and there were synergistic or additive effects with both, therefore, PCB 126 could promote liver injury by potentiating ROS production.
GSH is a primary cellular antioxidant, and the oxidized form of GSH is GSSG, which is usually formed by reducing organic hydroperoxides and inorganic peroxides. In return, GSSG can be reduced back to GSH in tandem enzymatic action of GSH reductase and NADPH. Therefore, the cycle of GSH/GSSG contributes to the scavenging of reactive species, and the GSH: GSSG ratio is considered as an important indicator of redox balance in cells, with a lower ratio signifying higher oxidative stress (Sentellas et al., 2014). It is interesting that although exposure to PCB 126 resulted in more ROS production in the livers of MCD-fed mice, there was no significant difference in the GSH/GSSG ratio between those two groups after PCB 126 exposure (Figure 5C). The regeneration of GSH from oxidized glutathione (GSSG) requires NADPH. Some cell types can respond rapidly to oxidative stress by activing oxidative pentose phosphate pathway (PPP) to generate NADPH, and recent studies have begun to probe the role of glucose flux through the PPP in response to oxidative stress (Patra and Hay, 2014; Kuehne et al., 2015; Zhang et al., 2016). The PPP is branched from glycolysis at the first committed step, which consumes glucose-6-phosphate (G6P) as a primary substrate. Our previous study showed a decreased liver transcript level of glucose 6-phosphatase in the MCD-fed mice after PCB 126 exposure (Wahlang et al., 2017), and this enzyme is responsible for the hydrolysis of glucose-6-phosphate. This effect might contribute to the increased hepatic level of G6P in the MCD+PCB 126 mice observed in the current study. Comparing the parallel pathways of glycolysis and PPP in MCD groups, it was found that the hepatic level of pyruvate, the output metabolite for glycolysis, remained unchanged after PCB 126 exposure. Pyruvate also acts as a main input for the Krebs cycle, and most of the Krebs cycle metabolites remained unchanged, including alpha-ketoglutarate, succinate, fumarate, citrate, and malate (Supplementary Figure S2). On the contrary, ribulose 5-phosphate, the end product of the oxidative phase of PPP, which could generate two molecules of NADPH, was increased by 4-fold after PCB 126 exposure in the MCD mice. Ribulose 5-phosphate could isomerize to ribose 5-phosphate and fuel nucleotides de novo synthesis. This process is started with activation of ribose 5-phosphate to phosphoribosyl pyrophosphate, and after multiple reactions, AICAR and IMP were produced which are the precursors for adenosine- and guanine-containing nucleotides. Metabolic profiling showed a significant increase of AICAR, IMP, and purines after PCB 126 exposure in MCD-fed mice (Figure 3). Taken together, these results suggest increased glucose flux through the oxidative PPP after PCB 126 exposure in MCD-fed mice. We speculate that the enhanced PPP pathway could promote the production of NADPH in MCD+PCB 126 mice, and therefore facilitate the reduction of GSSG to GSH, which helps to explain why there was no significant difference in the GSH/GSSG ratio between CD+PCB 126 and MCD+PCB 126 despite more ROS generation in the latter group. However, the current approach is limited on readouts of steady-state metabolite levels, therefore the results couldn’t reflect the metabolic fluxes. In the future study, isotopically labelled metabolic tracers will be used, and metabolic pathway kinetics can be measured.
Mitochondria are regarded as the major cellular source for ROS production, and are also an important site for lipid peroxidation (Anderson et al., 2012). Polyunsaturated fatty acids in mitochondrial membranes are primary targets for ROS attack, which results in lipid peroxidation and generation of reactive lipids. When mitochondrial lipids are oxidized, the integrity and function of mitochondria may be compromised, which eventually leads to mitochondrial dysfunction. In the MCD+PCB 126 mice, because of the overproduction of ROS, the levels of oxylipids and 4-HNE was higher than in the other groups, which might cause damage of the mitochondrial membranes. Additionally, the elevation in long chain acylcarnitines in MCD+PCB 126 mice reflects a global disturbance of mitochondrial fatty acid β-oxidation, suggesting an impaired lipid-handling capacity. This is consistent with our previous observed downregulation of β-oxidation hepatic genes (Wahlang et al., 2017). Moreover, both 4-HNE and acylcarnitines could act as secondary toxic messengers, whose accumulation further can promote redox stress and activate proinflammatory signaling pathways (Mali and Palaniyandi, 2014; Rutkowsky et al., 2014). Therefore, mitochondrial dysfunction may contribute to PCB 126 toxicity in the MCD mice, and there is a possibility that the accumulation of 4-HNE and long chain acylcarnitines contribute at least in part to the PCB 126 related peripheral vascular disease risk we observed before by activating proinflammatory signaling pathways (Wahlang et al., 2017).
Uric acid is mainly produced from adenine- and guanine-based purines by the xanthine oxidase pathway. Different mechanisms exist for the elevated hepatic uric acid level in CD- and MCD-fed mice after PCB 126 exposure. With CD, upregulation of xanthine oxidase contributed to the increased hepatic level of uric acid after PCB 126 exposure (Figure 6). With MCD, PCB 126 exposure led to the activation of PPP and the subsequent purine nucleotide biosynthesis, which together finally resulted in the overproduction of uric acid (Figure 3). It has been reported that after uric acid exposure oxidative stress is one of the earliest phenomena observed in vascular, renal, and liver cells (Kang and Ha, 2014), and uric acid could function as an pro-oxidant within the cells (Sautin and Johnson, 2008). Therefore, increased levels of uric acid in the liver could further contribute to the redox stress, and this may be related to the peripheral inflammatory effects that we observed before (Wahlang et al., 2017).
The antioxidant defense system is composed of several antioxidant enzymes that catalyze the metabolism of reactive oxygen species. PCB 126 exposure in CD-fed mice is characterized by downregulated expression of genes involved in antioxidant defense. In the liver injury model induced by the MCD diet, the hepatic transcriptional levels of redox genes were decreased, and after PCB 126 exposure, GSTa1 which encodes a member of a family of enzymes that catalyze glutathione conjugation to electrophilic compounds, was further downregulated (Figure 6). Therefore, decreased antioxidant defenses could play a role in PCB 126 toxicity, and in liver injury mice the antioxidant system could be further impaired after PCB 126 exposure.
The interactions between different pathways are shown in Figure 7. Redox stress is associated with PCB 126 exposure in both CD and MCD diet fed mice. At the metabolite level this was reflected by the decreased GSH/GSSG ratio and depletion of thiol metabolites, including cysteine, glutathione, and CoA. On the other hand, redox stress led to lipid peroxidation, which produced oxylipids and 4-HNE, and in the MCD+PCB 126 mice, the levels of those metabolites were higher than in CD+PCB 126 mice. ROS overload in MCD+PCB 126 mice livers led to mitochondria dysfunction as evidenced by the decreased fatty acid β-oxidation. Meanwhile, fatty acid ω-oxidation was enhanced as a compensatory pathway. In the MCD+PCB 126 mice, the PPP and purine biosynthesis was activated, therefore, promoting the production of uric acid. In contrast, in the CD+PCB 126 mice, the increase of xanthine oxidase gene expression contributed to the increased uric acid in the liver.
It has recently been shown that NAFLD is an independent risk factor for death from cardiovascular disease (CVD). Although the precise mechanism linking NAFLD and CVD is unclear, a systematic review and meta-analysis have shown that oxidative stress may be the key link between NAFLD and CVD (Polimeni et al., 2015). We previously reported that PCB 126 exposure could increase peripheral vascular disease risk using a MCD-induced liver injury mouse model. In the present study, it was found that liver injury mice are more vulnerable to PCB 126 insult and produced higher levels of ROS related metabolites. Additionally, accumulation of bioactive metabolites, including 4-HNE, acylcarnitines, and uric acid could aggravate redox stress, which may mediate inflammatory signal pathways and play a role in the pathogenesis occurring in liver injury mice after exposing to PCB 126. Taken together, these results bridge the gap between liver injury and PCB 126-mediated cardiometabolic disease risks.
In conclusion, PCB 126 exposure induced alterations in metabolic pathways and redox genes in both healthy mice and a MCD diet-induced liver injury mouse model. Interestingly, these effects were more pronounced in liver injury mice, as evidenced by greater depletion of thiol metabolites, increased lipid peroxidation, more metabolites associated with dysfunctional pathways, and further downregulation of GSTa1. Moreover, mitochondrial dysfunction was demonstrated in liver injury mice exposed to PCB 126 by the accumulation of long chain acylcarnitines in the liver. Furthermore, PCB 126-induced increase of bioactive metabolites (4-HNE, uric acid, acylcarnitines) may act as pro-oxidants and contribute to the pathogenesis associated with its exposure. The obtained results using metabolic profiling provide new evidence and clues concerning the toxicological effects of PCB 126 and underline the importance of metabolic disturbance and redox stress in disease risks associated with exposure to environmental pollutants under impaired liver conditions.
Supplementary Material
Acknowledgement
The current study was supported in part by NIEHS/NIH grant P42ES007380.
Abbreviations
- 4-HNE
4-hydroxy-nonenal
- 9,10-DiHOME
9,10-dihydroxy-octadecenoic acid
- 12,13-DiHOME
12,13-dihydroxy-octadecenoic acid
- 13-HODE/9-HODE
13-hydroxyoctadecadienoic acid/9-hydroxyoctadecadienoic acid
- 14,15-DHET
14,15-dihydroxyeicosatrienoic acid
- AICAR
aminoimidazole-4-carboxamide ribonucleotide
- AMP
adenosine monophosphate
- CMP
cytidine monophosphate
- CoA
coenzyme A
- CVD
cardiovascular disease
- G6P
glucose-6-phosphate
- GMP
guanosine monophosphate
- GSH
glutathione
- GSSG
glutathione disulfide
- HNE-GSH
glutathione conjugate of 4-HNE
- IMP
inosine 5′-monophosphate
- KEGG
kyoto encyclopedia of genes and genomes
- MCD
methionine- and choline-deficient diet
- MS
mass spectrometer
- NADPH
dihydronicotinamide-adenine dinucleotide phosphate
- NAFLD
nonalcoholic fatty liver disease
- NASH
nonalcoholic steatohepatitis
- PCB
polychlorinated biphenyl
- PEPCK
phosphoenolpyruvate carboxykinase
- PLS-DA
partial least-squares discriminant analysis
- PPP
pentose phosphate pathway
- QC
quality control
- ROS
reactive oxygen species
- TCDD
2,3,7,8-tetrachlorodibenzo-p-dioxin
- UMP
uridine monophosphate
- UHPLC
ultra high-performance liquid chromatography
Footnotes
Financial interests
Declarations of interest: none.
References
- Abd El-Kader SM, El-Den Ashmawy EM, 2015. Non-alcoholic fatty liver disease: The diagnosis and management. World J Hepatol 7, 846–858. [DOI] [PMC free article] [PubMed] [Google Scholar]
- Anderson EJ, Katunga LA, Willis MS, 2012. Mitochondria as a source and target of lipid peroxidation products in healthy and diseased heart. Clin Exp Pharmacol Physiol 39, 179–193. [DOI] [PMC free article] [PubMed] [Google Scholar]
- Anstee QM, Goldin RD, 2006. Mouse models in non-alcoholic fatty liver disease and steatohepatitis research. Int J Exp Pathol 87, 1–16. [DOI] [PMC free article] [PubMed] [Google Scholar]
- Arciello M, Gori M, Maggio R, Barbaro B, Tarocchi M, Galli A, Balsano C, 2013. Environmental pollution: a tangible risk for NAFLD pathogenesis. Int J Mol Sci 14, 22052–22066. [DOI] [PMC free article] [PubMed] [Google Scholar]
- Boucher MP, Lefebvre C, Chapados NA, 2015. The effects of PCB126 on intra-hepatic mechanisms associated with non alcoholic fatty liver disease. J Diabetes Metab Disord 14, 88. [DOI] [PMC free article] [PubMed] [Google Scholar]
- Cave M, Appana S, Patel M, Falkner KC, McClain CJ, Brock G, 2010. Polychlorinated biphenyls, lead, and mercury are associated with liver disease in American adults: NHANES 2003–2004. Environ Health Perspect 118, 1735–1742. [DOI] [PMC free article] [PubMed] [Google Scholar]
- Chiba T, Suzuki S, Sato Y, Itoh T, Umegaki K, 2016. Evaluation of Methionine Content in a High-Fat and Choline-Deficient Diet on Body Weight Gain and the Development of Non-Alcoholic Steatohepatitis in Mice. PLoS One 11, e0164191. [DOI] [PMC free article] [PubMed] [Google Scholar]
- Clarke JD, Dzierlenga AL, Nelson NR, Li H, Werts S, Goedken MJ, Cherrington NJ, 2015. Mechanism of Altered Metformin Distribution in Nonalcoholic Steatohepatitis. Diabetes 64, 3305–3313. [DOI] [PMC free article] [PubMed] [Google Scholar]
- Crinnion WJ, 2011. Polychlorinated biphenyls: persistent pollutants with immunological, neurological, and endocrinological consequences. Altern Med Rev 16, 5–13. [PubMed] [Google Scholar]
- Duval C, Teixeira-Clerc F, Leblanc AF, Touch S, Emond C, Guerre-Millo M, Lotersztajn S, Barouki R, Aggerbeck M, Coumoul X, 2017. Chronic Exposure to Low Doses of Dioxin Promotes Liver Fibrosis Development in the C57BL/6J Diet-Induced Obesity Mouse Model. Environ Health Perspect 125, 428–436. [DOI] [PMC free article] [PubMed] [Google Scholar]
- Gadupudi GS, Klaren WD, Olivier AK, Klingelhutz AJ, Robertson LW, 2016. PCB126-Induced Disruption in Gluconeogenesis and Fatty Acid Oxidation Precedes Fatty Liver in Male Rats. Toxicol Sci 149, 98–110. [DOI] [PMC free article] [PubMed] [Google Scholar]
- Green RM, Hodges NJ, Chipman JK, O’Donovan MR, Graham M, 2008. Reactive oxygen species from the uncoupling of human cytochrome P450 1B1 may contribute to the carcinogenicity of dioxin-like polychlorinated biphenyls. Mutagenesis 23, 457–463. [DOI] [PubMed] [Google Scholar]
- Hartley DP, Ruth JA, Petersen DR, 1995. The hepatocellular metabolism of 4-hydroxynonenal by alcohol dehydrogenase, aldehyde dehydrogenase, and glutathione S-transferase. Arch Biochem Biophys 316, 197–205. [DOI] [PubMed] [Google Scholar]
- He J, Hu B, Shi X, Weidert ER, Lu P, Xu M, Huang M, Kelley EE, Xie W, 2013. Activation of the aryl hydrocarbon receptor sensitizes mice to nonalcoholic steatohepatitis by deactivating mitochondrial sirtuin deacetylase Sirt3. Mol Cell Biol 33, 2047–2055. [DOI] [PMC free article] [PubMed] [Google Scholar]
- Hennig B, Hammock BD, Slim R, Toborek M, Saraswathi V, Robertson LW, 2002. PCB-induced oxidative stress in endothelial cells: modulation by nutrients. Int J Hyg Environ Health 205, 95–102. [DOI] [PubMed] [Google Scholar]
- Incalza MA, D’Oria R, Natalicchio A, Perrini S, Laviola L, Giorgino F, 2018. Oxidative stress and reactive oxygen species in endothelial dysfunction associated with cardiovascular and metabolic diseases. Vascul Pharmacol 100, 1–19. [DOI] [PubMed] [Google Scholar]
- Jorgacevic B, Mladenovic D, Ninkovic M, Prokic V, Stankovic MN, Aleksic V, Cerovic I, Vukicevic RJ, Vucevic D, Stankovic M, Radosavljevic T, 2014. Dynamics of oxidative/nitrosative stress in mice with methionine-choline-deficient diet-induced nonalcoholic fatty liver disease. Hum Exp Toxicol 33, 701–709. [DOI] [PubMed] [Google Scholar]
- Kang DH, Ha SK, 2014. Uric Acid Puzzle: Dual Role as Anti-oxidantand Pro-oxidant. Electrolyte Blood Press 12, 1–6. [DOI] [PMC free article] [PubMed] [Google Scholar]
- Kania-Korwel I, Wu X, Wang K, Lehmler HJ, 2017. Identification of lipidomic markers of chronic 3,3’,4,4’,5-pentachlorobiphenyl (PCB 126) exposure in the male rat liver. Toxicology 390, 124–134. [DOI] [PMC free article] [PubMed] [Google Scholar]
- Kuehne A, Emmert H, Soehle J, Winnefeld M, Fischer F, Wenck H, Gallinat S, Terstegen L, Lucius R, Hildebrand J, Zamboni N, 2015. Acute Activation of Oxidative Pentose Phosphate Pathway as First-Line Response to Oxidative Stress in Human Skin Cells. Mol Cell 59, 359–371. [DOI] [PubMed] [Google Scholar]
- Li H, Toth E, Cherrington NJ, 2018. Asking the Right Questions With Animal Models: Methionine- and Choline-Deficient Model in Predicting Adverse Drug Reactions in Human NASH. Toxicol Sci 161, 23–33. [DOI] [PMC free article] [PubMed] [Google Scholar]
- Machado MV, Michelotti GA, Xie G, Almeida Pereira T, Boursier J, Bohnic B, Guy CD, Diehl AM, 2015. Mouse models of diet-induced nonalcoholic steatohepatitis reproduce the heterogeneity of the human disease. PLoS One 10, e0127991. [DOI] [PMC free article] [PubMed] [Google Scholar]
- Mali VR, Palaniyandi SS, 2014. Regulation and therapeutic strategies of 4-hydroxy-2-nonenal metabolism in heart disease. Free Radic Res 48, 251–263. [DOI] [PubMed] [Google Scholar]
- Miura Y, 2013. The biological significance of omega-oxidation of fatty acids. Proc Jpn Acad Ser B Phys Biol Sci 89, 370–382. [DOI] [PMC free article] [PubMed] [Google Scholar]
- Naik E, Dixit VM, 2011. Mitochondrial reactive oxygen species drive proinflammatory cytokine production. J Exp Med 208, 417–420. [DOI] [PMC free article] [PubMed] [Google Scholar]
- Park SH, Lim JE, Park H, Jee SH, 2016. Body burden of persistent organic pollutants on hypertension: a meta-analysis. Environ Sci Pollut Res Int 23, 14284–14293. [DOI] [PubMed] [Google Scholar]
- Patra KC, Hay N, 2014. The pentose phosphate pathway and cancer. Trends Biochem Sci 39, 347–354. [DOI] [PMC free article] [PubMed] [Google Scholar]
- Polimeni L, Del Ben M, Baratta F, Perri L, Albanese F, Pastori D, Violi F, Angelico F, 2015. Oxidative stress: New insights on the association of non-alcoholic fatty liver disease and atherosclerosis. World J Hepatol 7, 1325–1336. [DOI] [PMC free article] [PubMed] [Google Scholar]
- Ramadass P, Meerarani P, Toborek M, Robertson LW, Hennig B, 2003. Dietary flavonoids modulate PCB-induced oxidative stress, CYP1A1 induction, and AhR-DNA binding activity in vascular endothelial cells. Toxicol Sci 76, 212–219. [DOI] [PubMed] [Google Scholar]
- Rutkowsky JM, Knotts TA, Ono-Moore KD, McCoin CS, Huang S, Schneider D, Singh S, Adams SH, Hwang DH, 2014. Acylcarnitines activate proinflammatory signaling pathways. Am J Physiol Endocrinol Metab 306, E1378–1387. [DOI] [PMC free article] [PubMed] [Google Scholar]
- Sautin YY, Johnson RJ, 2008. Uric acid: the oxidant-antioxidant paradox. Nucleosides Nucleotides Nucleic Acids 27, 608–619. [DOI] [PMC free article] [PubMed] [Google Scholar]
- Sentellas S, Morales-Ibanez O, Zanuy M, Alberti JJ, 2014. GSSG/GSH ratios in cryopreserved rat and human hepatocytes as a biomarker for drug induced oxidative stress. Toxicol In Vitro 28, 1006–1015. [DOI] [PubMed] [Google Scholar]
- Streba LA, Vere CC, Rogoveanu I, Streba CT, 2015. Nonalcoholic fatty liver disease, metabolic risk factors, and hepatocellular carcinoma: an open question. World J Gastroenterol 21, 4103–4110. [DOI] [PMC free article] [PubMed] [Google Scholar]
- van den Berg RA, Hoefsloot HC, Westerhuis JA, Smilde AK, van der Werf MJ, 2006. Centering, scaling, and transformations: improving the biological information content of metabolomics data. BMC Genomics 7, 142. [DOI] [PMC free article] [PubMed] [Google Scholar]
- Volkel W, Alvarez-Sanchez R, Weick I, Mally A, Dekant W, Pahler A, 2005. Glutathione conjugates of 4-hydroxy-2(E)-nonenal as biomarkers of hepatic oxidative stress-induced lipid peroxidation in rats. Free Radic Biol Med 38, 1526–1536. [DOI] [PubMed] [Google Scholar]
- Wahlang B, Barney J, Thompson B, Wang C, Hamad OM, Hoffman JB, Petriello MC, Morris AJ, Hennig B, 2017. Editor’s Highlight: PCB126 Exposure Increases Risk for Peripheral Vascular Diseases in a Liver Injury Mouse Model. Toxicol Sci 160, 256–267. [DOI] [PMC free article] [PubMed] [Google Scholar]
- Wanders RJ, Komen J, Kemp S, 2011. Fatty acid omega-oxidation as a rescue pathway for fatty acid oxidation disorders in humans. FEBS J 278, 182–194. [DOI] [PubMed] [Google Scholar]
- Wu H, Yu W, Meng F, Mi J, Peng J, Liu J, Zhang X, Hai C, Wang X, 2017. Polychlorinated biphenyls-153 induces metabolic dysfunction through activation of ROS/NF-kappaB signaling via downregulation of HNF1b. Redox Biol 12, 300–310. [DOI] [PMC free article] [PubMed] [Google Scholar]
- Wu X, Yang J, Morisseau C, Robertson LW, Hammock B, Lehmler HJ, 2016. 3,3’,4,4’,5-Pentachlorobiphenyl (PCB 126) Decreases Hepatic and Systemic Ratios of Epoxide to Diol Metabolites of Unsaturated Fatty Acids in Male Rats. Toxicol Sci 152, 309–322. [DOI] [PMC free article] [PubMed] [Google Scholar]
- Yadetie F, Karlsen OA, Eide M, Hogstrand C, Goksoyr A, 2014. Liver transcriptome analysis of Atlantic cod (Gadus morhua) exposed to PCB 153 indicates effects on cell cycle regulation and lipid metabolism. BMC Genomics 15, 481. [DOI] [PMC free article] [PubMed] [Google Scholar]
- Zhang ZZ, Lee EE, Sudderth J, Yue Y, Zia A, Glass D, Deberardinis RJ, Wang RC, 2016. Glutathione Depletion, Pentose Phosphate Pathway Activation, and Hemolysis in Erythrocytes Protecting Cancer Cells from Vitamin C-induced Oxidative Stress. J Biol Chem 291, 22861–22867. [DOI] [PMC free article] [PubMed] [Google Scholar]
Associated Data
This section collects any data citations, data availability statements, or supplementary materials included in this article.