Abstract
Microfluidic-based portable devices for stool analysis are important for detecting established biomarkers for gastrointestinal disorders and understanding the relationship between gut microbiota imbalances and various health conditions, ranging from digestive disorders to neurodegenerative diseases. However, the challenge of processing stool samples in microfluidic devices hinders the development of a standalone platform. Here, we present the first microfluidic chip that can liquefy stool samples via acoustic streaming. With an acoustic transducer actively generating strong micro-vortex streaming, stool samples and buffers in microchannel can be homogenized at a flow rate up to 30 μL min−1. After homogenization, an array of 100 μm wide micropillars can further purify stool samples by filtering out large debris. A favorable biocompatibility was also demonstrated for our acoustofluidic-based stool liquefaction chip by examining bacteria morphology and viability. Moreover, stool samples with different consistencies were liquefied. Our acoustofluidic chip offers a miniaturized, robust, and biocompatible solution for stool sample preparation in a microfluidic environment and can be potentially integrated with stool analysis units for designing portable stool diagnostics platforms.
Introduction
Owing to the fact that stool samples are rich in constituents including bacteria,1 cells,2 biomarkers,3 and viruses,4 processing and analyzing stools is essential to numerous disease diagnoses. For example, stool cultures enable the detection of pathogenic bacteria for diarrheal diseases,5 while stool immunochemical tests contribute to the screening of colorectal cancer.6–8 In addition to conditions directly affecting the digestive tract, researchers have recently linked irregularities in gut microbiota with the risk and progression of neurodegenerative diseases such as Alzheimer’s and Parkinson’s disease.9,10 However, current stool processing and analysis protocols not only require highly trained personnel and advanced instrumentation, but are also labor-intensive and time-consuming, thus limiting patients’ access and lowering medical care efficiency. Additionally, the need for cross-instrumentation operation may lead to severe biohazard risks and operator-dependence can compound detection results.11 Therefore, the development of rapid, reliable, and automated point-of-care (POC) devices for stool processing and analysis is critical for reducing biosafety concerns and improving diagnoses and healthcare.
The unique features of microfluidics, such as miniaturization, biohazard containment, high sensitivity, and reduced reagent consumption, make it excellent candidate for developing POC devices for stool processing and diagnosis.12–32 Previously, microfluidic devices have demonstrated advances in stool analysis, ranging from on-chip detection of antigen33,34 and bacteria,35,36 and on-chip polymerase chain reaction (PCR)37 to molecular analysis of nucleic acids.38,39 Despite these achievements, most microfluidic devices require off-chip stool processing, including vortex mixing for homogenization, and filtration or centrifugation for purification.33–35,37,39 These off-chip requirements severely hinder microfluidics from evolving into next-generation fully automated POC devices, for which integration of stool processing and analysis is imperative. Currently, there are no on-chip methods that can perform stool homogenization and subsequent purification. For traditional microfluidic mixing methods which primarily rely on the design of channel structures,40,41 the absence of external energy and weak mixing make it extremely challenging to liquefy stool samples, considering the large number of macromolecules and non-digested matter in stool.
In this work, we present the first on-chip method that can homogenize and purify complex stool samples. In the homogenization region, with an acoustic transducer actively oscillating sharp-edges in microchannel,42–45 strong micro-vortex streaming can be created to homogenize stool samples and phosphate buffered saline (PBS) at a flow rate of up to 30 μL min−1. In the purification region, an array of 100 μm wide microstructures was designed as a filter to remove large debris. The chip demonstrates comparable biocompatibility to the standard method when considering the bacteria’s integrity, viability, and proliferation ability. Our device’s high bio-compatibility, along with its continuous flow nature, are important for downstream applications that often require intact cells, such as cell culture,46 flow cytometry,47,48 and cell detection.36,49,50 Furthermore, the strong acoustic streaming enables the liquefaction of stool samples with a large range of consistency. With its robust, biocompatible, and versatile nature, our acoustofluidic chip could provide a viable pathway to the adoption of microfluidics in stool research, and could also be integrated with other microfluidic units to expedite the development of portable tools for stool processing and analysis.
Materials and methods
Stool samples
Human stool samples were collected from a volunteer according to a protocol (2019–0115) approved by the Duke University Institutional Review Board. Informed, written consent has been obtained by the volunteer.
Fabrication and operation of acoustofluidic devices
Fig. 1A and B provide a schematic and photo of our sharp-edge-based acoustofluidic device for stool liquefaction, respectively. This acoustofluidic stool liquefier consists of an acoustic transducer, a glass slide, and a single-layer polydimethylsiloxane (PDMS) microchannel. The microchannel with sidewall sharp-edge structures was fabricated using deep reactive ion etching and a replica-molding technique, and then bonded onto a glass slide. Next, an acoustic transducer (AB2720B-LW100-R, PUI Audio, Inc., USA) was bonded onto the same glass slide using a thin epoxy layer (PermaPoxyTM 5 Minute General Purpose, Permatex, USA). The vibrations from the transducer oscillate the sharp edges, and create acoustic micro-vortex streaming which mixes the fluids in the channel. The chip can be segmented into two functional domains: a homogenization region and a filtration region (Fig. 1A and B). The former refers to a serpentine micro-channel section decorated with sharp-edge structures that serve to liquefy stool samples, and act as the surrogate for the standard vortex mixer to produce a homogenous sample (Fig. 1A and S1 in the ESI†); the latter denotes an array of parallel 100 μm wide microchannels that function as an alternative to the standard filter to remove large stool debris (Fig. 1A and S1 in the ESI†).
Fig. 1.
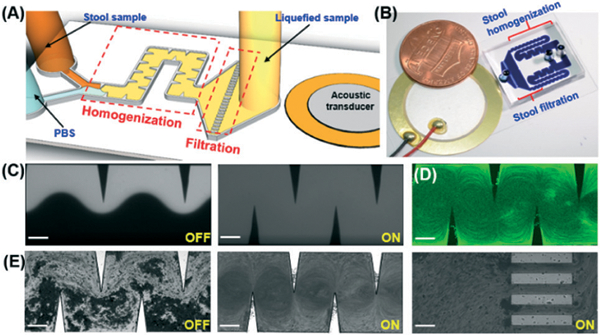
(A) Schematic and (B) photograph of the acoustofluidic-based stool liquefier device. (C) Characterization of high-performance mixing of DI water and fluorescent dye at 40 VPP and a total flow rate of 250 μL min−1 (125 μL min−1 in each parallel channel). With acoustics off (left), a laminar flow was observed and with acoustics on (right), complete mixing was obtained. (D) Characterization of strong acoustic micro-vortex streaming at 40 VPP and a total flow rate of 200 μL min−1 (100 μL min−1 in each parallel channel). (E) The stool liquefaction process was shown as follows: with the acoustics off (left), a laminar flow of stool sample and PBS flowed through the microchannel; with the acoustics on (center), strong acoustic micro-vortex streaming was created to mix stool samples; at the end of the channel (right), an array of 100 μm parallel microchannels designed as filters to remove large debris. Scale bar: 200 μm.
To operate our acoustofluidic device, stool samples were first diluted in sterile PBS (20012–027, Life Technologies, USA) at a concentration of 500 mg ml−1 and incubated at 4 °C for 1 h. After that, stool samples and PBS were co-injected into our acoustofluidic device through two distinct inlets using two 10 mL BD syringes and MicroLine™ tubing (59–8645, 1.3 mm ID and 2.3 mm OD, Harvard Apparatus, USA); the injection process was controlled by a syringe pump (neMESYS, Germany). While the liquids were being injected into the device, the acoustic transducer was activated at a voltage of 40 VPP and a frequency of 4.0 kHz using a signal generated by a function generator (AFG3011, Tektronix, USA) and magnified by an amplifier (25A250A, Amplifier Research, USA). Due to the strong acoustic streaming produced by the sharp edges, stool samples and PBS flows were homogenously mixed as they moved through the “liquefaction region”; the mixture then entered the “filtration region” where it was purified and large debris was removed.
Standard stool liquefaction procedure
In order to provide a benchmark comparison for our acoustofluidic liquefaction device, we also processed samples using a standard method. When reviewing the standard methods for stool liquefaction, we found that stool samples are first diluted in PBS with a concentration range of 50–500 mg ml−1, homogenized via a vortex mixer, and finally filtered or centrifuged for purification.37,51–54 Based on the standard procedure, we conducted the following three-step procedure for comparison to our acoustofluidic method. First, stool samples were diluted in sterile PBS with a concentration of 500 mg ml−1 and then incubated at 4 °C for 1 h (this mirrored the incubation time of the acoustofluidic liquefaction process). Second, 1 min vortex mixing (Generate, VWR, USA) was applied to a mixture of the stool sample and additional PBS that had been added at a 1:1 ratio (v/v), followed by 20 min incubation at room temperature. Third, the processed sample was filtered with a 100 μm sterile filter (22363549, Fisher Scientific Inc., USA) to remove large stool debris.
Morphology characterization
Scanning electron microscopy (SEM) and optical microscopy were used to compare the performance of the two stool liquefaction methods based on debris size. For SEM imaging, the liquefied stool samples were first centrifuged and then re-suspended with a fixative solution. After incubating at 4 °C for 24 h, a drop of stool sample was placed on an aluminum stub coated with a carbon adhesive tab, dried at room temperature, and sputtered with a thin layer of gold.
Bacterial cell culture
Stool culture was performed to evaluate the influence of the liquefaction procedure on the bacteria’s proliferation ability. Culture medium was prepared by dissolving 7.5 mg eosin methylene blue (EMB) agar (70186, Sigma, USA) in 200 mL DI water. After transferring 20 mL culture medium into a 100 × 20 mm culture dish (353003, Falcon, USA), 0.5 μL of the sample was inoculated on an EMB agar plate following a “DUKE” pattern. Samples included the acoustically liquefied stool sample, standard liquefied stool sample, and a control with only PBS. The cultures were incubated aerobically at 37 °C, and bacterial growth was examined at 18 and 36 h, respectively.
Bacterial viability via fluorescence microscope and flow cytometry
To analyze cell viability with a fluorescence microscope, stool samples liquefied using either a standard method or our acoustofluidic device were using a commercial staining kit (Live/Dead BacLight, L7007, Invitrogen, USA). After 15 min incubation in dark at room temperature, a 2 μL drop of each liquefied stool sample was placed on an agarose pad to immobilize the bacterial cells.55 Then, the agarose pad was analyzed using an inverted microscope (Eclipse Ti, Nikon, Japan) equipped with a 100× oil immersion objective.
In order to analyze cell viability with a flow cytometer, the liquefied stool sample was first filtered with a 5 μm filter (7037350, Sterlitech, USA) to isolate bacterial cells and then stained with a Live/Dead BacLight kit (L34856, Invitrogen, USA). After a 15 min incubation, 10 μL of liquefied stool sample was diluted with 987 μL of PBS and then transferred to a 5 mL tube with cell-strainer cap (352235, Falcon, USA) for flow cytometry (BD FACSCanto B, USA). Escherichia coli (E. coli) bacterial cells purchased from ATCC (8793) were cultured in Miller’s LB Broth (20716002, Cellgro, USA) and used for flow cytometry condition setting.
Results and discussion
Visual comparison
Prior to stool liquefaction, the strong acoustic micro-vortex streaming effect, generated by our acoustofluidic device, was characterized. In Fig. 1C, driven at a frequency of 4.0 kHz and an input voltage of 40 VPP, our device was able to completely mix two laminar fluids of DI water and fluorescent dye at a total flow rate of 125 μL min−1 (for each parallel channel, Video S1 in the ESI†). In Fig. 1D, at 4.0 kHz and 40 VPP, clear acoustic streaming patterns were developed at a total flow rate of 100 μL min−1 (for each parallel channel). This complete mixing and clear streaming pattern at a high flow rate demonstrates the capability of our device to create strong acoustic streaming, which endows it with the potential for stool liquefaction. Due to the viscous and inhomogeneous nature of stool samples, to perform stool liquefaction we introduced, stool samples and PBS into our acoustofluidic device at the same flow rate of 15 μL min−1 (total flow rate of 30 μL min−1). Fig. 1E presents the working process of our acoustofluidic stool liquefier. With acoustics off, the stool sample flows adjacent to PBS following a laminar pattern; we noted that some of the large stool debris is able to break the laminar barrier and reach the top of the channel due to its size and inertial effect. With acoustics on, the oscillations of the sharp-edges cause the stool sample to be homogenized with the PBS via strong acoustic streaming in the homogenization region (Video S2 and S3 in the ESI†). At the end of the microchannel (i.e., the filtration region), large debris and highly viscous portions of stool samples were filtered. Once the device was working steadily, a 1.5 mL centrifuge tube was used for collecting the liquefied sample over a 20 min period. Meanwhile, a portion of the same sample was liquefied using the standard procedure (i.e., vortex mixing and a 100 μm sterile filter).
After liquefaction, we first visually compared the raw stool sample and liquefied stool samples. Due to the presence of macromolecules, particulates, and non-digested matters, the non-liquefied stool sample (i.e., the raw stool sample) was cloudy and contained flocculation, as shown in Fig. 2. Both liquefied stool samples have a clearer appearance as a result of uniformly mixing the raw stool sample with PBS. While the acoustofluidically liquefied stool sample appeared similar to the sample liquefied with a vortex mixer, some precipitation at the bottom of the vortex mixed sample was observed; this was ascribed to the presence of large debris and was confirmed with the subsequent SEM observation. We repeated our experiments using independent samples received from the same volunteer at different days, and we observed repeatable performance between our acoustofluidic device and the standard procedure. Moreover, the variation in consistency of stool samples at different days exhibits the capability of our device to liquefy stool samples over a range of consistencies; when measured by a rotary viscometer (NDJ-5S, well join, Amazon, USA), the viscosities of the diluted stool samples was found to range from 32 ± 15 mPa s to 95 ± 21 mPa s, corresponding to the viscosities of stool samples from 1618 ± 328 mPa s to 7285 ± 1008 mPa s. Fig. S2 in the ESI† shows the liquefaction of a stool sample that is watery. When comparing the consistency of stool samples, the amount of debris is a good indicator for the thickness of the sample. The presence of additional debris indicates a thicker sample that is more difficult to liquefy. For example, when comparing the sample in Fig. 2 to that in Fig. S2,† noticeably larger debris can be seen in the sample from Fig. 2, which makes it harder to homogenize via acoustofluidics. Additionally, parameters such as dilution ratio, acoustic intensity, and frequency can be tuned to further ac-commodate the variation in stool sample.
Fig. 2.
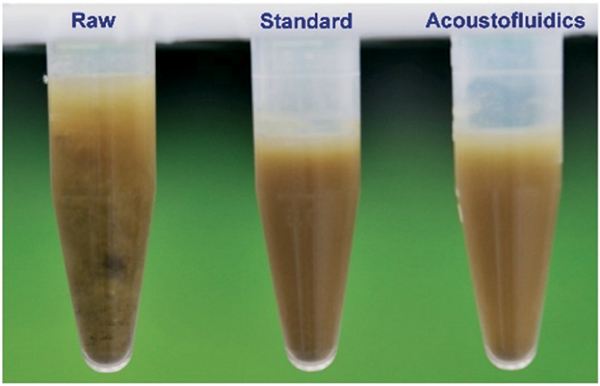
Photo of visual observation of human stool samples: “Raw”: an un-liquefied raw stool sample; “Standard”: a liquefied stool sample processed using the standard method (i.e., vortex mixing and a 100 μm sterile filter); “Acoustofluidics”: a liquefied stool sample prepared using our acoustofluidic device.
Morphology characterization
Next, we used SEM images to examine the morphology of liquefied stool samples and assess the liquefaction performance of our acoustofluidic device. Fig. 3 shows the SEM images of liquefied stool samples at different magnifications. At low magnification (left in Fig. 3), we can see that sample liquefied using a vortex mixer contained many large abiotic impurities; however, samples liquefied with our acoustofluidic device appear to contain overall smaller constituents. This difference can be further clarified by images at high magnification (middle in Fig. 3), where numerous debris in samples liquefied by the standard method is as large as 80 μm but only 40 μm in samples prepared with the acoustofluidic plat-form. At the highest magnification (right in Fig. 3), bacterial cells, which would be analyzed in subsequent analysis, can be found in both samples. It is also encouraging that the rod-shape of the bacteria has been preserved in both methods, revealing negligible detrimental effects of acoustic streaming on bacteria integrity.
Fig. 3.
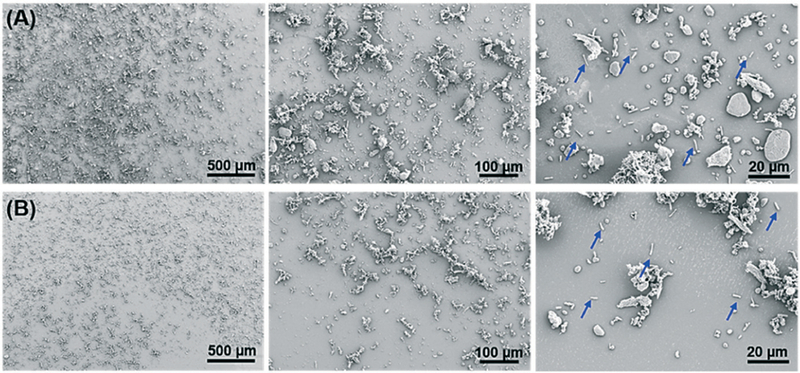
SEM images of liquefied human stool samples prepared using (A) a standard method and (B) our acoustofluidic device. The blue arrows represent rod-shape bacteria.
Bacterial cell culture
Stool culture is one of the most definitive methods for pathogenic bacteria detection in human stool samples, which depends on bacterial cells’ ability to proliferate. Here, cultures of stool samples liquefied by both methods were investigated to compare the influence of liquefaction methods on bacterial proliferation. Considering that E. coli is the most abundant bacteria in a stool sample, the selective culture media, EMB agar, was employed. In Fig. 4, only a slight puncture is observed in the control group (PBS only), while dark core-white shell colonies appear in both liquefied stool samples, suggesting a sterile condition. The whitish shell stems from growth of Gram-negative bacteria incapable of fermenting lactose; and the dark core originates from the propagation of Gram-negative bacteria capable of fermenting lactose, which creates an acidic environment and promotes the conjugation of eosin and methylene blue (Fig. 4B and C at 18 h). Increasing the incubation time from 18 h to 36 h, these colonies have expanded in both liquefied samples, demonstrating favorable bacterial propagation ability in both methods (Fig. 4B and C). We did, however, note that the green metallic sheen, one of the important characteristics of E. coli culture, was not observed. This phenomenon is presumably due to the co-culture of interfering whitish bacteria due to direct inoculation of stool samples on EMB. Similar lack of green metallic sheen has been reported for culture of milk samples56 and culture of E. coli with interference of whitish colonies.57 Overall, these results indicate that our acoustofluidic device is comparable with the standard method in maintaining bacterial cells’ proliferation ability.
Fig. 4.
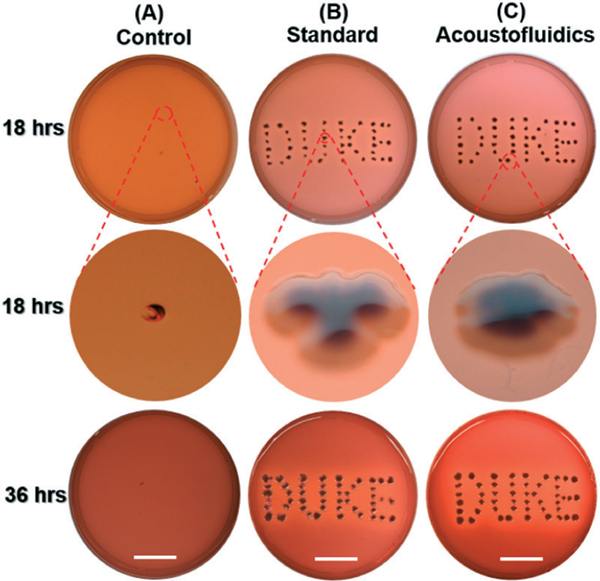
Photo showing bacterial cells inoculated on EMB agar in 100 × 20 mm culture dishes at different incubation times for (A) negative control group (PBS only, without any stool sample), (B) liquefied stool sample prepared using the standard method, and (C) liquefied stool sample processed by our acoustofluidic device. Scale bar: 2.5 cm.
Fluorescence microscope
Certain downstream applications of stool samples require intact live bacteria, such as flow cytometry,47,48 bacteria detection36,49 and culture,46 and therefore microscope analysis was performed to assess bacteria viability. As shown in Fig. 5A–D, both live (green) and dead (red) bacterial cells can be found in liquefied stool samples prepared with either method. To measure the bacteria viability, a Matlab code was written to count the number of live and dead bacterial cells. Comparison of manual counting and Matlab counting for code validation is shown in Fig. S3 in the ESI† and the obtained number of Live/Dead bacteria at different days is displayed in Table S1 in the ESI.† In total, over 2800 bacterial cells were considered for each method. According to Table S1,† the viabilities were estimated, which are 39.2 ± 17.5% and 39.1 ± 10.6% for stool samples liquefied by standard method and our acoustofluidic liquefier, respectively. With a P value > 0.05 in statistics, our acoustofluidic liquefier presents similar capability as the standard method to preserve bacterial cells’ viability.
Fig. 5.
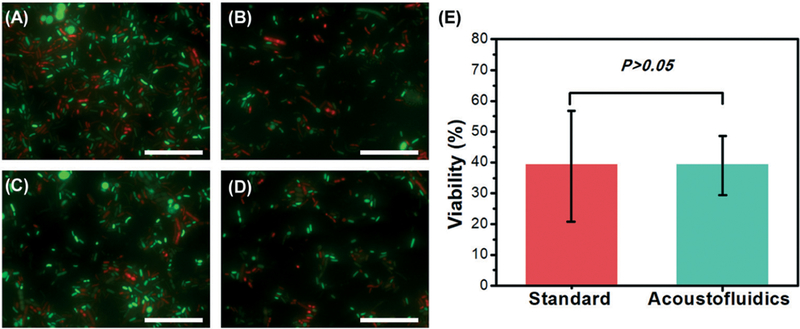
Different fluorescence microscope images (100×) of Live/Dead BacLight stained liquefied stool samples prepared using: (A) and (B) a standard stool-liquefaction procedure; (C) and (D) our acoustofluidic stool liquefier. Green fluorescence represents live bacteria while red fluorescence refers to dead bacteria. (E) Comparison of bacterial cell viability for the two liquefaction methods. For each method, four independent experiments were conducted, and over 2800 bacterial cells were counted. P > 0.05 (ANOVA) represents that no significant difference between the two groups is observed. Scale bar: 50 μm.
Flow cytometry
Flow cytometry, an important analysis method for human stool samples,58 was also utilized to quantitatively characterize the liquefied stool samples. Bacterial cells in liquefied stool samples were stained with Live/Dead bacterial counting BacLight kit. Cultured E. coli cells were first analyzed for setting the measurement condition of flow cytometry. In Fig. S4 in the ESI,† a clear separation and strong correlation coefficient has been demonstrated between live and dead bacteria samples (y = 0.98x – 1.92, R2 = 0.997), indicating an optimal measurement condition. Using these control settings, the bacteria viability in liquefied stool samples was investigated. In both plots of Fig. 6, two different clusters, referring to Live/Dead bacterial cells, can be distinguished, but the distinction between groups is not as clear as cultured E. coli (Fig. S4 in the ESI†). This could be attributed to the complex bacterial constituents in stool samples. Another reason might be due to the presence of bacteria cells at an intermediate state of life/death. In this case, different intracellular stain ratios of SYTO 9 and propidium iodide (PI) occur and therefore some bacterial cells are located in the region between two clusters.59 The percentage of live bacterial cells were 45.1 and 39.1%, for samples produced by the standard procedure and our acoustofluidic device, respectively. This value is consistent with the value obtained from our fluorescence microscope analysis. All the above experiments reveal the biocompatibility and liquefaction capability of our acoustofluidic device for stool samples.
Fig. 6.
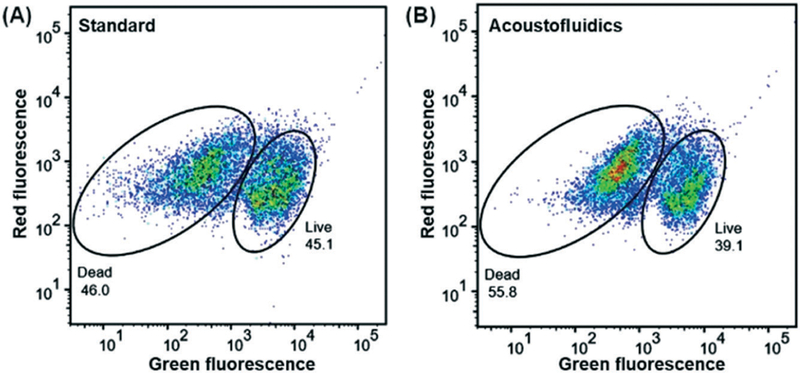
Green fluorescence (SYTO 9) and red fluorescence (PI) plot of the bacterial cells from liquefied stool samples prepared by (A) a standard stool-liquefaction process and (B) our acoustofluidic stool liquefier. SYTO 9, a membrane permeable stain, is employed to identify live bacterial cells while PI, a membrane impermeable stain, is used to identify dead bacterial cells. The percentage of live bacterial cells was 39.1% and 45.1% for (A) and (B), respectively.
Conclusions
We have demonstrated an on-chip stool liquefaction, for the first time, using an acoustofluidic device. With a simple fabrication and operation, stool samples can be homogenized at a throughput of 30 μL min−1 via strong acoustic streaming created by oscillated sharp-edge structures in the acoustofluidic device. Different characterizations show that our acoustofluidic device can not only liquefy stool samples but also preserve the viability, integrity, and proliferation ability of bacterial cells. Moreover, stool samples with different consistencies can be liquefied; this is extremely useful in clinical diagnostics due to large variations in the consistency of stool samples. Additionally, our device’s ability to operate in a continuous manner could provide stool analytes for downstream applications at a consistent pace. With its unique characteristics of robustness, biocompatibility, tunability, automation, and a small footprint, our acoustofluidic stool liquefier is a promising candidate for on-chip stool liquefaction and can be potentially combined with downstream on-chip stool analysis units, expediting the development of POC stool processing and analysis platforms.
Supplementary Material
Acknowledgements
We gratefully acknowledge financial support from the National Institutes of Health (R44HL126441) and the National Science Foundation (IIP-1534645). Shuaiguo Zhao and Zeyu Wang acknowledge the financial support from the China Scholarship Council.
Footnotes
Conflicts of interest
There are no conflicts to declare.
Electronic supplementary information (ESI) available. See DOI: 10.1039/c8lc01310a
References
- 1.Wu GD, Chen J, Hoffmann C, Bittinger K, Chen Y-Y, Keilbaugh SA, Bewtra M, Knights D, Walters WA, Knight R, Sinha R, Gilroy E, Gupta K, Baldassano R, Nessel L, Li H, Bushman FD and Lewis JD, Science, 2011, 334, 105–108. [DOI] [PMC free article] [PubMed] [Google Scholar]
- 2.Koga Y, Yasunaga M, Takahashi A, Kuroda J, Moriya Y, Akasu T, Fujita S, Yamamoto S, Baba H and Matsumura Y, Cancer Prev. Res., 2010, 3, 1435–1442. [DOI] [PubMed] [Google Scholar]
- 3.Takahashi MK, Tan X, Dy AJ, Braff D, Akana RT, Furuta Y, Donghia N, Ananthakrishnan A and Collins JJ, Nat. Commun., 2018, 9, 3347. [DOI] [PMC free article] [PubMed] [Google Scholar]
- 4.Ye S, Whiley DM, Ware RS, Sloots TP, Kirkwood CD, Grimwood K and Lambert SB, J. Med. Virol., 2017, 89, 917–921. [DOI] [PMC free article] [PubMed] [Google Scholar]
- 5.Rossignol J-FA, Ayoub A and Ayers MS, J. Infect. Dis., 2001, 184, 103–106. [DOI] [PubMed] [Google Scholar]
- 6.Gordon NP and Green BB, BMC Public Health, 2015, 15, 546. [DOI] [PMC free article] [PubMed] [Google Scholar]
- 7.Davies RJ, Miller R and Coleman N, Nat. Rev. Cancer, 2005, 5, 199–209. [DOI] [PubMed] [Google Scholar]
- 8.Schaeybroeck SV, Allen WL, Turkington RC and Johnston PG, Nat. Rev. Clin. Oncol., 2011, 8, 222–232. [DOI] [PubMed] [Google Scholar]
- 9.Shoemark DK and Allen SJ, J. Alzheimer’s Dis., 2015, 43, 725–738. [DOI] [PubMed] [Google Scholar]
- 10.Sampson TR, Debelius JW, Thron T, Janssen S, Shastri GG, Ilhan ZE, Challis C, Schretter CE, Rocha S and Gradinaru V, Cell, 2016, 167, 1469–1480. [DOI] [PMC free article] [PubMed] [Google Scholar]
- 11.Gumus A, Ahsan S, Dogan B, Jiang L, Snodgrass R, Gardner A, Lu Z, Simpson K and Erickson D, Biomed. Opt. Express, 2016, 7, 1974–1984. [DOI] [PMC free article] [PubMed] [Google Scholar]
- 12.Chan CY, Huang P-H, Guo F, Ding X, Kapur V, Mai JD, Yuen PK and Huang TJ, Lab Chip, 2013, 13, 4697–4710. [DOI] [PMC free article] [PubMed] [Google Scholar]
- 13.Su W, Gao X, Jiang L and Qin J, J. Chromatogr. A, 2015, 1377, 13–26. [DOI] [PubMed] [Google Scholar]
- 14.Bachman H, Huang P-H, Zhao S, Yang S, Zhang P, Fu H and Huang TJ, Lab Chip, 2018, 18, 433–441. [DOI] [PMC free article] [PubMed] [Google Scholar]
- 15.Huang P-H, Chan CY, Li P, Wang Y, Nama N, Bachman H and Huang TJ, Lab Chip, 2018, 18,1411–1421. [DOI] [PMC free article] [PubMed] [Google Scholar]
- 16.Wu M, Chen K, Yang S, Wang Z, Huang P-H, Mai J, Li Z-Y and Huang TJ, Lab Chip, 2018, 18, 3003–3010. [DOI] [PMC free article] [PubMed] [Google Scholar]
- 17.Song J, Mauk MG, Hackett BA, Cherry S, Bau HH and Liu C, Anal. Chem., 2016, 88, 7289–7294. [DOI] [PMC free article] [PubMed] [Google Scholar]
- 18.Huang P-H, Ren L, Nama N, Li S, Li P, Yao X, Cuento RA, Wei C-H, Chen Y, Xie Y, Nawaz AA, Alevy YG, Holtzman MJ, McCoy JP, Levine SJ and Huang TJ, Lab Chip, 2015, 15, 3125–3131. [DOI] [PMC free article] [PubMed] [Google Scholar]
- 19.Aroonnual A, Janvilisri T, Ounjai P and Chankhamhaengdecha S, Essays Biochem., 2017, 61, 91–101. [DOI] [PubMed] [Google Scholar]
- 20.Ma L, Kim J, Hatzenpichler R, Karymov MA, Hubert N, Hanan IM, Chang EB and Ismagilov RF, Proc. Natl. Acad. Sci. U. S. A., 2014, 111, 9768–9773. [DOI] [PMC free article] [PubMed] [Google Scholar]
- 21.Mauk M, Song J, Bau HH, Gross R, Bushman FD, Collman RG and Liu C, Lab Chip, 2017, 17, 382–394. [DOI] [PMC free article] [PubMed] [Google Scholar]
- 22.Ahmed H, Destgeer G, Park J, Afzal M and Sung HJ, Anal. Chem., 2018, 90, 8546–8552. [DOI] [PubMed] [Google Scholar]
- 23.Connacher W, Zhang N, Huang A, Mei J, Zhang S, Gopesh T and Friend J, Lab Chip, 2018, 18, 1952–1996. [DOI] [PubMed] [Google Scholar]
- 24.Lillehoj PB, Huang M-C, Truong N and Ho C-M, Lab Chip, 2013, 13, 2950–2955. [DOI] [PubMed] [Google Scholar]
- 25.Chen Y, Fang Z, Merritt B, Strack D, Xu J and Lee S, Lab Chip, 2016, 16, 3024–3032. [DOI] [PubMed] [Google Scholar]
- 26.Collins DJ, O’Rorke R, Devendran C, Ma Z, Han J, Neild A and Ai Y, Phys. Rev. Lett., 2018, 120, 074502. [DOI] [PubMed] [Google Scholar]
- 27.Castro C, Rosillo C and Tsutsui H, Microfluid. Nanofluid., 2017, 21, 21. [Google Scholar]
- 28.Gracioso Martins AM, Glass NR, Harrison S, Rezk AR, Porter NA, Carpenter PD, Du Plessis J, Friend JR and Yeo LY, Anal. Chem., 2014, 86, 10812–10819. [DOI] [PubMed] [Google Scholar]
- 29.Ozcelik A, Rufo J, Guo F, Gu Y, Li P, Lata J and Huang TJ, Nat. Methods, 2018, 15, 1021–1028. [DOI] [PMC free article] [PubMed] [Google Scholar]
- 30.Li P and Huang TJ, Anal. Chem., 2019, 91, 757–767. [DOI] [PMC free article] [PubMed] [Google Scholar]
- 31.Zhang SP, Lata J, Chen C, Mai J, Guo F, Tian Z, Ren L, Mao Z, Huang P-H and Li P, Nat. Commun., 2018, 9, 2928. [DOI] [PMC free article] [PubMed] [Google Scholar]
- 32.Wu M, Ouyang Y, Wang Z, Zhang R, Huang P-H, Chen C, Li H, Li P, Quinn D and Dao M, Proc. Natl. Acad. Sci. U. S. A., 2017, 114, 10584–10589. [DOI] [PMC free article] [PubMed] [Google Scholar]
- 33.Yang HR and Seo JK, Dig. Dis. Sci., 2008, 53, 2053–2058. [DOI] [PubMed] [Google Scholar]
- 34.Bunyakul N, Promptmas C and Baeumner AJ, Anal. Bioanal. Chem., 2015, 407, 727–736. [DOI] [PubMed] [Google Scholar]
- 35.Phaneuf CR, Mangadu B, Piccini ME, Singh AK and Koh C-Y, Biosensors, 2016, 6, 49. [DOI] [PMC free article] [PubMed] [Google Scholar]
- 36.Kim G, Moon J-H, Moh C-Y and Lim J-G, Biosens. Bioelectron., 2015, 67, 243–247. [DOI] [PubMed] [Google Scholar]
- 37.Li Y, Zhang C and Xing D, Anal. Biochem., 2011, 415, 87–96. [DOI] [PubMed] [Google Scholar]
- 38.Mosley O, Melling L, Tarn MD, Kemp C, Esfahani MM, Pamme N and Shaw KJ, Lab Chip, 2016, 16, 2108–2115. [DOI] [PubMed] [Google Scholar]
- 39.Zhang H, Wang X, Ma Q, Zhou Z and Fang J, Lab. Invest., 2011, 91, 788–798. [DOI] [PubMed] [Google Scholar]
- 40.Lee C-Y, Wang W-T, Liu C-C and Fu L-M, Chem. Eng. J., 2016, 288, 146–160. [Google Scholar]
- 41.Bhagat AAS, Peterson ET and Papautsky I, J. Micromech. Microeng., 2007, 17, 1017–1024. [Google Scholar]
- 42.Huang P-H, Xie Y, Ahmed D, Rufo J, Nama N, Chen Y, Chan CY and Huang TJ, Lab Chip, 2013, 13, 3847–3852. [DOI] [PMC free article] [PubMed] [Google Scholar]
- 43.Huang P-H, Nama N, Mao Z, Li P, Rufo J, Chen Y, Xie Y, Wei C-H, Wang L and Huang TJ, Lab Chip, 2014, 14, 4319–4323. [DOI] [PMC free article] [PubMed] [Google Scholar]
- 44.Huang P-H, Chan CY, Li P, Nama N, Xie Y, Wei C-H, Chen Y, Ahmed D and Huang TJ, Lab Chip, 2015, 15, 4166–4176. [DOI] [PMC free article] [PubMed] [Google Scholar]
- 45.Nama N, Huang P-H, Huang TJ and Costanzo F, Lab Chip, 2014, 14, 2824–2836. [DOI] [PMC free article] [PubMed] [Google Scholar]
- 46.Cui X, Ren L, Shan Y, Wang X, Yang Z, Li C, Xu J and Ma B, Analyst, 2018, 143, 3309–3316. [DOI] [PubMed] [Google Scholar]
- 47.Ren L, Yang S, Zhang P, Qu Z, Mao Z, Huang PH, Chen Y, Wu M, Wang L, Li P and Huang TJ, Small, 2018, 14, 1801996. [DOI] [PMC free article] [PubMed] [Google Scholar]
- 48.Utharala R, Tseng Q, Furlong EE and Merten CA, Anal. Chem., 2018, 90, 5982–5988. [DOI] [PubMed] [Google Scholar]
- 49.Jang S, Lee B, Jeong H-H, Jin SH, Jang S, Kim SG, Jung GY and Lee C-S, Lab Chip, 2016, 16, 1909–1916. [DOI] [PubMed] [Google Scholar]
- 50.Lillehoj PB, Kaplan CW, He J, Shi W and Ho C-M, J. Lab. Autom., 2014, 19, 42–49. [DOI] [PubMed] [Google Scholar]
- 51.Gratton J, Phetcharaburanin J, Mullish BH, Williams HR, Thursz M, Nicholson JK, Holmes E, Marchesi JR and Li JV, Anal. Chem., 2016, 88, 4661–4668. [DOI] [PubMed] [Google Scholar]
- 52.Gillers S, Atkinson CD, Bartoo AC, Mahalanabis M, Boylan MO, Schwartz JH, Klapperich C and Singh SK, J. Microbiol. Methods, 2009, 78, 203–207. [DOI] [PMC free article] [PubMed] [Google Scholar]
- 53.Periago MV, Diniz RC, Pinto SA, Yakovleva A, Correa-Oliveira R, Diemert DJ and Bethony JM, PLoS Neglected Trop. Dis., 2015, 9, e0003967. [DOI] [PMC free article] [PubMed] [Google Scholar]
- 54.Riglar DT, Giessen TW, Baym M, Kerns SJ, Niederhuber MJ, Bronson RT, Kotula JW, Gerber GK, Way JC and Silver PA, Nat. Biotechnol., 2017, 35, 653–658. [DOI] [PMC free article] [PubMed] [Google Scholar]
- 55.Skinner SO, Sepulveda LA, Xu H and Golding I, Nat. Protoc., 2013, 8, 1100–1113. [DOI] [PMC free article] [PubMed] [Google Scholar]
- 56.Leininger DJ, Roberson JR and Elvinger F, J. Vet. Diagn. Invest., 2001, 13, 273–275. [DOI] [PubMed] [Google Scholar]
- 57.Antony AC, Paul MK, Silvester R, Aneesa P, Suresh K, Divya P, Paul S, Fathima P and Abdulla MH, J. Pure Appl. Microbiol., 2016, 10, 2863–2871. [Google Scholar]
- 58.Rollenske T, Szijarto V, Lukasiewicz J, Guachalla LM, Stojkovic K, Hartl K, Stulik L, Kocher S, Lasitschka F, Al-Saeedi M, Schroder-Braunstein J, Frankenberg M, Gaebelein G, Hoffmann P, Klein S, Heeg K, Nagy E, Nagy G and Wardemann H, Nat. Immunol., 2018, 19, 617–624. [DOI] [PubMed] [Google Scholar]
- 59.Berney M, Hammes F, Bosshard F, Weilenmann H-U and Egli T, Appl. Environ. Microbiol., 2007, 73, 3283–3290. [DOI] [PMC free article] [PubMed] [Google Scholar]
Associated Data
This section collects any data citations, data availability statements, or supplementary materials included in this article.


