Abstract
Childhood vaccination programs are considered one of the most beneficial public health programs in modern history. In the United States, the increasing use of non-medical exemptions (NMEs) from school entry vaccination requirements has garnered attention and scrutiny in the popular press, academic literature, and policy forums. In 2016, California law SB277 goes into effect, eliminating the NME option for students attending the state’s public and private schools. Whereas SB277 is a strong move to increase vaccination coverage within California’s schools, the new law contains an important caveat– students already having a valid NME (obtained prior to the 2016 school year) are “grandfathered” in until their next grade checkpoint (seventh grade). Although no new students will enter the California school system with a NME after 2016, the law’s grandfather clause will allow NMEs to persist within the state school system until 2022. This analysis demonstrates how the past “build up” of students with pre-SB277 NMEs and the law’s grandfather clause will act in combination to affect NME rates across the state after the implementation of SB277. We construct spatially explicit, yearly models of all students (K-12) enrolled in the California school system from 2011–2022. Our analysis finds that, although all regions of the state will eventually reach an NME rate of 0% by 2022, SB277’s effect will be highly spatially and temporally variable. Some school districts will continue to experience elevated NME rates and increased risk of disease outbreak for years after SB277 is implemented. Our analysis highlights the potential spatially variant consequences of SB277’s grandfather clause, providing important information for other states considering similar policy initiatives.
Keywords: vaccines, vaccination, immunization, exemptions, non-medical exemptions, SB277
1. Introduction
In the United States, large-scale childhood vaccination programs have virtually eliminated numerous childhood diseases. Yet, despite the historically proven success of these programs in the US, vaccine uptake levels for children have fluctuated considerably over the past 10–15 years and have decreased substantially in some states (Yang and Debold, 2014). Although all 50 states and the District of Colombia require proof of vaccination for a child to attend school or day care, each has authority to implement their own policies regarding vaccination. All states allow for children to obtain a medical exemption (ME) from vaccination for documented reasons, including, but not limited to, a compromised immune system, prior adverse reactions to vaccination, and allergies to vaccine contents. Some states provide a non-medical exemption (NME) option, which allows for parents to choose exemption based on their religious, personal, or philosophical beliefs (Yang and Silverman, 2015).
Recently in the US, NME use has increased (Omer et al., 2012) and is recognized as a growing problem in both the popular press and scientific literature (Dempsey et al., 2011; Hayes, 2015; Hughes, 2006; Omer et al., 2006; Park, 2008). A common and persistent concern among parents choosing an NME is vaccine safety and the belief that vaccines harm the health of the child and cause adverse reactions or developmental problems such as autism (Wang et al., 2014). In the US, high NME use has consistently been associated with White parents or communities, as well as those with higher socioeconomic status (e.g., Carrel and Bitterman, 2015; Wang et al., 2014; Yang et al., 2016). Further, higher NME rates are found in states with less restrictive policies and procedures for parents to secure or file an exemption (Wang et al., 2014).
Recent outbreaks of measles (CDC, 2016) and pertussis (CDC, 2015) in the US highlight the potential repercussions of increased use of NMEs and corresponding reduction in vaccine coverage in school-age children. Throughout the US, the availability and use of exemptions from school-entry vaccine mandates has become a highly contested political and social issue as rumors continue to spread that some vaccines, or a mercury vaccine preservative, cause autism, even though numerous studies have shown no link between autism and either vaccines or the preservative (Wang et al., 2014). Anti-vaccine advocates, partly fueled by celebrities and other high-profile spokespeople, seek greater rights to refuse vaccination and place childhood vaccinations in an impassioned debate. The issue has also surfaced in state legislatures around the US, as numerous states have recently considered legislation to modify their existing NME policies, which include initiatives aimed at both loosening and tightening parents’ abilities to acquire an exemption for their child (Cawkwell and Oshinsky, 2015; Lillvis et al., 2014; Omer et al., 2014; Yang et al., 2015).
In 2012 and 2015, California (CA) passed new laws in an effort to reduce the number students with NMEs in the state’s school system. In CA, NMEs include those based on parents’ personal beliefs (PBE) or religious beliefs (RBE) and may include exemption from some or all required vaccinations. The first law, CA state bill AB2109, went into effect prior to the 2014–2015 school year and required parents to provide proof that they had received counseling from a health care provider prior to obtaining a valid PBE; parents claiming an RBE did not require counseling, nor did parents having already obtained a pre-AB2109 PBE (AB 2109, 2012). The second law, state bill SB277, eliminates the NME provision (both the PBE and RBE provisions) for students entering CA schools (SB 277, 2015). When SB277 is fully implemented in the 2016–2017 school year, only the ME provision remains, which requires a written waiver from a licensed physician. California will become the third state, joining Mississippi and West Virginia, to prohibit any exemptions from school entry vaccination mandates except those deemed medically necessary.
SB277 is a substantial policy shift that will eliminate NMEs in CA schools. However, there are only two vaccination checkpoints in California: kindergarten and seventh grade. Under the new law, students possessing a valid pre-SB277 NME (acquired prior to the 2016 school year) are “grandfathered” in and may continue attending school until they reach their next vaccination grade checkpoint (seventh grade). The law does not affect CA students in grades 8–12 with a pre-SB77 NME. Additionally, SB277 allows students with an existing NME to transfer among schools and keep their NME, unless entering seventh grade. SB277’s “grandfather clause” was offered as a legislative compromise (“Bill History,” n.d.), presumably, to increase the chance of the law’s passage by appeasing vaccine-hesitant parents’ concerns over vaccine safety and parental rights. However, because of this grandfather clause in SB277, the full benefits of the new law will not be realized until 2022, as students having current NMEs will be allowed to remain within the CA school system into the near future (Anonymous, 2016).
The implementation of AB2109 in 2014 and pending implementation of SB277 appear to have had the desired effect on NMEs for incoming CA kindergarteners and seventh graders, as the NME percent for incoming kindergarteners fell from a high mark of 3.15% in 2013 to 2.47% in 2015 (see Figure 1). For seventh graders, the NME percent fell from 3.26% in 2013 to 1.66% in 2015. Yet, despite the recent declines in NMEs, Figure 1 illustrates why SB277’s overall effect will be a gradual decline in NMEs, when considering the NME rate for entire school system. Specifically, this is due to the large number of students that have already entered the CA school system with a pre-SB277 NME and SB277’s grandfather clause, which allows these unvaccinated students to continue attending school. Anonymous (2016) predicted the statewide temporal effects of SB277, finding that the overall NME rate in CA schools will remain greater than 2% of all enrolled students until the 2017 school year and greater than 1% until the 2019 school year.
Figure 1. NME percent for incoming kindergarteners in CA, 1996–2016.
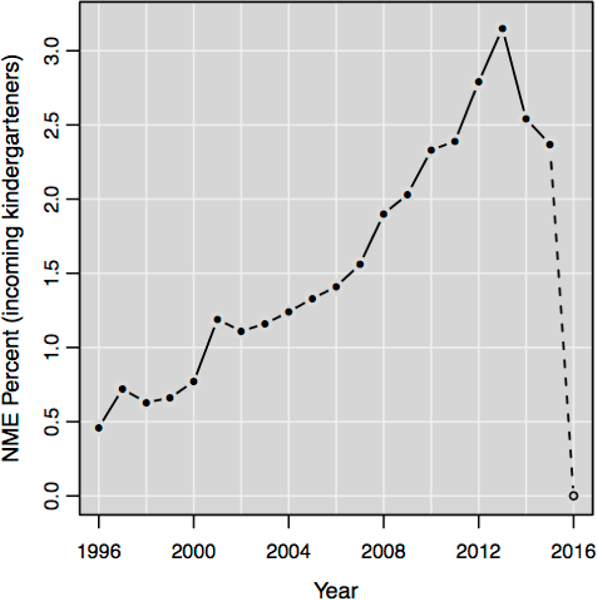
The 0% NME rate in 2016 is the expected result of the full implementation of SB277.
Calculating the impact of SB277 for the entire state of CA provides an overall understanding of the broad-scale temporal changes that will occur in NMEs and vaccine coverage due to the new law. However, vaccine-and exemption-related behavior has been shown to be highly spatially variable at a local (or community) scale within states or larger geographic regions both in CA (Atwell et al., 2013; Carrel and Bitterman, 2015; Delamater et al., 2016; Lieu et al., 2015; Yang et al., 2016) as well as other US states (Birnbaum et al., 2013; Omer et al., 2008;). Importantly, when a community has a high rate of vaccine coverage, they achieve the “herd immunity” effect, which indirectly protects susceptible members of the population from contracting vaccine-preventable diseases (VPD) via a decreased likelihood of a transmission occurring between infectious and susceptible individuals (Ali et al., 2005; Fine, 1993). The herd immunity threshold is the critical proportion of the population having immunity from a disease for that population to gain herd immunity (Fine, 1993). The particular threshold value is variable among VPDs and is a function of the disease’s transmissibility and infectivity, as well as the contact rate within a population (which are summarized in the disease’s basic reproduction number, R0).
Scenarios in which a large number of unvaccinated people reside and interact within a contiguous geographic region or cluster are especially concerning (May and Silverman, 2003). In these clusters, the probability of contact among vaccinated and unvaccinated individuals is elevated, which increases the risk of disease transmission. High NME rates in schools and corresponding reductions in vaccine coverage rates have the potential to threaten a community’s herd immunity and increase the risk of a disease outbreak (Wang et al., 2014). In CA, the noted spatial variation in vaccine-and exemption-related behavior manifests in localized geographic clusters of schools or communities where herd immunity may be threatened. Schools are notable in this scenario because they provide a densely-populated location where numerous children regularly come into contact and interact with one another. Past research has demonstrated the link between high NME rates in schools and a higher risk for outbreaks of common VPDs, such as measles and pertussis, in Colorado (Feikin et al., 2000), Michigan (Omer et al., 2008), and California (Atwell et al., 2013).
Investigating the effects of SB277’s grandfather clause at the statewide level of aggregation may conceal important local variations in NMEs rates and disease outbreak risk as the new law goes into effect and NMEs are filtered out of the California’s school system. In this research, we examine the spatiotemporal outcomes of SB277 by estimating how the law will affect NMEs at a community level. To capture the effects of SB277’s grandfather clause, we consider NMEs for all students in CA schools (K-12). Thus, we perform the analysis at the secondary school district level of aggregation. Specifically, we aim to show how the past “build up” of students with pre-SB277 NMEs and the law’s grandfather clause act in combination to differentially affect future NME rates across the state, even though all schools fall under the same new policy. We evaluate school district-level NME rates between 2011–2022 to highlight communities in which elevated NME rates and, potentially, VPD outbreak risk will persist into the near future.
2. Methods
2.1. Input data and preprocessing
School-level vaccination exemption and enrollment data were acquired from the CA Department of Public Health (https://www.cdph.ca.gov/programs/immunize/) for students entering kindergarten (2005–2015), students entering seventh grade (2012–2014), and students entering grades 7–12 (2011) for CA public and private schools. All schools with 10 or more students entering the respective grade were included in these datasets. For each school, the number of students with an NME was calculated by summing the students with a PBE or RBE. The yearly mean number of schools and students in the kindergarten data were 7,190 and 513,760, respectively. For the seventh grade data, the yearly mean number of schools and students were 3,490 and 492,910. The 2011 7–12 data contained information for 3,057,974 students in 6,015 schools.
Geographic reference information for CA schools was acquired from the CA Department of Education’s school directory files (http://www.cde.ca.gov/ds/si/ds/) and linked to the exemption and enrollment data via a unique school identifier code. The public school directory file contains an historic record of the state’s public schools (1980-) and roughly 65% of the 15,679 schools in this directory contain geographic coordinates for the school location. For roughly 96% of the public schools in the yearly exemption data, the geographic coordinates were available directly from the directory file. The remaining 4% of the public schools were geocoded using school address information from the directory file or a manual search and Google’s geocoding API. Private schools were assigned geographic coordinates by geocoding their address information from the private school directory files or a manual search using Google’s geocoding API. Overall, 99.46% of all the schools in the exemption and enrollment data were successfully geocoded, ranging from a low of 98.59% (2005 kindergarten data) to 100% (2013 kindergarten data and 2012 seventh grade data).
County-level observed and projected enrollment data for kindergarteners entering CA public schools in 2014–2022 were acquired from the CA Department of Finance (http://www.dof.ca.gov/research/demographic/reports/projections/k-12/). Because these data only include public school student enrollment and were aggregated to the county level, the raw enrollment values were not suitable for our analysis without further processing. To create a useable dataset, for each year between 2016–2022, the county-level raw kindergarten enrollment data were converted to percent change values, based on changes from the 2014 enrollment. The projected data for 2015 were not calculated because the observed enrollment information was already available in the 2015 exemption dataset. The 2014 data were used as the base year in the percent change calculation because 2014 was the last year of observed data in the dataset. This approach allowed us to capture the overall nature of the projected future variations in yearly kindergarten enrollment throughout the state.
Spatial data layers for CA counties and 2015 school districts were downloaded from the US Census TIGER website (https://www.census.gov/geo/maps-data/data/tiger-line.html). The school district data are subdivided into separate elementary, secondary, and unified school district layers. Elementary school districts generally define regions for grades K-8 attendance and largely nest within secondary school districts, which define regions for grades 9–12 attendance. Unified school districts define regions for grades K-12, thus function similar to secondary districts. Because our analysis considers NMEs for all students (K-12) in the school system, secondary school districts provided the most appropriate aggregation unit. An amalgamated spatial data layer was constructed from the 3 school district layers such that all regions of CA were assigned only a single, terminal secondary school district (n=484). The final secondary school district layer included 341 unified, 112 secondary, and 31 elementary school (which were confirmed as serving grades K-12 via the attribute data) districts, accounting for all populated regions of the state.
The geocoded school-level exemption and enrollment data layers were spatially joined to both the county layer and secondary school district layer for further processing and analysis. To calculate the predicted school-level kindergarten enrollment values for 2016–2022, the observed 2014 school-level enrollment values were multiplied by the predicted percent change for the county in which the school was located. After this step, the school-level exemption and enrollment data were aggregated (summed) by school districts for further analysis.
2.2. Construction of yearly student cohorts
To calculate the K-12 student enrollment and number of students with NMEs for CA school districts for the 2011–2015 school years, we combined kindergarten data from 2005–2015, 7–12 grade data from 2011, and seventh grade data from 2012–2014. The yearly data were used to construct a set of grade-specific cohort groups that advanced year-to-year through the system (e.g., kindergarteners in 2007 would be sixth graders in 2014). To construct the grade cohorts for 2016–2022, we employed the same approach, with the predicted kindergarten enrollment data for 2016–2022 replacing the observed data from previous years. To account for the elimination of the NME option as a result of SB277, the number of NMEs was set to 0 for all students entering kindergarten or seventh grade from 2016 forward. Our approach assumes that all CA students will advance to the next grade on time and that students possessing a pre-SB277 NME will remain exempted from one or more required vaccinations. Figures 2 and 3 illustrate the approach used to construct the 2011–2022 student cohorts for enrollment and NMEs, respectively, in each school district.
Figure 2. Data used to construct enrollment cohorts, 2011–2022.
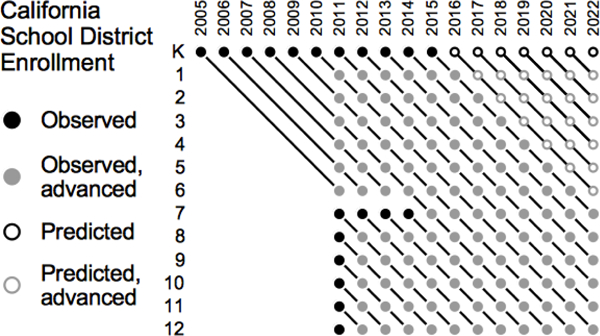
The enrollment in each grade cohort group were taken from observed data for 2005–2015 (kindergarteners), 2012–2014 (seventh graders), and 2011 (grades 7–12). 2016–2022 kindergarten enrollment data were based on the predicted change information.
Figure 3. Data used to construct NME count cohorts, 2011–2022.
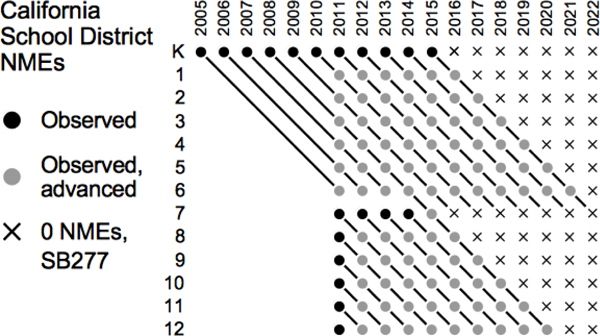
The observed number of NMEs in each grade cohort group were taken from observed data for 2005–2015 (kindergarteners), 2012–2014 (seventh graders), 2011 (grades 7–12), and set to 0 for all students entering kindergarten and seventh grade from 2016–2022.
After constructing the grade-specific cohorts, the K-12 enrollment and NMEs were summed for each year, which provided the total enrollment and NME count for each school district. The count data were then used to calculate the yearly NME percent for all students in a particular school district, for 2011–2022. We calculated the yearly enrollment density for each school district by dividing the total number of students by the geographic area of the district; this provided an estimate of the probability of contact among students within each school district. Additionally, we stratified the grade-specific cohort data by school “types”, representing elementary (grades K-5), junior high (grades 6–8), and high (grades 9–12) schools. These particular grade spans are the most common for schools in each school type in CA (CalEdFacts, n.d.), thus providing a suitable stratification scheme.
Because yearly enrollment and NME data were suppressed for schools with fewer than 10 incoming kindergarteners or seventh graders, a full K-12 cohort could not be constructed for some small school districts during the study period. As a result, the year-to-year variation in NME rates for these low enrollment school districts was extremely unstable. Thus, for the school district analysis, we removed school districts having more than 4 (of 13) grades missing from their K-12 student cohort, which resulted in the removal of between 20–28 school districts per year.
2.3. Spatial Analysis
The yearly NME percent data were attached to the school district spatial data layer for mapping and analysis. We examined the exemption rate data for global and local spatial autocorrelation using Moran’s I and LISA, respectively (Anselin, 1995). Because the school district polygons were the units of analysis, spatial neighbors were defined using first order queen contiguity and were row standardized, as there were an inconsistent number of neighbors among observations (Anselin, 2002). All data processing and analysis was performed in R, while all GIS-related tasks were performed in ArcGIS 10.3.
3. Results
The change in NME percent for incoming kindergarteners from 2013 to 2014 and from 2014 to 2015 is mapped in Figure 4. Although the overall statewide NME percent in CA fell by 0.61% and 0.17% from 2013 to 2014 and 2014 to 2015, respectively, the maps show that these changes were not homogeneous across the state. In a number of school districts, the change in NME percent across these years was relatively minor, only fluctuating between −1% and 1% from year to year as AB2109 went into effect. However, as the maps also show, the change in NME percent was geographically variable across the state, with some school districts having large increases, large decreases, and mixed change over the previous two years. The Moran’s I results show that change in NME percent was very slightly clustered in 2013–2014 (I = 0.064, p = 0.025) and randomly distributed in 2014–2015 (I = 0.005, p = 0.906). The LISA results were largely uninteresting for both time periods. For 2013–2014, a small number of school districts were identified as having significant local clustering of high and low change percent values or as being outlier values, but these regions are generally identifiable in Figure 4(A). No significant clustering or outlier school districts were identified for change in NME percent for 2014–2015.
Figure 4.
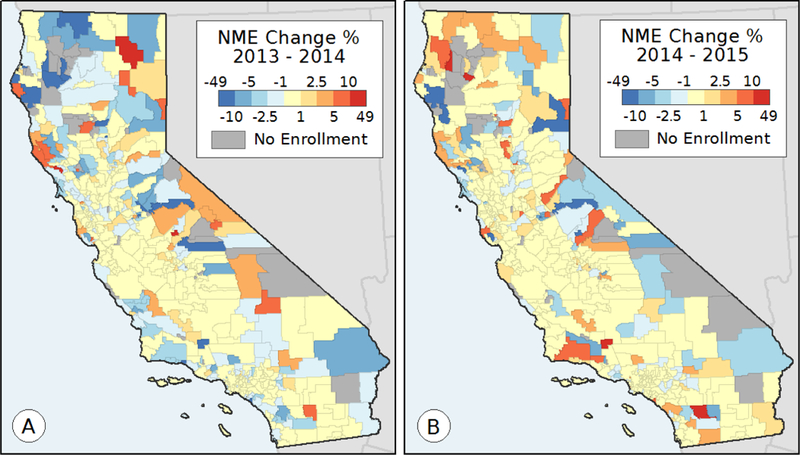
Change in NME percent (raw) for incoming kindergarteners from previous year for (A) 2013–2014 and (B) 2014–2015.
The statewide NME percent for all CA students, as well as the NME percent for students in elementary, junior high, and high schools, are plotted for years 2011–2022 in Figure 5(A). Notably, even though the NME percent for incoming kindergarteners and seventh graders has decreased from the peak in 2013, the overall statewide rate continued to rise in 2014 and 2015 due to the large number of students with NMEs already within the school system. The breakdown of NME percent by school type in Figure 5(A) shows that NMEs are not distributed similarly throughout student cohorts in CA.
Figure 5. (A) NME percent in CA schools, 2011–2022, for all students [solid], grade K-5 students [small dash], grade 6–8 students [medium dash], and grades 9–12 students [long dash]. (B) NME percent for all students in CA [dark line] and by school district, 2011–2022.
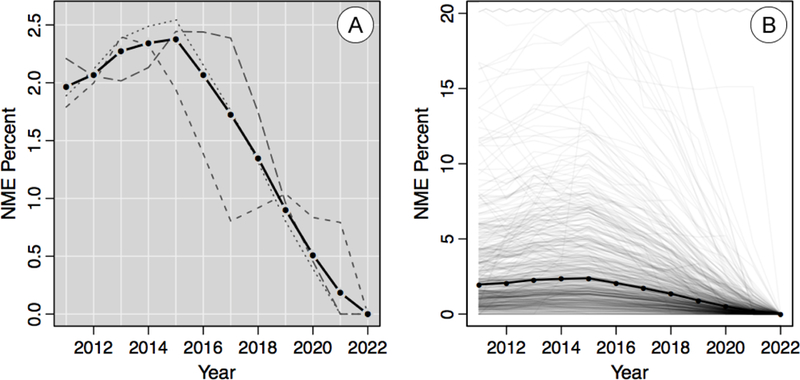
In (B), the line transparency for school districts is adjusted by total enrollment, e.g., school districts with a small number of students are assigned a more transparent line. NME percent values above 20% are not displayed for visualization purposes.
Figure 5(A) also highlights how SB277’s grandfather clause will result in a gradual, rather than immediate, decrease in the NME percent for CA schools. The law’s effect will eventually be a 0% NME percent for CA schools; however, this outcome will not be achieved until the 2022 school year, as the NME percent decreases by roughly 0.4% per year while students with pre-SB277 exemptions continue to attend CA schools. Over this time period, the three school types also are shown to have different paths to reach a 0% NME rate. CA elementary schools and high schools will achieve 0 NMEs in 2021, one year before the state’s junior high schools. Interestingly, even after SB277 is implemented, junior high schools in CA will see an increase in NME percent in 2018, corresponding to a large influx of students with pre-SB277 NMEs entering this grade span. The increase reflects the student cohorts that entered kindergarten after 2010, when the NME percent for incoming kindergarteners was increasing dramatically across the state.
In Figure 5(B), the overall NME percent is plotted for all of CA and separately by school district. In the figure, the line transparency is used to illustrate the enrollment size for each school district; darker lines are higher enrollment districts. This figure highlights the extreme variation in NME rates across the state, while also illustrating the general trend of a peak in NME percent in 2015 and gradual decline to 0% in 2022. The rate of decline for each school district appears roughly linear and based on the NME percent in 2015, however that slight variations from a linear decline are due to fluctuations in the yearly number of students entering and exiting each school district. Notably, the districts with the highest and more variable NME percent values are generally those with smaller enrollments, as the lighter lines in Figure 5(B) demonstrate. The relationship between NME percent and school enrollment is further illustrated in Figure 6, which shows the enrollment density (total number of students K-12 divided by geographic area of the school district) and NME percent for all schools in 2015, 2018, and 2021. Many of the highest density school districts in the state (e.g., greater than 100 students/km2) have NME percent values well below 10% prior to the implementation of SB277 and fall under 5% within three years of the law’s implementation.
Figure 6. NME percent and Enrollment Density for CA school districts in 2015, 2018, and 2021.
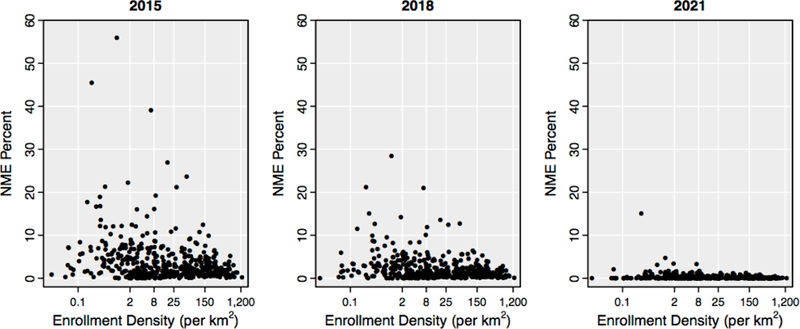
Enrollment density is plotted on a log scale, given the highly skewed data distribution.
The temporal changes in NME percent for CA students over the study period are provided in Table 1. In the table, the values are stratified by the NME percent of the school district, e.g., in 2011, 5.1% of all CA students attended school in school districts having an NME percent between 3.1–4%. The table highlights the increasing percentage of students that attended schools in school districts with the highest NME percent categories as the overall statewide NME percent increased from 2011 to 2015. The effects of SB277 on NMEs are apparent in 2016 and beyond. While the NME data are not vaccine-specific, they can be used as rough approximations of vaccine coverage (e.g., 100 – NME percent). Thus, using an approach similar to Carrel and Bitterman (2015), we highlight changes related to NME threshold values of 5% in 10%, which approximately correspond to the 90–95% vaccine coverage rate for herd immunity to measles and serve as an imperfect, but useful, proxy for the potential of VPD outbreak risk. In 2011, only 1.5% of all students were in school districts with an NME percent greater than 10%; however, this number grew to 2.1% of all CA students by 2015. The percent of students in school districts above the 5% NME threshold increased substantially from 2011 to 2015, rising from 7.3% to 10.7%. Noticeably, after the implementation of SB277 in 2016, the percent of students above these threshold values categories begins to decrease. The percentage of students above the 10% NME threshold falls to less than 0.1% in 2019. A similar trend can be observed using the 5% NME threshold, as the percent of students drops dramatically, falling under 1% by 2019. Interestingly, in a few of the categories between 5% and 10%, the percent of students increases after 2015 due to a “filling in” effect from previous years (e.g., an increase in the 5.1–6% category in 2016 due to the decrease in the number of students in school districts with an NME percent greater than 6%).
Table 1. Percent of all CA students (K-12), stratified by NME percent of their school district, 2011–2022.
The bottom two rows contain summaries based on a 5% threshold; in some cases, due to rounding, these values fluctuate slightly from the sum of the individual categories.
| NME (%) | Y2011 | Y2012 | Y2013 | Y2014 | Y2015 | Y2016 | Y2017 | Y2018 | Y2019 | Y2020 | Y2021 | Y2022 |
|---|---|---|---|---|---|---|---|---|---|---|---|---|
| 0 | 0.2 | 0.1 | 0.1 | 0.1 | 0.1 | 0.2 | 0.2 | 0.2 | 0.4 | 0.6 | 1.3 | 100 |
| 0.1 – 1 | 27.2 | 25.9 | 24.6 | 23.3 | 22.1 | 27.7 | 44.9 | 59.6 | 72.6 | 87.1 | 97.7 | 0 |
| 1.1 – 2 | 43.8 | 43.9 | 41.8 | 42.5 | 43.5 | 41.2 | 30.9 | 23 | 17.4 | 9.9 | 0.9 | 0 |
| 2.1 – 3 | 12.5 | 12.3 | 14.8 | 13.9 | 14.1 | 13.4 | 10.3 | 7.4 | 4.5 | 1.7 | 0 | 0 |
| 3.1 – 4 | 5.1 | 5.6 | 4.3 | 5.9 | 5.8 | 4.8 | 4.8 | 3.8 | 3.6 | 0.4 | 0.1 | 0 |
| 4.1 – 5 | 4 | 4 | 4.3 | 3.5 | 3.6 | 3.9 | 2.7 | 3.4 | 0.9 | 0.2 | 0 | 0 |
| 5.1 – 6 | 2.3 | 2.9 | 3.6 | 2.5 | 2.1 | 3.3 | 2.9 | 0.7 | 0.3 | 0.1 | 0 | 0 |
| 6.1 – 7 | 2.2 | 2.6 | 1.8 | 3.2 | 2.9 | 2.3 | 0.9 | 1.1 | 0 | 0 | 0 | 0 |
| 7.1 – 8 | 0.9 | 0.5 | 1.9 | 2.3 | 2.1 | 0.8 | 1 | 0 | 0.1 | 0 | 0 | 0 |
| 8.1 – 9 | 0.2 | 0.6 | 0.5 | 0.5 | 1.1 | 0.4 | 0.5 | 0.3 | 0.2 | 0 | 0 | 0 |
| 9.1 – 10 | 0.2 | 0.1 | 0.6 | 0.2 | 0.3 | 0.6 | 0.1 | 0 | 0 | 0 | 0 | 0 |
| +10 | 1.5 | 1.6 | 1.7 | 2.1 | 2.1 | 1.4 | 0.7 | 0.4 | 0.1 | 0 | 0 | 0 |
| ≤ 5 | 92.7 | 91.8 | 89.9 | 89.2 | 89.3 | 91.2 | 93.9 | 97.4 | 99.2 | 99.8 | 100 | 100 |
| > 5 | 7.3 | 8.2 | 10.1 | 10.8 | 10.7 | 8.8 | 6.1 | 2.6 | 0.7 | 0.2 | 0 | 0 |
Figure 7 details the spatiotemporal effects of SB277 on NMEs in California’s school districts. The map sequence clearly shows the gradual decline in NME percent throughout the state after 2015, as no new students with NMEs enter the school system. However, the map sequence also demonstrates the effects of SB277’s grandfather clause, highlighting regions where elevated NME rates will persist in the near future. Table 1 shows that, between 2015 and 2017, there will be large changes in the NME percent for the state. Yet, the maps for 2015 and 2017 appear quite similar. Much of the similarity is due to the discrete classification system required for a choropleth map and within group change in these years; however, this also demonstrates the extreme variation in population distribution throughout the state, as the districts with low enrollment density (i.e., those with low enrollment and a large geographic area) are visually dominant. By 2019, the map shows considerable changes across the state, as NME rates in school districts throughout much of the Central Valley region and in many of the heavily populated urban areas fall to 1% or less. Yet, in the 2019 map, numerous school districts having an NME percent of 5% or more can still be found throughout the state. These low enrollment districts are largely located in northern CA, where NME rates were extremely high in 2015 prior to the implementation of SB277, and isolated regions in the southern portion of the state. By 2021, nearly all school districts will have an NME rate of 1% or less as the final cohort of students with pre-SB277 NMEs reach sixth grade. One small school district in Yucca Valley, located in the southern portion of CA, will remain above 5% in 2021 due to the small number of students in the district and a notable cohort of NMEs entering kindergarten in 2015. In 2022, all school districts will reach 0% as this final cohort of students reaches seventh grade and their pre-SB277 NMEs are no longer valid.
Figure 7. NME rates in CA school districts prior to and after the implementation of SB277.
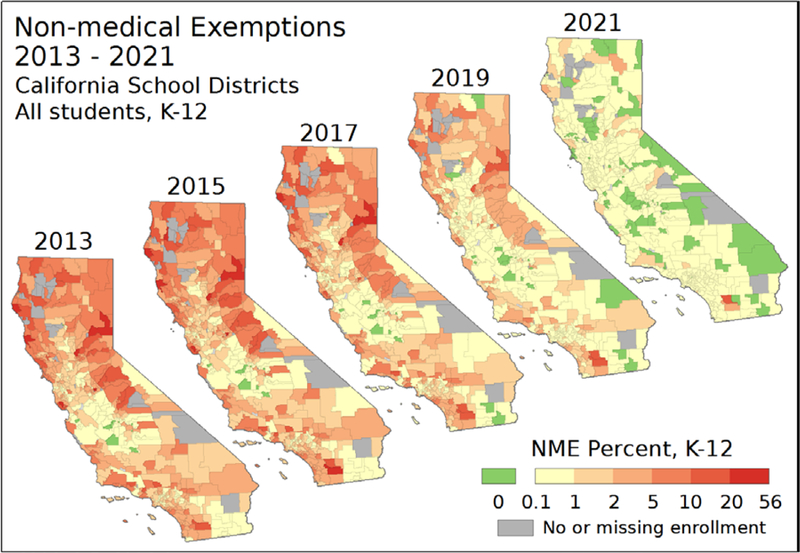
The single classification scheme is employed to show the change in NME rates over time.
We provide additional spatial context for the changes demonstrated in Table 1 and Figure 7. The results of the Moran’s I analysis demonstrate significant (p < 0.001) and moderate spatial clustering of NME rates from 2015 to 2020. The Moran’s I values only vary from 0.229 to 0.299 over this period, which is extremely consistent and largely due to the linear nature of the declining NME rates throughout the state due to SB277. In 2021, the Moran’s I value falls to 0.091 (p < 0.001) in 2021, which signals slight clustering, but is smaller in magnitude as the variation in NME rates across the state will be minimal. Figure 8A shows the result of the LISA analysis, which was conducted for each of the years between 2015 and 2021. The LISA results are mapped as the number of years that each school district was identified as being a member of a local cluster of high NME rates. In Figure 8A, these clusters of NME rates are found largely in northern CA, specifically, Eureka, Santa Cruz, and areas north of Lake Tahoe. Figure 8B shows the enrollment density (by area) for CA, and provides an additional public health context to exemption concerns. Virtually every school district noted as a high NME cluster in Figure 8A is a low enrollment density school district. This relationship holds more generally across the state, i.e., the regions with high NME rates as shown in Figure 7. Importantly, the urban areas of Los Angeles, San Diego, and San Francisco will not be part of the local NME clusters after the implementation of SB277.
Figure 8. (A) Results of the LISA analysis for 2015–2021. (B) Enrollment density (students per km2) for CA school districts in 2015.
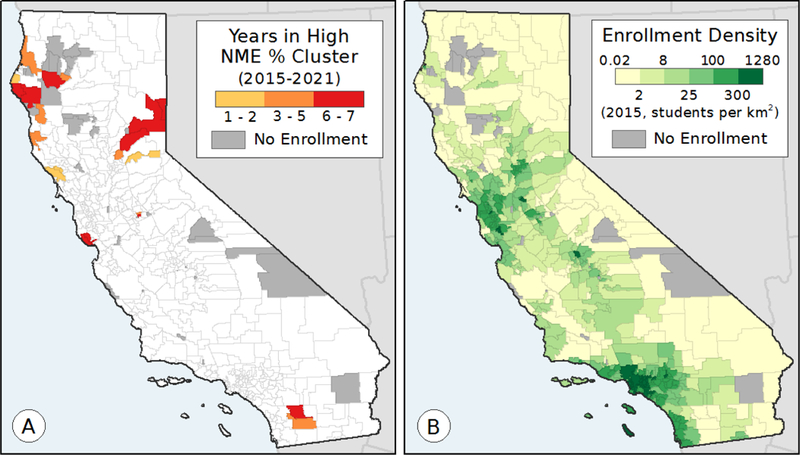
In (A), the results are mapped by the number of years (out of 7) that a school district was identified as being part of local cluster having high NME percent values.
4. Discussion and Conclusions
The state of California’s two new exemption-related laws, AB2109 and SB277 aim to increase vaccination coverage for students in CA schools by (1) creating an additional requirement for parents to obtain a personal belief exemption and (2) eliminating both the religious and philosophical exemption (NME) option, respectively. The immediate results of the new laws are apparent, as statewide NME rates for both kindergarteners and seventh graders have both dropped from peak values in 2013. However, we have shown that this behavior has been variable across the state in 2014 and 2015, as some regions appear to have acquiesced to the upcoming changes with declining NME rates over this period, while others appear unaffected by the state’s efforts and experienced increasing NME rates. Our clustering analysis found no evidence of large, statewide patterns in the changes over this time period.
SB277’s grandfather clause will delay the ultimate goal of removing all NMEs from the CA school system until 2022. Our current analysis has provided additional information and understanding of SB277’s effects on NMEs in California. First, we show that the law’s grandfather clause will result in substantial variations in NME rates throughout the state’s school types, as students with pre-SB277 NMEs progress through CA’s elementary, junior high, and high schools. Additionally, we reveal the future spatiotemporal changes in NME rates resulting from SB277’s implementation, illustrating how the buildup of NMEs in the CA school system and the law’s grandfather clause will interact to influence future NME rates across the state.
We demonstrate that the effects of SB277 will be highly geographically variable, even though all regions fall under the same new policy. Although all school districts in the state will eventually reach an NME rate of 0% by 2022, the rate of change is dependent upon the initial NME rate for the school district and fluctuations in the number of incoming students in the future. Figure 7 and the consistent results from the Moran’s I analysis show that this decline is largely consistent throughout the state. However, Figures 5(B), 6, and 7 also demonstrate that the differential starting points will leave some school districts with an elevated NME rate well after the implementation of the new law. Table 1 provides a summary of the magnitude of these effects for all CA students, showing the gradual decline in the proportion of students in school districts with the highest NME rates.
Our results show evidence of local spatial clustering of school districts with higher NME rates from 2015–2021; however, these districts and clusters are largely found in regions of the state with low student enrollment. While these regions may continue to have elevated risk for VPD outbreaks after the implementation of SB277, that risk is likely dampened due to the low enrollment density. We note that our ability to confidently predict future VPD outbreak risk is limited by the scale of the observation units, the aggregation of all K-12 students, and the use of enrollment density as a proxy for probability of contact among students. School districts are useful as a unit of analysis because they provide a hierarchical organization system that can be used to consolidate student cohorts that span multiple grades across multiple school types (e.g., grades K-5, 6–8, 9–12). However, the aggregation of all students in a school district masks the variation in NME rates and corresponding VPD outbreak risk amongst the individual schools, which serve as discrete, high-density gathering locations for specific subsets of students. While K-12 student enrollment density based on the geographic size of the school district only provides a rough approximation of student contact probability, we were unable to identify a suitable, alternative measure that was also congruent with the scale and purpose of our analysis.
The straightforward modeling approach in our analysis assumes that all students with a pre-SB277 NME will continue to be unvaccinated for one or more required vaccines after the implementation of the new law. Unfortunately, no data were available that would allow us to estimate CA parents’ reactions regarding their children’s pre-SB277 NMEs. This limitation in our approach likely led to an overestimation of future NME rates. Our model also assumes that all children will advance to the next grade on time; this approach was required given that we did not have data that would allow us to calculate the proportion of students with a pre-SB277 NME being held back from year to year and likely led to an underestimation of future NME rates. Lastly, our approach does not consider potential future movement of students among school districts, nor students moving into or out of the state school system from other states. We were unable to locate data that could be used to coherently predict the yearly movement of students within the state or to estimate immigration and emigration. We speculate that the overall effects of the limitations in our modeling approach may produce a modest overestimation of future NME rates in the state, but is the most robust approach available.
The elimination of the NME provision in CA may force parents who are vaccine hesitant or opposed to vaccination to seek out alternate options, including homeschooling, relocation out of state, or, importantly, to acquire an ME to avoid vaccination. In the US, reductions in NMEs due to more restrictive requirements have been accompanied by an increase in MEs (Seither et al., 2014, 2015). Mello et al. (2015) warn that SB277’s effects might be undermined by “willing providers” of MEs, e.g., those that will broaden the criteria for acquiring an ME to appease parents opposed to vaccination. In CA, there is already evidence that NMEs and MEs tend to be located in similar geographic regions (Carrel and Bitterman, 2015). We examined the percentage of MEs in CA from 2005–2015 and found no evidence of an increasing temporal trend, as ME rates for incoming kindergarteners have hovered between 0.15–0.2% over this time period. However, given the uncertainty regarding potential reactions to SB277, we stress that continued monitoring and surveillance of parental vaccine-related behavior will continue to be critical in CA in the near future.
The passage and implementation of SB277 in CA presents researchers, public health officials, and policymakers an opportunity to better understand the effects of prospective future exemption-related policy initiatives. In particular, this analysis uncovers a potential outcome that other states may face if pursuing similar initiatives. On one hand, SB277 is a strong move to increase vaccination coverage in schools by removing the NME provision, making CA one of only 3 states with this level of restrictiveness. On the other hand, the grandfather clause, which will delay the law’s desired outcome by six full school years, appears to have been necessary requirement for passage of the law. Our analysis points out the consequences of this approach, demonstrating that the temporal effects of the law will be geographically variable and will leave some regions of the state at risk of VPD outbreaks well after SB277 is implemented.
Contributor Information
Paul L. Delamater, Department of Geography, 4400 University Drive, MS6C3, George Mason University, USA
Timothy F. Leslie, Department of Geography, George Mason University, USA
Y. Tony Yang, Department of Health Administration and Policy, George Mason University, USA.
References
- Anonymous, 2016. Details omitted for double-blind reviewing
- AB 2109, 2011–2012 Leg, Reg Session (Ca 2012)
- Ali M, Emch M, von Seidlein L, Yunus M, Sack DA, Rao M, Holmgren J, Clemens JD, 2005. Herd immunity conferred by killed oral cholera vaccines in Bangladesh: a reanalysis. The Lancet 366, 44–49. doi: 10.1016/S0140-6736(05)66550-6 [DOI] [PubMed] [Google Scholar]
- Anselin L, 2002. Under the hood: Issues in the specification and interpretation of spatial regression models. Spatial Analysis for Agricultural Economists: Concepts, Topics, Tools and Examples 27, 247–267. doi: 10.1016/S0169-5150(02)00077-4 [DOI] [Google Scholar]
- Anselin L, 1995. Local Indicators of Spatial Association—LISA. Geographic Analysis 27, 93–115. doi: 10.1111/j.1538-4632.1995.tb00338.x [DOI] [Google Scholar]
- Atwell JE, Van Otterloo J, Zipprich J, Winter K, Harriman K, Salmon DA, Halsey NA, Omer SB, 2013. Nonmedical Vaccine Exemptions and Pertussis in California, 2010. Pediatrics 132, 624–630. doi: 10.1542/peds.2013-0878 [DOI] [PubMed] [Google Scholar]
- Bill History [WWW Document], n.d. . SB-277 Public Health: vaccinations. URL https://leginfo.legislature.ca.gov/faces/billHistoryClient.xhtml?bill_id=201520160SB277 (accessed 9.13.15).
- Birnbaum MS, Jacobs ET, Ralston-King J, Ernst KC, 2013. Correlates of high vaccination exemption rates among kindergartens. Vaccine 31, 750–756. doi: 10.1016/j.vaccine.2012.11.092 [DOI] [PubMed] [Google Scholar]
- CalEdFacts, n.d. CalEdFacts -Publications (CA Dept of Education) [WWW Document]. URL http://www.cde.ca.gov/re/pn/fb/index.asp (accessed 1.20.16).
- Carrel M, Bitterman P, 2015. Personal Belief Exemptions to Vaccination in California: A Spatial Analysis. Pediatrics 136, 80–88. doi: 10.1542/peds.2015-0831 [DOI] [PubMed] [Google Scholar]
- Cawkwell PB, Oshinsky D, 2015. Childhood vaccination requirements: Lessons from history, Mississippi, and a path forward. Vaccine 33, 5884–5887. doi: 10.1016/j.vaccine.2015.08.087 [DOI] [PubMed] [Google Scholar]
- CDC, 2016. Measles Cases and Outbreaks [WWW Document]. URL http://www.cdc.gov/measles/cases-outbreaks.html (accessed 1.21.16).
- CDC, 2015. Pertussis Outbreaks Trends [WWW Document]. URL http://www.cdc.gov/pertussis/outbreaks/trends.html (accessed 1.21.16).
- Delamater PL, Leslie TF, Yang YT, Jacobsen KH, 2016. An approach for estimating vaccination coverage for communities using school-level data and population mobility information. Applied Geography. 71, 123–132. doi: 10.1016/j.apgeog.2016.04.008 [DOI] [PMC free article] [PubMed] [Google Scholar]
- Dempsey AF, Schaffer S, Singer D, Butchart A, Davis M, Freed GL, 2011. Alternative Vaccination Schedule Preferences Among Parents of Young Children. Pediatrics. doi: 10.1542/peds.2011-0400 [DOI] [PubMed] [Google Scholar]
- Feikin DR, Lezotte DC, Hamman RF, Salmon DA, Chen RT, Hoffman RE, 2000. Individual and community risks of measles and pertussis associated with personal exemptions to immunization. JAMA 284, 3145–3150. doi: 10.1001/jama.284.24.3145 [DOI] [PubMed] [Google Scholar]
- Fine PEM, 1993. Herd Immunity: History, Theory, Practice. Epidemiologic Reviews 15, 265–302. [DOI] [PubMed] [Google Scholar]
- Hayes C, 2015. Dear Anti-Vax Parents: We’re Not Mad At You [WWW Document]. Newsweek. URL http://www.newsweek.com/dear-anti-vax-parents-were-not-mad-you-304332 (accessed 8.13.15).
- Hughes V, 2006. News feature: A shot of fear. Nature Medicine 12, 1228–1229. doi: 10.1038/nm1106-1228 [DOI] [PubMed] [Google Scholar]
- Lieu TA, Ray GT, Klein NP, Chung C, Kulldorff M, 2015. Geographic Clusters in Underimmunization and Vaccine Refusal. Pediatrics. doi: 10.1542/peds.2014-2715 [DOI] [PubMed] [Google Scholar]
- Lillvis DF, Kirkland A, Frick A, 2014. Power and Persuasion in the Vaccine Debates: An Analysis of Political Efforts and Outcomes in the United States, 1998–2012. Milbank Quarterly 92, 475–508. doi: 10.1111/1468-0009.12075 [DOI] [PMC free article] [PubMed] [Google Scholar]
- May T, Silverman RD, 2003. “Clustering of exemptions” as a collective action threat to herd immunity. Vaccine 21, 1048–1051. doi: 10.1016/S0264-410X(02)00627-8 [DOI] [PubMed] [Google Scholar]
- Mello MM, Studdert DM, Parmet WE, 2015. Shifting Vaccination Politics — The End of Personal-Belief Exemptions in California. New England Journal of Medicine 373, 785–787. doi: 10.1056/NEJMp1508701 [DOI] [PubMed] [Google Scholar]
- Omer SB, Enger KS, Moulton LH, Halsey NA, Stokley S, Salmon DA, 2008. Geographic Clustering of Nonmedical Exemptions to School Immunization Requirements and Associations With Geographic Clustering of Pertussis. American Journal of Epidemiology 168, 1389–1396. doi: 10.1093/aje/kwn263 [DOI] [PubMed] [Google Scholar]
- Omer SB, Pan WKY, Halsey NA, Stokley S, Moulton LH, Navar AM, Pierce M, Salmon DA, 2006. Nonmedical exemptions to school immunization requirements: Secular trends and association of state policies with pertussis incidence. JAMA 296, 1757–1763. doi: 10.1001/jama.296.14.1757 [DOI] [PubMed] [Google Scholar]
- Omer SB, Peterson D, Curran EA, Hinman A, Orenstein WA, 2014. Legislative challenges to school immunization mandates, 2009–2012. JAMA 311, 620–621. doi: 10.1001/jama.2013.282869 [DOI] [PubMed] [Google Scholar]
- Omer SB, Richards JL, Ward M, Bednarczyk RA, 2012. Vaccination Policies and Rates of Exemption from Immunization, 2005–2011. New England Journal of Medicine 367, 1170–1171. doi: 10.1056/NEJMc1209037 [DOI] [PMC free article] [PubMed] [Google Scholar]
- Park A, 2008. How Safe Are Vaccines? Time 36–41. [PubMed] [Google Scholar]
- SB 277, 2015-2016 Leg, Reg Session (Ca 2015)
- Seither R, Calhoun K, Knighton CL, Mellerson J, Meador S, Tippins A, Greby SM, Dietz V, 2015. Vaccination Coverage Among Children in Kindergarten — United States, 2014–15 School Year. MMWR 64, 897–904. [DOI] [PubMed] [Google Scholar]
- Seither R, Masalovich S, Knighton CL, Mellerson J, Singleton JA, Greby SM, 2014. Vaccination Coverage Among Children in Kindergarten — United States, 2013–14 School Year. MMWR 63, 913–920. [PMC free article] [PubMed] [Google Scholar]
- Wang E, Clymer J, Davis-Hayes C, Buttenheim A, 2014. Nonmedical Exemptions From School Immunization Requirements: A Systematic Review. American Journal of Public Health 104, e62–e84. doi: 10.2105/AJPH.2014.302190 [DOI] [PMC free article] [PubMed] [Google Scholar]
- Yang YT, Barraza L, Weidenaar K, 2015. Measles outbreak as a catalyst for stricter vaccine exemption legislation. JAMA 314, 1229–1230. doi: 10.1001/jama.2015.9579 [DOI] [PubMed] [Google Scholar]
- Yang YT, Debold V, 2014. A Longitudinal Analysis of the Effect of Nonmedical Exemption Law and Vaccine Uptake on Vaccine-Targeted Disease Rates. American Journal of Public Health 104, 371–377. doi: 10.2105/AJPH.2013.301538 [DOI] [PMC free article] [PubMed] [Google Scholar]
- Yang YT, Delamater PL, Leslie TF, Mello MM, 2016. Sociodemographic Predictors of Vaccination Exemptions on the Basis of Personal Belief in California. American Journal of Public Health 106, 172–177. doi: 10.2105/AJPH.2015.302926 [DOI] [PMC free article] [PubMed] [Google Scholar]
- Yang YT, Silverman RD, 2015. Legislative prescriptions for controlling nonmedical vaccine exemptions. JAMA 313, 247–248. doi: 10.1001/jama.2014.16286 [DOI] [PubMed] [Google Scholar]


