

Abstract
Background
The expression of the HTT CAG repeat expansion mutation causes neurodegeneration in Huntington's disease (HD). Objectives: In light of the – mainly in-vitro – evidence suggesting an additional role of huntingtin in neurodevelopment we used 3T MRI to test the hypothesis that in CAG-expanded individuals without clinical signs of HD (preHD) there is evidence for neurodevelopmental abnormalities.
Methods
We specifically investigated the complexity of cortical folding, a measure of cortical neurodevelopment, employing a novel method to quantify local fractal dimension (FD) measures that uses spherical harmonic reconstructions.
Results
The complexity of cortical folding differed at a group level between preHD (n = 57) and healthy volunteers (n = 57) in areas of the motor and visual system as well as temporal cortical areas. However, there was no association between the complexity of cortical folding and the loss in putamen volume that was clearly evident in preHD.
Conclusions
Our results suggest that HTT CAG repeat length may have an influence on cortical folding without evidence that this leads to developmental pathology or was clinically meaningful. This suggests that the HTT CAG-repeat expansion mutation may influence the processes governing cortical neurodevelopment; however, that influence seems independent of the events that lead to neurodegeneration.
Keywords: Huntington, MRI, Striatum, Cortex, Neurodevelopment, CAT12
Highlights
-
•
Measures of cortical neurodevelopment in preclinical Huntington's disease (HD) gene carriers differ from healthy volunteers
-
•
The influence on cortical folding of the HD gene was not associated with developmental pathology or clinically meaningful
-
•
The influence of the HD gene on cortical neurodevelopment may differ from that on neurodegeneration
1. Introduction
A CAG repeat expansion mutation in the HTT gene causes Huntington's disease (HD), a neurodegenerative mixed movement disorder with behavioural abnormalities and cognitive decline. Neurodegeneration, for instance striatal volume loss (Wolf et al., 2013; Tabrizi et al., 2009), likely begins many years before the emergence of unequivocal signs of manifest HD (Dogan et al., 2013). Given that for instance striatal volume loss was not evident in very far from onset carriers of the HD mutation the brain structural phenotype of neurodegeneration may take many years, or even decades, to develop from the chronic expression of the HTT mutation (Gorges et al., 2017).
The precise function(s) of HTT remain incompletely understood. HTT is a large stable protein which is ubiquitously expressed in the murine and human brain (Saudou and Humbert, 2016). HTT seems important in neurodevelopment in model systems as HTT knock-out in mice results in major abnormalities of the brain and lethality shortly after birth (Nasir et al., 1995; White et al., 1997; Dietrich et al., 2009), and depletion of wild-type HTT in the postnatal mouse CNS results in progressive neurodegeneration (Dragatsis et al., 2000). In chimeric embryos selective knock-down of HTT leads to abnormal differentiation of neuroblasts in the striatum, cortex and thalamus (Reiner et al., 2001), and embryonic loss of HTT in postmitotic projection neurons affects neuronal morphology, e.g. dendritic arborization in adulthood in mice (Barnat et al., 2017). Apart from one study reporting smaller intra-cranial volumes in preHD (Nopoulos et al., 2011) it remains little understood whether the evidence suggesting a role of HTT in neurodevelpment in HD models translates to a neurodevelopmental signature in humans carrying the HTT CAG repeat expansion.
Structural MRI has contributed greatly to our understanding of the neurodegenerative aspects of HD (Dogan et al., 2013). Here, we used structural MRI in CAG-expanded individuals without clinical signs of manifest HD (preHD). We investigated the complexity of cortical folding, a measure of cortical neurodevelopment, employing a novel method to quantify local fractal dimension (FD) measures that uses spherical harmonic reconstructions (Yotter et al., 2011). We expected bilateral striatal GMV loss in preHD as evidence of neurodegeneration (Tabrizi et al., 2009; Tabrizi et al., 2011) but also differences to healthy volunteers in our measures of neurodevelopment. Finally, we hypothesized that a CAG size driven relationship exists between the measures of neurodegeneration and neurodevelopment.
2. Materials and methods
2.1. Participants
We studied 57 right-handed participants with a molecular genetic diagnosis of a CAG repeat expansion (≥38) in the Huntingtin gene (Table 1) and a diagnostic confidence level score of ≤2 on the motor Unified Huntington's Disease Rating Scale (UHDRS) (Huntington-Study-Group, 1996). All participants underwent a thorough neuropsychiatric examination including the complete UHDRS. PreHD participants with a history of another neurological disorder, a history of head trauma or learning disabilities were excluded from the study. The burden of HD pathology was estimated using a formula based on age and CAG repeat length (CAGn-35,5) x age) (Penney et al., 1997).The healthy volunteer group consisted of 57 right-handed participants matched for age, education and handedness. All participants underwent a semi-structured psychiatric interview in order to exclude axis-I and axis-II disorders according to DSM-IV-TR. Participants with a neurological or a psychiatric disorder according to DSM-IV-TR criteria, substance abuse or dependence were excluded. The participants` consent was obtained according to the Declaration of Helsinki and the study has been approved by the local ethics committee (Ulm University, Germany). Participants gave written informed consent following a complete description of the study's aims and procedures.
Table 1.
Demographics and clinical scores for controls and preHD individuals. N. a. indicates that these data were not available in healthy participants; UHDRS: Unified Huntington's disease rating scale. sd: standard deviation.
| Controls (n = 57) |
preHD (n = 57) |
||||||
|---|---|---|---|---|---|---|---|
| Mean | sd | Range | Mean | sd | Range | p-Value | |
| Age (years) | 38.8 | 9.8 | 20–59 | 38.8 | 9.1 | 21–57 | 0.97a |
| Education (years) | 14.7 | 2.8 | 14.6 | 2.4 | 0.71a | ||
| Gender (m/f) | 30/27 | 24/33 | 0.11b | ||||
| CAG repeat length | n. a. | 41.7 | 2.3 | 38–48 | |||
| Disease burden score | n. a. | 235.3 | 83.9 | 80–413 | |||
| UHDRS motor score | 0.4 | 0.9 | 0–4 | 3.6 | 3.7 | 0–17 | 0.0001a |
t-test.
χ2 test.
2.2. MRI data acquisition
High-resolution structural data were acquired using a 3 T Magnetom ALLEGRA (Siemens, Erlangen, Germany) head MRI system. The MRI parameters of the three-dimensional magnetization-prepared rapid gradient-echo (3D-MPRAGE) sequences were as follows: TE = 3.93 ms; TR = 2080 ms; TI = 1100 ms; FOV = 256 mm; slice plane = axial; slice thickness = 1 mm; resolution = 1.0 × 1.0 × 1.0 mm3; number of slices = 256.
2.3. Data analysis
We used the Statistical Parametric Mapping analysis package (SPM12, http://www.fil.ion.ucl.ac.uk/spm/software/spm12/) together with the Computational Anatomy Toolbox for SPM (CAT12, http://www.neuro.uni-jena.de/cat/) for cortical surface-based (estimation of cortical thickness and complexity of cortical folding based on fractal dimension, FD) and VBM analyses.
Cortical thickness (CT) was analyzed following the workflow specified in Dahnke et al., 2013 (Dahnke et al., 2013) as implemented in CAT12. Specifically, this workflow comprises tissue segmentation to estimate the white matter distance, which in turn is used to project the local maxima to other gray matter voxels. Resampled surface data for CT were smoothed using an 18 mm (and a 15 mm) Full Width at Half Maximum (FWHM) Gaussian kernel prior to 2nd level analyses. In 2nd level between-group t-tests we computed vertex-wise analyses across each hemisphere. Statistical significance was based on a family wise error (FWE) corrected cluster-level threshold of p < 0.05.
Complexity of cortical folding (CCF) was analyzed following the workflow specified in Nenadic et al., 2014 (Nenadic et al., 2014), which is based on Dahnke et al., 2013 (see above) as implemented in CAT12. Resampled surface data for FD were smoothed using a 25 mm (and a 20 mm) Gaussian FWHM kernel prior to 2nd level analyses (Dahnke et al., 2013; Nenadic et al., 2014). In 2nd level between-group t-tests we compared FD values at the vertex level, i.e. values in each of the vertices across each hemisphere. Statistical significance was based on a family wise error (FWE) corrected cluster-level threshold of p < 0.05. For CT analysis a kernel size of 18 mm was chosen according to the expected spatial dimension of effects observed in our data. As parameters based on cortex folding (e.g. CCF) need a larger filter size, we used a kernel size of 25 mm. To exclude an impact of smoothing kernel, we reanalyzed our data with the lower kernel sizes (e.g. 15 mm for CT and 20 mm for CCF).
VBM included spatial normalization, segmentation and smoothing. In brief, each participant's original T1 image was spatially normalised and segmented into gray and white matter and cerebrospinal fluid (CSF). After data preprocessing, modulated normalised gray matter volumes (GMV) were smoothed using an 8 mm FWHM Gaussian kernel prior to 2nd level between-group analyses. GMV differences between the groups were calculated using a two-sample t-test model adjusted for age, gender and total intracranial volume (ICV) (sum of gray and white matter and CSF). An absolute threshold of 0.2 was used to prevent effects located at tissue border regions. Inference of meaningful local group differences was based on a FWE-corrected threshold of p < 0.05 at the cluster-level. Stereotaxic coordinates of significant between-group differences in GMV are reported from maxima within a given cluster according to the Montreal Neurological Institute (MNI) template. Following peak voxel values, distinct anatomical regions emerging from the between-group comparisons were labelled according to the Neuromorphometrics Atlas (http://www.neuromorphometrics.com/), as implemented in SPM12.
We were specifically interested in relationships between CCF in cortical motor regions, putamen GMV, genetic and clinical markers, such as CAG repeat length and UHDRS total motor score. To test for such associations, we used a region-of-interest (ROI) approach to extract FD values from regions emerging from between-group comparisons at the 2nd level (see below). FD values within the preHD group were extracted using the Desikan-Killiany Atlas. FD values of the left precentral and the right posterior cingulate cortices were considered. Next, within the preHD group MarsBar (http://marsbar.sourceforge.net/) was used to extract cluster-wise mean GMV parameter estimates representing the extent of putamen GMV (mean GMV comprising bilateral putamen volumes). To support the final multiple regression analysis, age, UHDRS total motor score, CAG repeat length, mean putamen GMV, and FD of left supramarginal, left lingual, left precentral, left middle temporal, right lingual, right posterior cingulate, right middle cingulate gyrus as well as right precuneus were tested for correlations using Spearman's ρ (see supplementary results). Two multiple regression models were computed: the first model examined the impact of age, CAG repeat length and FD values of left supramarginal, left lingual, left precentral, left middle temporal, right lingual, right posterior cingulate, right middle cingulate gyrus as well as right precuneus on mean putamen GMV. The second model investigated the impact of age, CAG repeat length, FD values of left supramarginal, left lingual, left precentral, left middle temporal, right lingual, right posterior cingulate, right middle cingulate gyrus as well as right precuneus and mean putamen volume on UHDRS total motor score. Additionally, these models were calculated including median-split CAG values coded as a binary predictor representing high and low CAG repeat lengths (see supplementary material, Fig. 3, for individual values of FD and putaminal volume colour-split by median CAG repeat). Correlations and multiple linear regression models were calculated using the R software environment for statistical computing (https://www.r-project.org/). The regression models included mean centered values of the respective predictors. An uncorrected threshold of p < 0.05 was used. The best fitting subset of predictor variables was determined using the Akaike Information Criterion (AIC) in a backward elimination algorithm, via the step function implemented in R. The final models were cropped to the predictor variables surviving the backward elimination. The data that support the findings of this study are available from the corresponding author, upon reasonable request.
3. Results
3.1. Clinical and demographical data
The groups did not significantly differ with respect to age, gender or education. PreHD individuals had a significantly higher UHDRS total motor score than healthy volunteers; however, the mean total motor score was still low and well below thresholds that are associated with motor manifest HD (Braisch et al., 2017) compared to controls (Table 1). Two preHD participants (one male, one female) had a CAG repeat size of 38.
3.2. Cortical thickness and cortical complexity
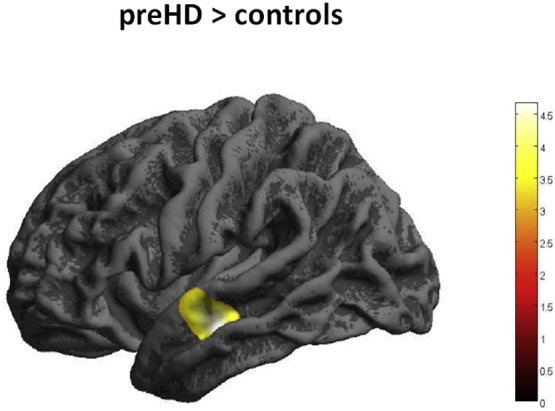
CT was similar in healthy controls (HC) and preHD. In contrast, CCF significantly differed between preHD and HC: Within the left hemisphere in preHD FD was lower than in HC in a cluster including supramarginal and postcentral cortex, precentral cortex and lingual gyrus, see Fig. 1 and Table 2. At the same time in the left hemisphere of preHD participants FD was greater than in HC in middle and superior temporal cortex; see Fig. 2 and Table 2. For the right hemisphere, FD was lower in preHD than in HC in precuneus, posterior and middle cingulate gyrus and lingual gyrus; see Fig. 2 and Table 2.
Fig. 1.

Decreased FD in preHD compared to healthy controls. Results of 2nd level between-group t-test, p < 0.05, FWE cluster-level correction. The colour bar represents the T-value.
Table 2.
Between group differences of cortical complexity.
| Controls > preHD |
preHD > controls |
||||||||||
|---|---|---|---|---|---|---|---|---|---|---|---|
| Anatomical region | x | y | z | Z | k | Anatomical region | x | y | z | Z | k |
| Left supramarginal gyrus & Left postcentral | −55 | −24 | 31 | 4.65 | 1390 | Left middle & superior temporal gyrus | −50 | −16 | −14 | 4.46 | 1129 |
| Left precentral gyrus | −46 | −10 | 52 | 4.60 | 946 | ||||||
| Left precentral gyrus | −13 | −30 | 63 | 4.45 | 979 | ||||||
| Left lingual gyrus | −11 | −59 | −4 | 4.19 | 864 | ||||||
| Right precuneus | 15 | −58 | 21 | 4.48 | 1019 | ||||||
| Right posterior cingulate gyrus | 5 | −49 | 13 | 3.97 | |||||||
| Right middle cingulate gyrus | 4 | −7 | 42 | 4.22 | 877 | ||||||
| Right lingual gyrus | 12 | −59 | 2 | 4.16 | 703 | ||||||
| Controls > preHD | |||||
|---|---|---|---|---|---|
| Anatomical region | x | y | z | Z | k |
| Left putamen | −24 | 0 | −2 | 6.5 | 2470 |
| Right putamen | 24 | 2 | 2 | 6.5 | 2515 |
Cortical complexity differences between healthy controls and preHD as a result of two-sample t-tests, showing stereotaxic coordinates of peak-voxel, anatomical denominations, cluster size (k) and Z-scores from regions surviving a FWE- corrected cluster-level threshold of p < 0.05.
Voxel-based morphometry differences between healthy controls and preHD as a result of two-sample t-tests showing stereotaxic coordinates of peak-voxel, anatomical denominations, cluster size (k) (voxels per cluster) and Z-scores from regions surviving a FWE- corrected cluster-level threshold of p < 0.05.
Fig. 2.
Increased FD in preHD compared to healthy controls. Results of 2nd level between-group t-test, p < 0.05, FWE cluster-level correction. The colour bar represents the T-value.
For completeness, Table 1 and Fig. 1 supplementary data display CT differences between preHD and controls in regions that did not survive a FWE-corrected cluster-level threshold of p < 0.05. Briefly, at this significance threshold preHD showed lower CT in left postcentral cortex bilateral temporal regions, bilateral precuneus and the right supplementary motor cortex. Higher CT in preHD compared to controls was found in left temporoparietal regions and the left lingual gyrus.
Finally, we also investigated CCF with a gender-balanced sample including 48 controls and 48 preHD (m/f = 24/24, controls mean age/SD = 39.6/9.9 years, preHD mean age/SD = 39.2/9.2, p = 0.83), mean/SD repeat length and DBS in preHD = 41.7/2.3 and 236.8/82.9). These analyses confirmed lower CCF in preHD in left postcentral, supramarginal and precentral gyri. The lingual gyrus cluster did not survive FWE-correction (p = 0.20, k = 397 vertices). Higher CCF in preHD compared to controls was also confirmed for the cluster comprising the left middle and superior temporal gyri. Analyses for the right hemisphere showed lower CCF in preHD in a cluster comprising the precuneus and posterior cingulate gyrus. The middle cingulate and lingual gyri did not survive FWE-correction (p = 0.1, k = 410 and p = 0.39, k = 85 vertices). Table 5 in the supplementary data displays stereotaxic coordinates, anatomical denominations, cluster sizes and Z-scores for regions that did survive a FWE-corrected cluster-level threshold of p < 0.05.
3.2.1. Effects of smoothing kernel
To investigate the impact of the smoothing kernel on CT, the individual CT images were smoothed with a 15 mm FWHM Gaussian kernel. Using these data, we recalculated between-group analyses, as described above. Significant differences between the groups were not found using a FWE-corrected cluster-level threshold of p < 0.05. Table 2 in the supplementary data displays stereotaxic coordinates, anatomical denominations, cluster sizes and Z-scores in regions that did not survive a cluster-level correction.
In addition, to investigate the impact of the smoothing kernel on CCF, the individual CCF images were smoothed with a 20 mm FWHM Gaussian kernel followed by between-group analyses, as described above. This confirmed the previous findings for the left hemisphere, as described above. For the right hemisphere, CCF in preHD was lower in precuneus, lingual and middle cingulate gyrus (p < 0.05, FWE-corrected). Significance was not confirmed for posterior cingulate gyrus (see Table 3 supplementary data).
3.3. Voxel-based morphometry
Total intracranial volume (sum of gray and white matter and CSF) was similar in healthy volunteers and preHD (mean = 1537.9 ml, SD = 136.7 versus mean = 1514.8 ml, SD = 172.9, p = 0.43). Also, total GMV and white matter volume (WMV) was similar between healthy persons and preHD (GMV: mean = 666.52 ml, SD = 65.1 versus mean = 652.8 ml, SD = 65.2, p = 0.26; WMV: mean = 550.3 ml, SD = 63.7 versus mean = 537.6 ml, SD = 77.1, p = 0.34). Compared to HC preHD participants had lower GMV in the putamen bilaterally; see Fig. 3 and Table 2. There were no regions with higher GMV in preHD compared to healthy controls.
Fig. 3.
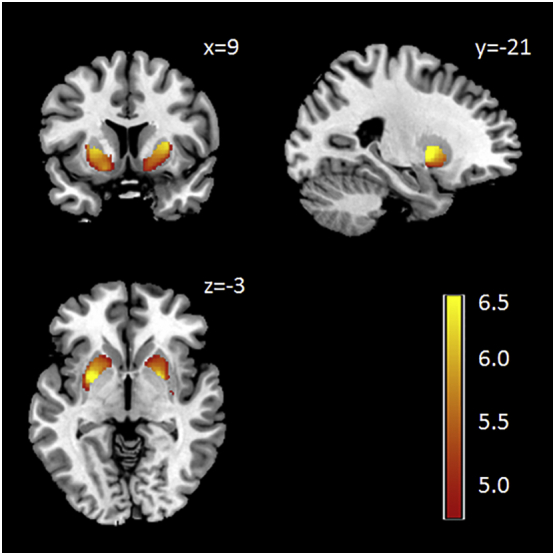
Voxel-based morphometry (VBM) analysis: decreased striatal gray matter volume in preHD compared to healthy controls; results from the 2nd level between-group t-test, p < 0.05, FWE cluster-level correction. The 2nd level maps were rendered on the anatomical template implemented in MRIcron (http://people.cas.sc.edu/rorden/mricron). The colour bar represents the T-value.
3.4. Multiple regression models
We next examined the relationship between CCF, i.e. a neurodevelopmental measure that is stable despite ongoing neurodegeneration, age and CAG repeat length as key factors involved in HD pathogenesis and putamen volume as an indicator of the extent of HD induced neurodegeneration. To this end we used a regression model predicting mean putamen GMV with age, CAG repeat length, left supramarginal, left postcentral, left precentral, left middle temporal, left lingual, right posterior cingulate, left superior temporal, right lingual, right middle cingulate gyrus as well as right precuneus FD as independent variables. In a backward elimination regression analysis age, CAG repeat length, left supramarginal, right posterior cingulate gurus and right precuneus CCF contributed significantly to the final model (residual standard error: 0.06 on 44 degrees of freedom (DF); adjusted R2: 0.35; F-statistic: 3.596 on 12 and 44 DF, p < 0.0001). Age, CAG repeat length, left supramarginal gyrus and right precuneus FD were significant predictors for mean putamen GMV (p < 0.02, p < 0.04, p < 0.003 and p < 0.02 respectively, uncorrected, ß = -0.003, −0.011, 0.375, 0.21 respectively).
We then examined whether structural neurodevelopmental parameters, putamen volume, CAG, and age predicted the motor clinical phenotype. Mean putamen GMV was a significant predictor of UHDRS motor score (p < 0.01, uncorrected, β = -19.046) in the final regression model predicting UHDRS motor score (residual standard error: 3.28 on 55 DF); adjusted R2: 0.16; F-statistic: 12.05 on 1 and 55 DF, p < 0.01). However, FDs did not contribute significantly to the model.
Including median-split CAG values coded as a binary predictor before backward elimination resulted in identical final models as shown above. Also forcing this predictor to be included in the final models did not improve model performance (Fig. 3, supplementary data).
Though statistically not significant, given gender imbalance between the healthy volunteers and HD participants, we repeated CCF between-group analyses using gender as nuisance variable (Table 2, supplementary data displays stereotaxic coordinates, anatomical denominations, cluster sizes and Z-scores from regions surviving a FWE- corrected cluster-level threshold of p < 0.05). In brief, this analysis confirmed the previous findings for the left hemisphere, whereas for the right hemisphere, lower CCF in preHD was confirmed in all areas except for the right lingual gyrus.
4. Discussion
Here we investigated measures of cortical neurodevelopment and structural integrity in healthy individuals carrying the HTT CAG repeat expansion mutation (preHD). As a new finding we show differences in measures of the cortical complexity at a group level between preHD and healthy volunteers in areas of the motor and visual system as well as temporal cortical areas. While our results suggest that HTT CAG repeat length may have an influence on cortical folding it is important to note that there was no evidence that this leads to developmental pathology or was clinically meaningful. In addition, there was no association between FD in motor regions and the putamen atrophy that was clearly evident in preHD. This indicates that the HTT CAG-repeat expansion mutation may influence the processes governing cortical neurodevelopment; however, that influence seems independent of the events that lead to neurodegeneration.
Some – mainly in vitro – evidence points to a possible role of HTT in neurodevelopment, and altered shape of cerebral gyri and sulci and significantly lower measures of head circumference in comparison to healthy controls may be the clinical expression (Lee et al., 2012; Nopoulos et al., 2007). We used neuroimaging methods to investigate whether the brains of people carrying the HD mutation differed in measures of neurodevelopment from those of healthy age- and sex-matched volunteers. We first assessed total intra-cranial volume given the observation of smaller intra-cranial volumes in preHD (Nopoulos et al., 2011) but found volumes to be similar in preHD and healthy volunteers. We next measured the FD, perhaps a more sensitive measure of cortical neurodevelopment (Yotter et al., 2011). The preHD group differed from the healthy volunteer group in the amount of cortical folding in temporal regions, and in areas of the motor and visual system. The spatial pattern of FD differences between the groups differ from what has been observed in known neurodevelopmental disorders such as autism where higher cortical folding was seen in frontal, temporal and parietal regions, more pronounced in children than in young adults (Awate et al., 2008) or in rare genetically determined neurodevelopmental disorders, such as Williams syndrome (Gaser et al., 2006) or 22q deletion syndrome (Schaer et al., 2008). Our findings could suggest that HTT gene expression is a factor that contributes to cortical development in particular in those regions that differed between healthy volunteers and preHD. The influence of the HTT gene could be modified depending on the size of the CAG repeat length within its first exon. From a neurodevelopmental perspective, the lateral temporal cortex expands twice as much as other regions during normal human development (Hill et al., 2010). Regions of higher expansion tend to be less mature both structurally and functionally and are characterized by less synaptic density and dendritic arborisation, thus they might be more sensitive to postnatal changes (Hill et al., 2010). Tension along axons (or mechanical stretch) may represent the primary driving force for cortical folding patterns (Van Essen, 1997; Budday et al., 2014). During expansion of the brain, these tension forces occur in relation to surrounding regions (Van Essen, 1997), pulling interconnected regions together and weakly interconnected regions apart. Furthermore, these forces seem influenced by differential growth of the brain and the different cortical layers (Hill et al., 2010; Budday et al., 2014; Im et al., 2006) as well as dendrite maturity and morphology (Wang et al., 2017). In our human CAG-expanded participants the MRI measure of neurodevelopment did not reveal any clear cut pathology that would suggest neurodevelopmental abnormalities. It is possible, however, that HTT expression can influence neurodevelopment either as a function of HTT or via transcription regulation of other genes, so that it is conceivable that neurodevelopmental indices vary depending on CAG repeat size (Saudou and Humbert, 2016).
We did not find any CT differences between the two groups. In previous preHD studies lower CT was more pronounced with proximity to symptom onset, but less pronounced during very early presymptomatic stages (Tabrizi et al., 2009; Rosas et al., 2005; Nopoulos et al., 2010). The disease burden of our sample is similar to previous studies, i.e. TRACK-baseline data of the preHD-A cohort (Tabrizi et al., 2009), and others (Nopoulos et al., 2010), which have not shown significant cortical thinning in the far from onset group. In our sample, CT between group differences did not survive stringent correction. Even without the cluster-correction we only found little overlap between FD and CT changes, particularly not in precentral and cingulate cortices.
We next asked whether the group differences in FD were associated with clinical measures. Our preHD participants were clinically well so it is not surprising that we did not find any associations of the neurodevelopmental measures with, for example, motor ratings. Subtle neurological abnormalities have already been detected in the preclinical phase of Huntington's disease (McGarry and Biglan, 2017). The UHDRS was not developed to capture the clinical phenotype in preHD. Quantitative measurements of the motor phenotype might detect signal that is not picked up using rating scales. If so, it remains to be determined whether any such signal is an expression of disease or merely reflects variability within the range of normal human behavior.
Overall, our data are consistent with the notion that people carrying the CAG expansion are clinically well until they manifest signs of HD as a consequence of neurodegeneration (Gorges et al., 2017). We then investigated whether cortical neurodevelopment early in life influences neurodegeneration later in life. To this end we assessed the relationship between the neurodevelopmental measures and putamen volume as a signature of the HD neurodegenerative process. Bilateral striatal volume loss, as we also report in the current study, is a particularly robust finding in preHD closer to motor onset and in manifest HD (Tabrizi et al., 2009; Paulsen et al., 2006). While putamen volume also varied in our preHD participants and healthy volunteers, and there was overlap between the two groups, a number of preHD participants had putamen volumes considerably smaller than the lower end of the volume distribution in healthy volunteers. Since in very far from motor onset preHD there was no evidence of any structural abnormalities this suggests that the structural changes closer to onset, and after onset, result from a neurodegenerative process that begins, in most cases, in adulthood (Gorges et al., 2017). We did not find any association between FD of motor regions and putamen volume. This suggests that cortical folding and volume of regions relevant to voluntary movement control may not be related. However, FD of parietal regions (i.e. precuneus and supramarginal cortex) and CAG repeat length were significant predictors of mean putamen GMV. This supports the notion of a relationship between gyrification and brain volume in some regions (Gautam et al., 2015) but we caution against extending this to brain volumes in the pathological range, for instance caused by neurodegeneration. This would ideally require longitudinal studies.
The use of the FD measures to assess CCF (Yotter et al., 2011) is a strength of this study. In comparison to the local gyrification index (Hirjak et al., 2015; Hirjak et al., 2016), FD does not depend on how the limits of the outer cortical surface are defined and how brains are normalised. This minimises the effect of brain size and may help reduce data variability. In addition, using spherical harmonic (SPH) reconstructions (Yotter et al., 2011) the number of vertices remains the same for all reconstructed surfaces. This reduces the influence of individual vertex alignment. Therefore, information from multiple regions is used and local FD for each vertex is calculated within the reconstruction. In addition to these methodological advantages, cortical folding itself remains quite stable in mid-adulthood following the main phases of cortical folding in the second half of pregnancy (Dubois et al., 2019), immediately after birth (Dubois et al., 2019), in childhood, adolescence and early adulthood (Sandu et al., 2014; Blanton et al., 2001; Kalmanti and Maris, 2007). Cortical complexity, however, may change in elderly people with age-related brain atrophy, as e.g. shown in people 68 to 73 years of age (Sandu et al., 2014). Moreover, in other neurodegenerative conditions, such as Alzheimer's disease (AD), several markers of cortical integrity were abnormal, including FD and local gyrification (Ruiz de Miras et al., 2017). Importantly, however, local cortical complexity in individuals with AD was not associated with age (Ruiz de Miras et al., 2017). In our mid-adulthood participants, there was no regional cortical atrophy, as indicated by VBM and CT analyses, as well as similar total gray and white matter volumes in controls and preHD. This indicates that FD in our participants was unbiased by disease- or age-related volume loss and thus solely reflects neurodevelopment.
The size of the present sample is a further strength of our study even though one could argue that the differences in intra-cranial volumes in preHD compared with healthy volunteers needed a larger cohort than ours (Nopoulos et al., 2011). Despite such methodological advantages, we acknowledge several limitations of this study such as the cross-sectional design. Longitudinal studies could help answer the question whether cortical folding differences are related to rates of cortical or subcortical atrophy and to functional deterioration. We also acknowledge that findings derived from multiple regression models are based on uncorrected significance thresholds and should therefore be interpreted with caution. Finally, the CAG repeat length range was limited in the preHD sample, ranging from 38 to 48. It is possible that individuals with more expanded CAG repeats show more pronounced and more widespread CCF changes.
In conclusion, our data suggest a potential influence of the HTT CAG repeat expansion on cortical folding in areas of the motor and visual system as well as temporal cortical areas. The macrostructural evidence suggesting some influence of HTT on neurodevelopment does not necessarily allow for any conclusions to be drawn for what happens at the micro-structural level. Hence, it remains a possibility that mutant HTT affects e.g. dendritic arborisation, however, based on clinical impression any such influence does not seem clinically relevant. We found no association between the CCF measured by FD and the putamen atrophy that was clearly evident in preHD. This indicates that the HTT CAG-repeat expansion mutation may influence the processes governing cortical neurodevelopment; however, that influence seems independent of the events that lead to neurodegeneration. It has been reported that CAG repeat expansion may be phylogenetically relevant for brain development (Cattaneo et al., 2005), and, in humans, may have a non-linear influence on measures of intelligence (Lee et al., 2018). How the relationship of HTT CAG repeat length to cortical folding relates to the questions of the evolution of the human species remains speculative, and its association with brain function will require further work.
Acknowledgments
Acknowledgements
We thank all participants. R. C. W. was supported by a grant from the CHDI/High Q foundation, a non-for-profit organization dedicated to increase the understanding of Huntington's disease and to facilitate the development of new treatment strategies for this illness (http://www.highqfoundation.org/). This study received support from the European Huntington's Disease Network (EHDN, http://www.euro-hd.net/html/network).
Authors' role
-
1)
Research project: A. Conception, B. Organization, C. Execution;
-
2)
Statistical Analysis: A. Design, B. Execution, C. Review and Critique;
-
3)
Manuscript: A. Writing of the first draft, B. Review and Critique.
KMK: 1C, 2A, 2B, 2C, 3A.
MMS: 1C, 2A, 2B, 2C, 3A.
DH: 2C, 3B.
RCW: 1A, 1B, 1C, 2A, 2B, 2C, 3B.
MO: 1B, 1C, 2A, 2C, 3B.
Financial disclosures of all authors
KMK: none, MMS: none, DH: none, RCW: received speaker's honoraria from Otskua and Lundbeck, MO: none.
Funding sources
CHDI/High Q Foundation.
Declaration of Competing Interest
All the authors report no potential conflicts of interest relevant to this paper.
Footnotes
Supplementary data to this article can be found online at https://doi.org/10.1016/j.nicl.2019.101913.
Contributor Information
Robert Christian Wolf, Email: christian.wolf@med.uni-heidelberg.de.
Michael Orth, Email: michael.orth@uni-ulm.de.
Appendix A. Supplementary data
Supplementary material
Supplementary Figure 2
Supplementary Figure 3
References
- Awate S.P., Win L., Yushkevich P., Schultz R.T., Gee J.C. 3D cerebral cortical morphometry in autism: increased folding in children and adolescents in frontal, parietal, and temporal lobes. Med. Image Comput. Comput. Assist. Interv. 2008;11(Pt 1):559–567. doi: 10.1007/978-3-540-85988-8_67. [DOI] [PubMed] [Google Scholar]
- Barnat M., Le Friec J., Benstaali C., Humbert S. Huntingtin-mediated multipolar-bipolar transition of newborn cortical neurons is critical for their postnatal neuronal morphology. Neuron. 2017;93(1):99–114. doi: 10.1016/j.neuron.2016.11.035. [DOI] [PubMed] [Google Scholar]
- Blanton R.E., Levitt J.G., Thompson P.M., Narr K.L., Capetillo-Cunliffe L., Nobel A. Mapping cortical asymmetry and complexity patterns in normal children. Psychiatry Res. 2001;107(1):29–43. doi: 10.1016/s0925-4927(01)00091-9. [DOI] [PubMed] [Google Scholar]
- Braisch U., Hay B., Muche R., Rothenbacher D., Landwehrmeyer G.B., Long J.D. Identification of extreme motor phenotypes in Huntington's disease. Am. J. Med. Genet. B Neuropsychiatr. Genet. 2017;174(3):283–294. doi: 10.1002/ajmg.b.32514. [DOI] [PubMed] [Google Scholar]
- Budday S., Raybaud C., Kuhl E. A mechanical model predicts morphological abnormalities in the developing human brain. Sci. Rep. 2014;4:5644. doi: 10.1038/srep05644. [DOI] [PMC free article] [PubMed] [Google Scholar]
- Cattaneo E., Zuccato C., Tartari M. Normal huntingtin function: an alternative approach to Huntington's disease. Nat. Rev. Neurosci. 2005;6(12):919–930. doi: 10.1038/nrn1806. [DOI] [PubMed] [Google Scholar]
- Dahnke R., Yotter R.A., Gaser C. Cortical thickness and central surface estimation. Neuroimage. 2013;65:336–348. doi: 10.1016/j.neuroimage.2012.09.050. [DOI] [PubMed] [Google Scholar]
- Dietrich P., Shanmugasundaram R., Shuyu E., Dragatsis I. Congenital hydrocephalus associated with abnormal subcommissural organ in mice lacking huntingtin in Wnt1 cell lineages. Hum. Mol. Genet. 2009;18(1):142–150. doi: 10.1093/hmg/ddn324. [DOI] [PMC free article] [PubMed] [Google Scholar]
- Dogan I., Eickhoff S.B., Schulz J.B., Shah N.J., Laird A.R., Fox P.T. Consistent neurodegeneration and its association with clinical progression in Huntington's disease: a coordinate-based meta-analysis. Neurodegener. Dis. 2013;12(1):23–35. doi: 10.1159/000339528. [DOI] [PMC free article] [PubMed] [Google Scholar]
- Dragatsis I., Levine M.S., Zeitlin S. Inactivation of Hdh in the brain and testis results in progressive neurodegeneration and sterility in mice. Nat. Genet. 2000;26(3):300–306. doi: 10.1038/81593. [DOI] [PubMed] [Google Scholar]
- Dubois J., Lefevre J., Angleys H., Leroy F., Fischer C., Lebenberg J. The dynamics of cortical folding waves and prematurity-related deviations revealed by spatial and spectral analysis of gyrification. Neuroimage. 2019;185:934–946. doi: 10.1016/j.neuroimage.2018.03.005. (Jan 15, Epub 2018 Mar 6) [DOI] [PubMed] [Google Scholar]
- Gaser C., Luders E., Thompson P.M., Lee A.D., Dutton R.A., Geaga J.A. Increased local gyrification mapped in Williams syndrome. Neuroimage. 2006;33(1):46–54. doi: 10.1016/j.neuroimage.2006.06.018. [DOI] [PubMed] [Google Scholar]
- Gautam P., Anstey K.J., Wen W., Sachdey P.S., Cherbuin N. Cortical gyrification and its relationships with cortical volume, cortical thickness, and cognitive performance in healthy mid-life adults. Behav. Brain Res. 2015;287:331–339. doi: 10.1016/j.bbr.2015.03.018. [DOI] [PubMed] [Google Scholar]
- Gorges M., Muller H.P., Mayer I.M., Grupe G.S., Kammer T., Gron G. Intact sensory-motor network structure and function in far from onset premanifest Huntington's disease. Sci. Rep. 2017;7 doi: 10.1038/srep43841. [DOI] [PMC free article] [PubMed] [Google Scholar]
- Hill J., Inder T., Neil J., Dierker D., Harwell J., Van Essen D. Similar patterns of cortical expansion during human development and evolution. Proc. Natl. Acad. Sci. U. S. A. 2010;107(29):13135–13140. doi: 10.1073/pnas.1001229107. [DOI] [PMC free article] [PubMed] [Google Scholar]
- Hirjak D., Kubera K.M., Wolf R.C., Thomann A.K., Hell S.K., Seidl U. Local brain gyrification as a marker of neurological soft signs in schizophrenia. Behav. Brain Res. 2015;292:19–25. doi: 10.1016/j.bbr.2015.05.048. [DOI] [PubMed] [Google Scholar]
- Hirjak D., Wolf R.C., Paternoga I., Kubera K.M., Thomann A.K., Stieltjes B. Neuroanatomical markers of neurological soft signs in recent-onset schizophrenia and Asperger-syndrome. Brain Topogr. 2016;29(3):382–394. doi: 10.1007/s10548-015-0468-9. [DOI] [PubMed] [Google Scholar]
- Huntington-Study-Group Unified Huntington's disease rating scale: reliability and consistency. Mov. Disord. 1996;11:136–142. doi: 10.1002/mds.870110204. [DOI] [PubMed] [Google Scholar]
- Im K., Lee J.M., Yoon U., Shin Y.W., Hong S.B., Kim I.Y. Fractal dimension in human cortical surface: multiple regression analysis with cortical thickness, sulcal depth, and folding area. Hum. Brain Mapp. 2006;27(12):994–1003. doi: 10.1002/hbm.20238. [DOI] [PMC free article] [PubMed] [Google Scholar]
- Kalmanti E., Maris T.G. Fractal dimension as an index of brain cortical changes throughout life. In Vivo. 2007;21(4):641–646. [PubMed] [Google Scholar]
- Lee J.K., Mathews K., Schlaggar B., Perlmutter J., Paulsen J.S., Epping E. Measures of growth in children at risk for Huntington disease. Neurology. 2012;79(7):668–674. doi: 10.1212/WNL.0b013e3182648b65. [DOI] [PMC free article] [PubMed] [Google Scholar]
- Lee J.K., Conrad A., Epping E., Mathews K., Magnotta V., Dawson J.D. Effect of trinucleotide repeats in the Huntington's gene on intelligence. EBioMedicine. 2018;31:47–53. doi: 10.1016/j.ebiom.2018.03.031. [DOI] [PMC free article] [PubMed] [Google Scholar]
- McGarry A., Biglan K.M. Preclinical motor manifestations of Huntington disease. Handb. Clin. Neurol. 2017;144:93–98. doi: 10.1016/B978-0-12-801893-4.00007-9. [DOI] [PubMed] [Google Scholar]
- Nasir J., Floresco S.B., O'Kusky J.R., Diewert V.M., Richman J.M., Zeisler J. Targeted disruption of the Huntington's disease gene results in embryonic lethality and behavioral and morphological changes in heterozygotes. Cell. 1995;81(5):811–823. doi: 10.1016/0092-8674(95)90542-1. [DOI] [PubMed] [Google Scholar]
- Nenadic I., Yotter R.A., Sauer H., Gaser C. Cortical surface complexity in frontal and temporal areas varies across subgroups of schizophrenia. Hum. Brain Mapp. 2014;35(4):1691–1699. doi: 10.1002/hbm.22283. [DOI] [PMC free article] [PubMed] [Google Scholar]
- Nopoulos P., Magnotta V.A., Mikos A., Paulson H., Andreasen N.C., Paulsen J.S. Morphology of the cerebral cortex in preclinical Huntington's disease. Am. J. Psychiatry. 2007;164(9):1428–1434. doi: 10.1176/appi.ajp.2007.06081266. [DOI] [PubMed] [Google Scholar]
- Nopoulos P.C., Aylward E.H., Ross C.A., Johnson H.J., Magnotta V.A., Juhl A.R. Cerebral cortex structure in prodromal Huntington disease. Neurobiol. Dis. 2010;40(3):544–554. doi: 10.1016/j.nbd.2010.07.014. [DOI] [PMC free article] [PubMed] [Google Scholar]
- Nopoulos P.C., Aylward E.H., Ross C.A., Mills J.A., Langbehn D.R., Johnson H.J. Smaller intracranial volume in prodromal Huntington's disease: evidence for abnormal neurodevelopment. Brain. 2011;134(Pt 1):137–142. doi: 10.1093/brain/awq280. [DOI] [PMC free article] [PubMed] [Google Scholar]
- Paulsen J.S., Magnotta V.A., Mikos A.E., Paulson H.L., Penziner E., Andreasen N.C. Brain structure in preclinical Huntington's disease. Biol. Psychiatry. 2006;59(1):57–63. doi: 10.1016/j.biopsych.2005.06.003. [DOI] [PubMed] [Google Scholar]
- Penney J.B., Jr., Vonsattel J.P., MacDonald M.E., Gusella J.F., Myers R.H. CAG repeat number governs the development rate of pathology in Huntington's disease. Ann. Neurol. 1997;41(5):689–692. doi: 10.1002/ana.410410521. [DOI] [PubMed] [Google Scholar]
- Reiner A., Del Mar N., Meade C.A., Yang H., Dragatsis I., Zeitlin S. Neurons lacking huntingtin differentially colonize brain and survive in chimeric mice. J. Neurosci. 2001;21(19):7608–7619. doi: 10.1523/JNEUROSCI.21-19-07608.2001. [DOI] [PMC free article] [PubMed] [Google Scholar]
- Rosas H.D., Hevelone N.D., Zaleta A.K., Greve D.N., Salat D.H., Fischl B. Regional cortical thinning in preclinical Huntington disease and its relationship to cognition. Neurology. 2005;65(5):745–747. doi: 10.1212/01.wnl.0000174432.87383.87. [DOI] [PubMed] [Google Scholar]
- Ruiz de Miras J., Costumero V., Belloch V., Escudero J., Avila C., Sepulcre J. Complexity analysis of cortical surface detects changes in future Alzheimer's disease converters. Hum. Brain Mapp. 2017;38(12):5905–5918. doi: 10.1002/hbm.23773. [DOI] [PMC free article] [PubMed] [Google Scholar]
- Sandu A.L., Izard E., Specht K., Beneventi H., Lundervold A., Ystad M. Post-adolescent developmental changes in cortical complexity. Behav. Brain Funct. 2014;10:44. doi: 10.1186/1744-9081-10-44. [DOI] [PMC free article] [PubMed] [Google Scholar]
- Saudou F., Humbert S. The biology of Huntingtin. Neuron. 2016;89(5):910–926. doi: 10.1016/j.neuron.2016.02.003. [DOI] [PubMed] [Google Scholar]
- Schaer M., Cuadra M.B., Tamarit L., Lazeyras F., Eliez S., Thiran J.P. A surface-based approach to quantify local cortical gyrification. IEEE Trans. Med. Imaging. 2008;27(2):161–170. doi: 10.1109/TMI.2007.903576. [DOI] [PubMed] [Google Scholar]
- Tabrizi S.J., Langbehn D.R., Leavitt B.R., Roos R.A., Durr A., Craufurd D. Biological and clinical manifestations of Huntington's disease in the longitudinal TRACK-HD study: cross-sectional analysis of baseline data. Lancet Neurol. 2009;8(9):791–801. doi: 10.1016/S1474-4422(09)70170-X. [DOI] [PMC free article] [PubMed] [Google Scholar]
- Tabrizi S.J., Scahill R.I., Durr A., Roos R.A., Leavitt B.R., Jones R. Biological and clinical changes in premanifest and early stage Huntington's disease in the TRACK-HD study: the 12-month longitudinal analysis. Lancet Neurol. 2011;10(1):31–42. doi: 10.1016/S1474-4422(10)70276-3. [DOI] [PubMed] [Google Scholar]
- Van Essen D.C. A tension-based theory of morphogenesis and compact wiring in the central nervous system. Nature. 1997;385(6614):313–318. doi: 10.1038/385313a0. [DOI] [PubMed] [Google Scholar]
- Wang X., Studholme C., Grigsby P.L., Frias A.E., Cuzon Carlson V.C., Kroenke C.D. Folding, but not surface area expansion, is associated with cellular morphological maturation in the fetal cerebral cortex. J. Neurosci. 2017;37(8):1971–1983. doi: 10.1523/JNEUROSCI.3157-16.2017. [DOI] [PMC free article] [PubMed] [Google Scholar]
- White J.K., Auerbach W., Duyao M.P., Vonsattel J.P., Gusella J.F., Joyner A.L. Huntingtin is required for neurogenesis and is not impaired by the Huntington's disease CAG expansion. Nat. Genet. 1997;17(4):404–410. doi: 10.1038/ng1297-404. [DOI] [PubMed] [Google Scholar]
- Wolf R.C., Thomann P.A., Thomann A.K., Vasic N., Wolf N.D., Landwehrmeyer G.B. Brain structure in preclinical Huntington's disease: a multi-method approach. Neurodegener. Dis. 2013;12(1):13–22. doi: 10.1159/000338635. [DOI] [PubMed] [Google Scholar]
- Yotter R.A., Nenadic I., Ziegler G., Thompson P.M., Gaser C. Local cortical surface complexity maps from spherical harmonic reconstructions. Neuroimage. 2011;56(3):961–973. doi: 10.1016/j.neuroimage.2011.02.007. [DOI] [PubMed] [Google Scholar]
Associated Data
This section collects any data citations, data availability statements, or supplementary materials included in this article.
Supplementary Materials
Supplementary material
Supplementary Figure 2
Supplementary Figure 3