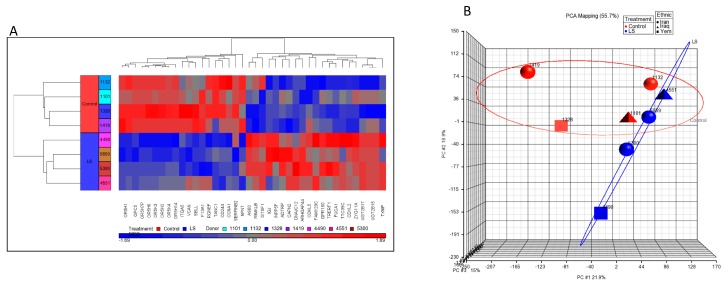
Figure 2.
Genome-wide profiling of LS patients. (a) Cluster analysis of differentially expressed genes in Epstein-Bar virus (EBV)-immortalized lymphoblastoids derived from four LS patients (four bottom rows, blue color) and four age-, gender-, and ethnicity-matched controls (four upper rows, red color). The figure depicts a cluster of 39 differentially expressed genes (fold change (FC) > 2 or < −2 and p value < 0.05). The names of the genes are presented in the x-axis. Up-regulated genes are shown in red and down-regulated genes are shown in blue. (b) Principal component analysis (PCA) display of four LS and four control arrays. Hierarchical cluster analysis was performed using Partek Genomics Suite software with Pearson’s dissimilarity correlation and average linkage methods. Data analysis was followed by one-way ANOVA. Blue circles: LS patients; red circles: controls. The figure was adapted from [55].

