Abstract
Viral infection triggers the formation of mitochondrial antiviral signaling protein (MAVS) aggregates, which potently promote immune signaling. Autophagy plays an important role in controlling MAVS‐mediated antiviral signaling; however, the exact molecular mechanism underlying the targeted autophagic degradation of MAVS remains unclear. Here, we investigated the mechanism by which RNF34 regulates immunity and mitophagy by targeting MAVS. RNF34 binds to MAVS in the mitochondrial compartment after viral infection and negatively regulates RIG‐I‐like receptor (RLR)‐mediated antiviral immunity. Moreover, RNF34 catalyzes the K27‐/K29‐linked ubiquitination of MAVS at Lys 297, 311, 348, and 362 Arg, which serves as a recognition signal for NDP52‐dependent autophagic degradation. Specifically, RNF34 initiates the K63‐ to K27‐linked ubiquitination transition on MAVS primarily at Lys 311, which facilitates the autophagic degradation of MAVS upon RIG‐I stimulation. Notably, RNF34 is required for the clearance of damaged mitochondria upon viral infection. Thus, we elucidated the mechanism by which RNF34‐mediated autophagic degradation of MAVS regulates the innate immune response, mitochondrial homeostasis, and infection.
Keywords: innate immune response, MAVS, RNF34, selective mitophagy, ubiquitination
Subject Categories: Microbiology, Virology & Host Pathogen Interaction; Signal Transduction
Introduction
Autophagy is an intracellular homeostatic process that degrades cytoplasmic proteins and organelles to provide nutrients in response to cellular metabolic stress (Mathew et al, 2007; Mizushima, 2007; Glick et al, 2010; Altman & Rathmell, 2012). During autophagy, double‐membrane vesicles called autophagosomes fuse with the lysosome for either bulk degradation of their contents or the selective degradation of target organelles, such as damaged mitochondria (Ashrafi & Schwarz, 2013; Shibutani & Yoshimori, 2014), in a process known as mitophagy. Mitophagy is an important subcellular process that maintains normal cellular homeostasis by eliminating damaged or excess mitochondria (Kanki & Klionsky, 2009).
The mitochondrion is the powerhouse of eukaryotic cells and plays important roles in ATP production, Ca2+ homeostasis, apoptosis, and the production of reactive oxygen species (ROS) (Camello‐Almaraz et al, 2006; Widlansky & Gutterman, 2011; Chandel, 2014). Many reports have revealed a fundamental role for the mitochondria in the antiviral immunity of vertebrates following the discovery of the mitochondrial antiviral signaling protein (MAVS) (Seth et al, 2005; Koshiba et al, 2011), also known as IPS‐1 (Kawai et al, 2005), VISA (Xu et al, 2005), and CARDIF (Meylan et al, 2005). MAVS acts as a common adaptor protein that links the cytoplasmic RNA sensor RIG‐I to their downstream signaling molecules (Yoneyama et al, 2004; Kato et al, 2006; Takeuchi & Akira, 2008; Moresco & Beutler, 2010). MAVS forms well‐ordered prion‐like aggregates to activate the NF‐κB and IRF3/5/7 cascades, resulting in the production of type I interferons (IFNs) and proinflammatory cytokines (Hou et al, 2011). Host cells have developed several strategies to inhibit MAVS and prevent the detrimental effects of excessive immune signaling (Karbowski et al, 2007). At the post‐transcriptional level, the translation of MAVS is initiated at two different translation start sites and results in expression of a shorter isoform of MAVS composed of 398 amino acids that lacks the CARD domain (mMAVS). Researchers have proposed that mMAVS functions as a negative regulator of the antiviral response. Several E3 ligases, including RNF125 (Arimoto et al, 2007), TRIM25 (Castanier et al, 2012), ITCH (You et al, 2009), Smurf1 (Wang et al, 2012), and MARCH8 (Jin et al, 2017; Jin & Cui, 2018), have been shown to attenuate innate immune responses to RNA viruses by promoting the K48‐ or K27‐linked polyubiquitination and degradation of MAVS. The mechanism by which MAVS aggregates are resolved has recently been elucidated. MARCH5, an E3 ubiquitin ligase, targets MAVS aggregates and promotes K48‐linked ubiquitination‐mediated proteasome degradation of MAVS (Yoo et al, 2015). However, the exact molecular mechanism targeting MAVS aggregates for autophagic degradation remains unclear.
Ubiquitination regulates mitophagy by controlling the stability of autophagy‐related proteins or by facilitating the recruitment of autophagy adaptors (Kuang et al, 2013). Autophagy adaptors, including SQSTM1, NBR1 (neighbor of the BRCA1 gene 1), HDAC6 (histone deacetylase 6), BNIP3L (autophagy receptor BH3‐only family protein), NDP52 (nuclear dot protein 52 kDa), and OPTN (optineurin), act as bridging molecules between ubiquitinated proteins and components of the autophagy machinery (Kanki, 2010; Lee et al, 2010; von Muhlinen et al, 2010; Moscat & Diaz‐Meco, 2011; Korac et al, 2013). Notably, protein aggregation or clearance by autophagy is affected by the type of ubiquitin linkage (Yao, 2010). Among all lysine residues (K6, K11, K27, K29, K33, K48, and K63) that serve as ubiquitination sites, K6‐, K27‐, K29‐ and K63‐linked chains have been shown to promote clearance of the substrate protein via the autophagy‐lysosomal pathway (Shaid et al, 2013). For example, K27‐linked ubiquitination of MAVS is recognized by NDP52 for selective autophagic degradation (Jin & Cui, 2018). Although multiple E3 ubiquitin ligases have been shown to regulate autophagy, the roles of ubiquitin ligases in maintaining the stability of the autophagy machinery or as upstream regulators are unclear.
Here, we investigated the mechanism by which RNF34 and MAVS coordinately regulate mitochondrial autophagy following viral infection. RNF34 is a cytosolic E3 ubiquitin ligase (Wei et al, 2012). Following the activation of RLRs by a viral infection, RNF34 binds to MAVS in the mitochondrial compartment and promotes its K63‐to‐K27 polyubiquitination transition. K27‐/K29‐linked ubiquitin chains on MAVS at Lys 297, 311, 348, and 362 Arg are recognized by the cargo receptor NDP52 and result in the recruitment of damaged mitochondria with enriched MAVS aggregates to the vacuole for autophagic degradation.
Results
RNF34 negatively regulates RLR signaling pathways
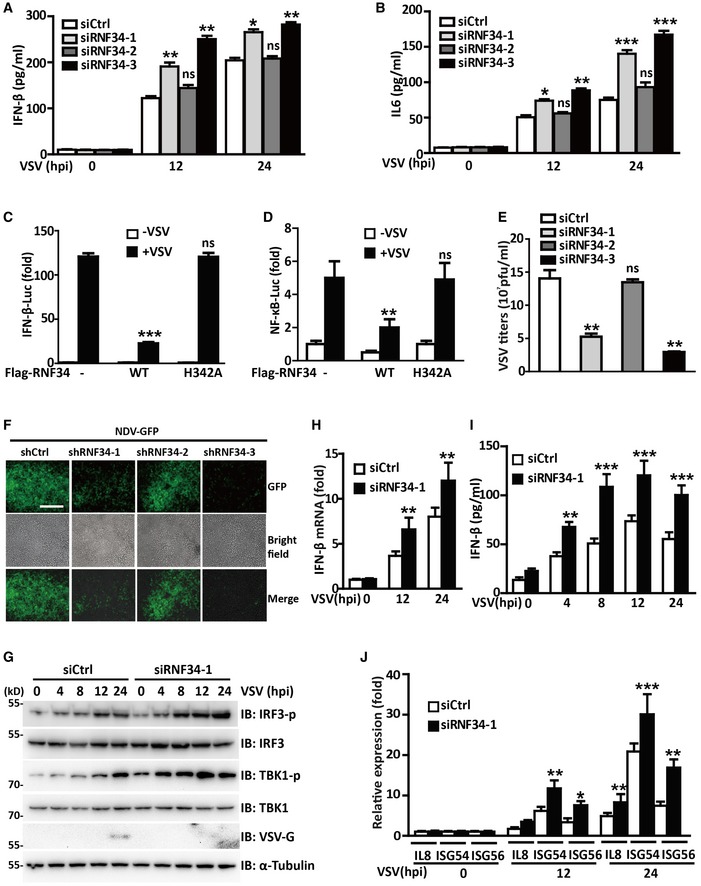
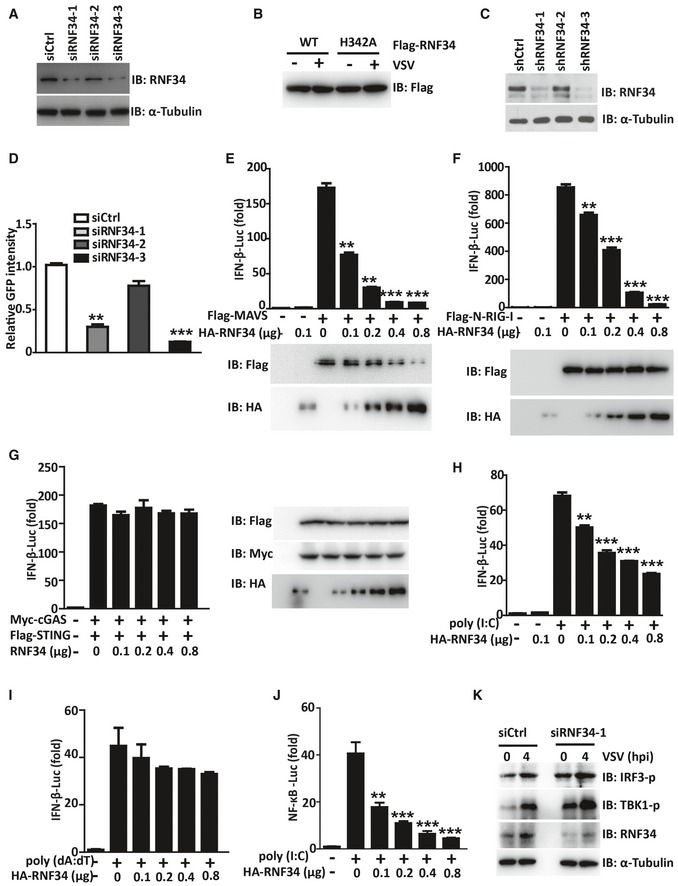
The RLR signaling pathway is tightly regulated to maximize antiviral immunity and minimize immune‐mediated pathology. RNF34 encodes a RING‐finger domain that is highly homologous to X‐chromosome‐linked inhibitor of apoptosis protein (XIAP/XIAP) (Konishi et al, 2005a). Multiple RING‐finger‐containing E3 ligases have been reported to be involved in RLR signaling pathways (Arimoto et al, 2007; Zhong et al, 2010; Wang et al, 2016; Lin et al, 2017); thus, we assessed the effects of RNF34 expression on IFN‐β activation. VSV‐induced IFN‐β and IL6 secretion was substantially increased in THP‐1 cells transfected with siRNF34‐1 and siRNF34‐3 RNAi oligos (Figs 1A and B and EV1A). Moreover, RNF34 substantially decreased IFN‐β and NF‐κB promoter activity in response to VSV infection, whereas the ectopic RNF34 H342A E3 ligase‐dead mutant showed compromised inhibition of VSV‐mediated IFN‐β and NF‐κB activation (Zhang et al, 2014) (Figs 1C and D and EV1B). Using the three siRNF34 oligo sequences described above (Fig EV1A), we generated three stable clones with RNF34 siRNA‐mediated knockdown, and the shRNF34‐1 and shRNF34‐3 clones showed a greater than 90% reduction in RNF34 expression (Fig EV1C). Both the shRNF34‐1 and shRNF34‐3 clones displayed lower VSV titers than cells expressing the control shRNA (shCtrl) or shRNF34‐2 (Fig 1E). Consistent with these findings, NDV‐GFP replication was substantially reduced in shRNF34‐1 and shRNF34‐3 clones (Figs 1F and EV1D). These results indicated that the E3 ubiquitin ligase function of RNF34 negatively regulates antiviral responses.
Figure 1. RNF34 negatively regulates RLR signaling pathways.
-
A, BResults of the ELISAs used to determine IFN‐β (A) and IL6 (B) secretion in PMA‐differentiated THP‐1 cells transfected with siCtrl, siRNF34‐1, siRNF34‐2, or siRNF34‐3 oligos and infected with VSV for the indicated times.
-
C, DLuciferase activity driven by the IFN‐β (C) or NF‐κB (D) promoter in HEK293T cells transfected with Flag‐RNF34 or its E3 ligase‐dead mutant H342A followed by VSV infection for the indicated times. Luciferase assays were performed 24 h after transfection, and luciferase activity was reported as the fold induction.
-
EPlaque assay of VSV loads in supernatants from cells transfected with shCtrl, shRNF34‐1, shRNF34‐2, or shRNF34‐3 and subsequently infected with VSV.
-
FMicroscopy images of shCtrl, shRNF34‐1, shRNF34‐2, or shRNF34‐3 cells infected with NDV‐GFP (MOI = 1.0) for the indicated times. Gray represents cells; green represents NDV. Scale bar, 300 μm.
-
GImmunoblot showing the levels of the phosphorylated (p) and total IRF3, TBK1, and VSV‐G proteins in PMA‐differentiated THP‐1 cells transfected with siCtrl or siRNF34‐1 oligos and infected with VSV for the indicated times.
-
H, JRT–PCR analysis of the expression of the IFN‐β (H), IL8, ISG54, and ISG56 (J) mRNAs in PBMCs transfected with siCtrl or siRNF34‐1 oligos and infected with VSV for the indicated times. The results were normalized to the values obtained prior to VSV infection.
-
IResults of the ELISA used to determine IFN‐β secretion in PBMCs transfected with siCtrl or siRNF34‐1 oligos and infected with VSV for the indicated times.
Figure EV1. RNF34 negatively regulates RLR signaling pathways.
-
AImmunoblot showing RNF34 levels in the PMA‐differentiated THP‐1 cells transfected with siCtrl, siRNF34‐1, siRNF34‐2, or siRNF34‐3 oligos shown in Fig 1A and B.
-
BImmunoblot showing Flag‐RNF34 and Flag‐RNF34 H342A levels in the cells presented in Fig 1C and D. α‐Tubulin was used as a loading control.
-
CImmunoblot showing RNF34 levels in the control (shCtrl) and three stable RNF34‐knockdown (shRNF34‐1, shRNF34‐2, and shRNF34‐3) HEK293T cell lines shown in Fig 1E and F.
-
DNDV‐GFP replication was defined as the product of the mean fluorescence intensity of GFP‐positive cells in shRNF34‐1, shRNF34‐2, or shRNF34‐3 cells and the mean fluorescence intensity of shCtr cells.
-
E‐I(E, F, H) Luciferase activity driven by the IFN‐β promoter in HEK293T cells transfected with Flag‐MAVS (E), Flag‐N‐RIG‐I (F), or poly(I:C) (10 μg/ml; H) together with increasing amounts of the HA‐RNF34 expression vector. Luciferase assays were performed 24 h after transfection, and luciferase activity was reported as the fold induction. (G, I) Luciferase activity driven by the IFN‐β promoter in HEK293T cells transfected with Flag‐STING and Myc‐cGAS (G), or (dAT:dT) (10 μg/ml; I) together with increasing amounts of the HA‐RNF34 expression vector. Luciferase assays were performed 24 h after transfection, and luciferase activity was reported as the fold induction.
-
JLuciferase activity driven by the NF‐κB promoter in HEK293T cells transfected with poly(I:C) together with increasing amounts of the HA‐RNF34 expression vector. Luciferase assays were performed 24 h after transfection, and luciferase activity was reported as the fold induction.
-
KImmunoblot showing the levels of the phosphorylated (‐p) and total IRF3, TBK1, and RNF34 proteins in PBMCs transfected with siCtrl or siRNF34‐1 oligos and infected with VSV for the indicated times.
We then performed a luciferase assay using the IFN‐β promoter to determine whether RNF34 is involved in regulating RNA virus‐ or DNA virus‐induced type I IFN signaling. RNF34 specifically inhibited MAVS‐ or RIG‐I 2CARD (N‐RIG‐I)‐mediated (Fig EV1E and F) but not viral DNA sensor cGAS/STING‐mediated IFN‐β activation in a dose‐dependent manner (Fig EV1G). Furthermore, we delivered the synthetic dsRNA analog poly(I:C) or dsDNA analog poly(dA:dT) into the cytoplasm by transfection; RNF34 inhibited the poly(I:C)‐induced activation of the IFN‐β reporter in a dose‐dependent manner (Fig EV1H), but had no effect on poly(dA:dT)‐induced activation (Fig EV1I). Similarly, RNF34 repressed N‐RIG‐I‐induced activation of NF‐κB reporter (Fig EV1J).
To further delineate the physiological role of RNF34, THP‐1 cells and human peripheral blood mononuclear cells (PBMCs) were used. RNF34 deficiency dramatically increased TBK1 and IRF3 phosphorylation in response to VSV infection in both cell lines (Figs 1G and EV1K). RNF34 knockdown decreased VSV‐triggered IFN‐β production at both the mRNA and protein levels (Fig 1H and I). In addition, RNF34 knockdown significantly decreased the expression of IL8, ISG54, and ISG56 upon VSV infection compared with cells transfected with the control scramble siRNA (Fig 1J). As expected, lower VSV‐G expression was observed in siRNF34‐transfected THP‐1 cells (Fig 1G). Taken together, these results suggested that RNF34 is a negative regulator of RLR‐mediated type I IFN signaling.
RNF34 interacts with MAVS
We next examined the effects of RNF34 on ISRE activation mediated by N‐RIG‐I, MAVS, STING, and TBK1 to determine the potential target of RNF34 in the RLR signaling pathway. In reporter assays, RNF34 overexpression inhibited N‐RIG‐I‐ and MAVS‐mediated ISRE activation, while ISRE activation mediated by STING and TBK1 was not inhibited (Figs 2A and EV2A). Co‐immunoprecipitation (Fig EV2B) and immunoblotting assays (Fig EV2C) showed that although RNF34 interacted with MAVS and RIG‐I, only the level of the MAVS protein was substantially reduced by RNF34. Thus, RNF34 might target MAVS. Consistent with these findings, yeast two‐hybrid (Y2H) screening approaches revealed the interaction between RNF34 and MAVS (Fig 2B). To further confirm their interaction, we co‐transfected Flag‐tagged MAVS and Myc‐tagged RNF34 into HEK293T cells, and a co‐immunoprecipitation experiment was performed (Fig 2C). Myc‐tagged RNF34 was detected in the anti‐Flag immunoprecipitate from cells co‐transfected with Flag‐MAVS, but not with a negative control Flag‐vector. Glutathione S‐transferase (GST) pull‐down assays revealed a direct interaction between RNF34 and MAVS in vitro (Fig 2D). The specificity of the interaction between MAVS and RNF34 was also confirmed by a far‐Western analysis (Fig 2E). Immunofluorescence staining showed low levels of colocalization between RNF34 and MAVS even in the absence of VSV infection, while the VSV infection increased colocalization of RNF34 with MAVS in the mitochondrial compartment (Figs 2F and EV2D). Notably, the levels of the RNF34 protein were significantly increased beginning at 6 h post‐infection (hpi) with VSV (Fig 2G). Additionally, we visualized the formation of the RNF34‐MAVS complex using an in situ proximity ligation assay (PLA). The number of spots representing the RNF34‐MAVS complex increased significantly at 6 hpi and began to decrease at 24 hpi (Fig 2H and I).
Figure 2. RNF34 interacts with MAVS.
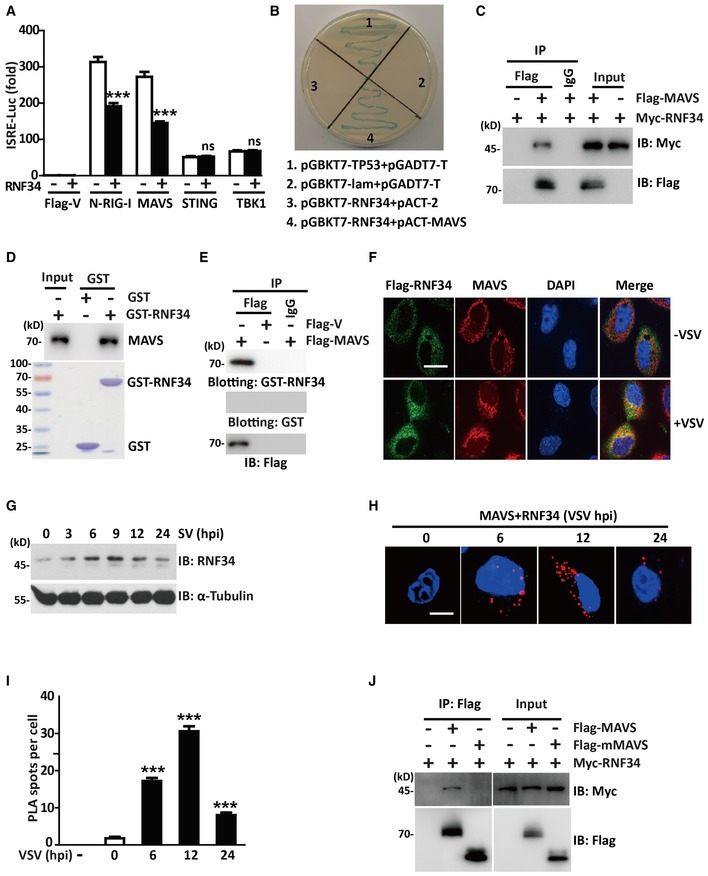
- Luciferase activity driven by the ISRE promoter in HEK293T cells transfected with Myc‐RNF34 and Flag‐V, Flag‐N‐RIG‐I, Flag‐MAVS, Flag‐STING, or Flag‐TBK1. Luciferase assays were performed 24 h after transfection.
- Y2H analysis in the AH109 yeast strain co‐transformed with the indicated plasmids. A positive RNF34‐MAVS interaction resulted in colony formation on synthetic medium lacking tryptophan, leucine, adenine, and histidine containing X‐gal. pGBKT7‐TP53 + pGADT7‐T and pGBKT7‐lam+pGADT7‐T were used as positive and negative controls, respectively. AH109 co‐transfected with pGBKT7‐RNF34 + pACT‐2 was used to exclude the self‐activation of RNF34.
- Immunoprecipitation analysis of HEK293T cells transfected with Myc‐RNF34 and Flag‐MAVS or Flag‐V. Anti‐Flag or IgG agarose immunoprecipitates were analyzed using immunoblotting with an anti‐Myc or anti‐Flag antibody.
- GST‐tagged RNF34 was subjected to a pull‐down assay with HEK293T cell lysates. Immunoblot with an anti‐MAVS antibody is shown in the top panel. Loading of the GST proteins assessed using Coomassie blue staining is shown in the bottom panel. GST was used as a negative control.
- Anti‐Flag or IgG immunoprecipitates prepared from cells transfected with Flag‐MAVS or Flag‐vector‐expressing plasmids were subjected to SDS–PAGE and blotted onto a nitrocellulose membrane. The nitrocellulose membrane was incubated with soluble GST‐RNF34 (upper panel) or GST (middle panel) for 2 h and then analyzed with anti‐Flag antibody.
- Representative confocal images of immunofluorescence staining for Flag‐RNF34 colocalization with endogenous MAVS in THP‐1 cells infected with VSV for 12 h. Scale bar, 10 μm.
- Immunoblot showing the levels of the RNF34 protein in THP‐1 cells infected with VSV (MOI = 1.0) for the indicated times. α‐Tubulin was used as a loading control.
- In situ PLA assay of the RNF34‐MAVS complex in HEK293T cells infected with VSV (MOI = 1.0) for the indicated times using an anti‐RNF34 or anti‐MAVS antibody. RNF34‐MAVS complex, red; nuclei, blue. Scale bar, 5 μm.
- One hundred cells in Fig 2H were counted, and the quantification of PLA signals per cell is shown.
- Immunoprecipitation analysis of HEK293T cells transfected with Myc‐RNF34 and Flag‐MAVS or Flag‐mMAVS. Anti‐Flag immunoprecipitates were analyzed using immunoblotting with anti‐Myc or anti‐Flag antibody.
Figure EV2. RNF34 interacts with MAVS and enhances the K27‐/K29‐linked ubiquitination of MAVS.
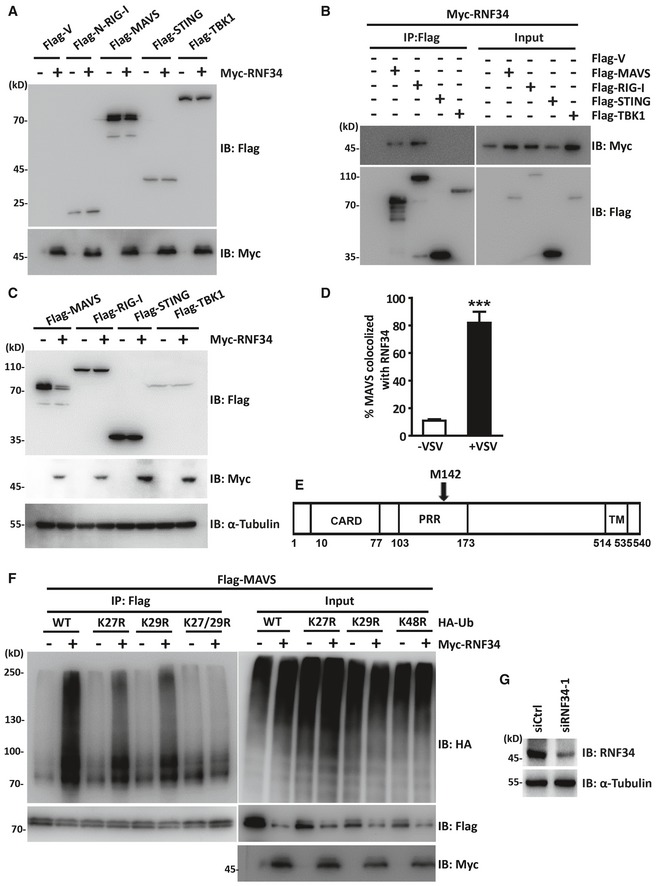
- Immunoblot showing the levels of HA‐RNF34 and Flag‐N‐RIG‐I, Flag‐MAVS, Flag‐STING, and Flag‐TBK1 in the cells shown in Fig 2A.
- Immunoprecipitation analysis of HEK293T cells transfected with Myc‐RNF34 together with Flag‐V, Flag‐MAVS, Flag‐RIG‐I, Flag‐STING, or Flag‐TBK1. Anti‐Flag or IgG agarose immunoprecipitates were analyzed using immunoblotting with an anti‐Myc or anti‐Flag antibody.
- Immunoblot showing the levels of MAVS, RIG‐I, STING, and TBK1 in HEK293T cells transfected with the Myc‐vector (Myc‐V) or Myc‐RNF34.
- Quantification of MAVS colocalization with RNF34 in Fig 2F.
- Schematic of MAVS along with predicted translation product mMAVS with the start site corresponding to Met 142.
- Immunoprecipitation analysis of HEK293T cells expressing Flag‐MAVS and Myc‐RNF34 together with HA‐Ub (WT; K27R; K29R; K27/29R). Anti‐Flag immunoprecipitates were analyzed using immunoblotting with an anti‐HA or anti‐Flag antibody. Levels of the transfected proteins were analyzed using immunoblotting with an anti‐HA, anti‐Myc, or anti‐Flag antibody.
- Immunoblot showing levels of the RNF34 protein in cells transfected with the control siRNA and RNF34 siRNA‐1 shown in Fig 3F. α‐Tubulin was used as a loading control.
The MAVS mRNA is a bicistronic mRNA encoding MAVS and a truncated mMAVS protein that differ by 142 amino acid residues (Brubaker et al, 2014). mMAVS restricts MAVS‐induced antiviral responses without being a component of MAVS aggregates or regulating the formation of MAVS aggregates. We generated a MAVS truncation mutant (mMAVS) to determine whether RNF34 interacts with distinct MAVS isoforms (Fig EV2E). RNF34 failed to interact with mMAVS (Fig 2J).
RNF34 enhances the K27‐/K29‐linked ubiquitination of MAVS
We co‐expressed HA‐RNF34 WT or the E3 ligase‐dead mutant H342A with Myc‐ubiquitin (Myc‐Ub) and Flag‐MAVS to determine whether RNF34 catalyzes the ubiquitination of MAVS. WT RNF34 overexpression substantially increased MAVS ubiquitination compared with the H342A mutant (Fig 3A), suggesting that the E3 ubiquitin ligase activity of RNF34 is required for MAVS ubiquitination.
Figure 3. RNF34 enhances the K27‐/K29‐linked ubiquitination of MAVS.
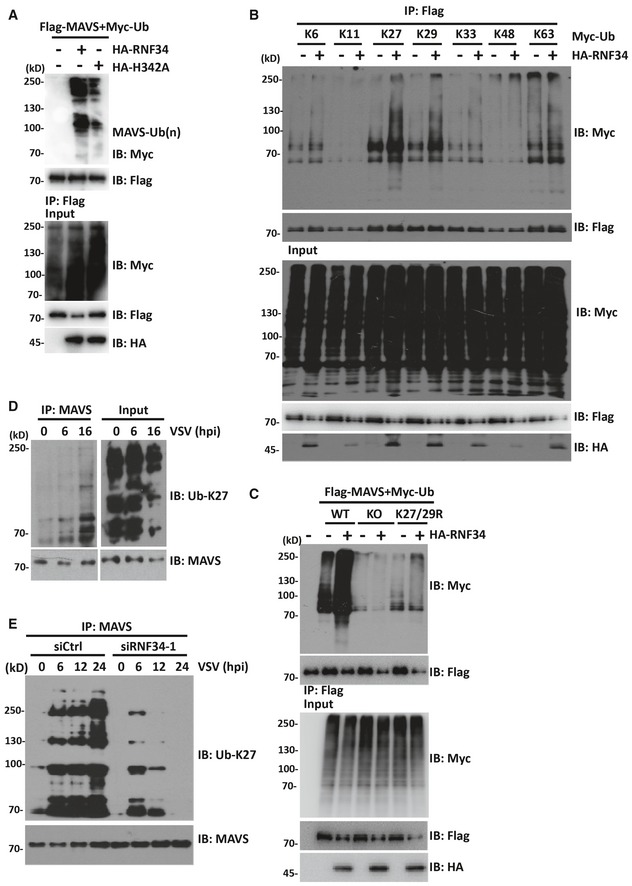
- Immunoprecipitation analysis in HEK293T cells expressing Flag‐MAVS and Myc‐Ub together with HA‐RNF34 or HA‐H342A. Anti‐Flag immunoprecipitates were analyzed using immunoblotting with an anti‐Myc or anti‐Flag antibody. The levels of the transfected proteins were analyzed using immunoblotting with an anti‐HA, anti‐Myc, or anti‐Flag antibody.
- Immunoprecipitation analysis of HEK293T cells expressing Flag‐MAVS and HA‐RNF34 together with Myc‐Ub (K6, K11, K27, K29, K33, K48, or K63 only) as indicated. Anti‐Flag immunoprecipitates were analyzed using immunoblotting with an anti‐Myc or anti‐Flag antibody. Levels of the transfected proteins were analyzed using immunoblotting with an anti‐HA, anti‐Myc, or anti‐Flag antibody.
- Immunoprecipitation analysis of HEK293T cells expressing Flag‐MAVS and HA‐RNF34 together with Myc‐Ub (wild‐type, WT; Lys‐to‐Arg mutants of all Ub lysines, KO; K27/29R). Anti‐Flag immunoprecipitates were analyzed using immunoblotting with an anti‐Myc or anti‐Flag antibody. Levels of the transfected proteins were analyzed using immunoblotting with an anti‐HA, anti‐Myc, or anti‐Flag antibody.
- Immunoprecipitation analysis of K27 ubiquitination of MAVS in HEK293T cells infected with VSV for the indicated times. Anti‐MAVS immunoprecipitates were analyzed using immunoblotting with an anti‐MAVS or anti‐Ub‐K27 antibody. The WCL was immunoblotted with an anti‐MAVS or anti‐Ub‐K27 antibody.
- Immunoprecipitation analysis of siCtrl‐ or siRNF34‐1‐transfected cells infected with VSV for the indicated times. Anti‐MAVS immunoprecipitates were analyzed using immunoblotting with an anti‐MAVS or anti‐Ub‐K27 antibody. The WCL was immunoblotted with an anti‐MAVS or anti‐Ub‐K27 antibody.
We co‐expressed Myc‐tagged ubiquitin mutants with Flag‐MAVS in the absence or presence of RNF34 to characterize the RNF34‐mediated linkage of ubiquitin chains on MAVS. Immunoprecipitation assays showed that RNF34 predominantly catalyzed the ubiquitination of MAVS by adding ubiquitin containing a lysine residue at position 27 or 29 (all others were substituted for arginine), but at very low levels with ubiquitin containing a lysine residue at position 6, 11, 33, 48, or 63 alone (Fig 3B). Similarly, overexpression of RNF34 failed to induce MAVS polyubiquitination in knockout (KO) or K27/K29R mutants, in which lysines at positions 27 and 29 (K27/29R) were mutated or all the lysines were substituted with arginine (KO) (Figs 3C and EV2F). As no commercial K29 linkage‐specific ubiquitin antibody is available, endogenous MAVS K27 ubiquitin linkages were detected. Endogenous MAVS was immunoprecipitated with an anti‐MAVS antibody at different time points after VSV infection, and K27 ubiquitination was detected with a specific anti‐K27 ubiquitin antibody. As shown in Fig 3D, MAVS was modified by K27 ubiquitination as early as 6 hpi. Notably, the formation of K27 polyubiquitin (poly‐Ub) chains on MAVS was also significantly reduced in siRNF34‐1‐transfected cells (Figs 3E and EV2G), suggesting that RNF34 is the major E3 ubiquitin ligase that catalyzes MAVS K27 ubiquitination.
RNF34 initiates the K63‐ to K27‐linked polyubiquitination transition on MAVS
We next investigated the possible RNF34‐mediated ubiquitination sites on MAVS. Ubiquitinated MAVS was precipitated and subjected to tryptic digestion followed by a mass spectrometry (MS) analysis. Altogether, 4 Lys residues in MAVS were ubiquitinated in vitro (Fig EV3A and B). We generated four mutants bearing single Lys‐to‐Arg substitutions in every potential ubiquitination site to further confirm that these Lys residues in MAVS were major ubiquitination sites. According to the results of the immunoprecipitation assays, ubiquitin conjugation to the MAVS Lys 297, 311, 348, and 362 Arg mutants was significantly reduced compared with WT MAVS (Fig 4A). Next, we generated a MAVS mutant bearing these four Lys‐to‐Arg substitutions. As shown in Fig 4B, RNF34‐catalyzed K27 ubiquitination of the MAVS 4KR mutant was almost completely abolished, indicating that Lys 297, 311, 348, and 362 Arg in MAVS may be the major sites of RNF34‐mediated ubiquitination.
Figure EV3. RNF34 transfers ubiquitin to Lys 297, 311, 348, and 362 Arg in MAVS.
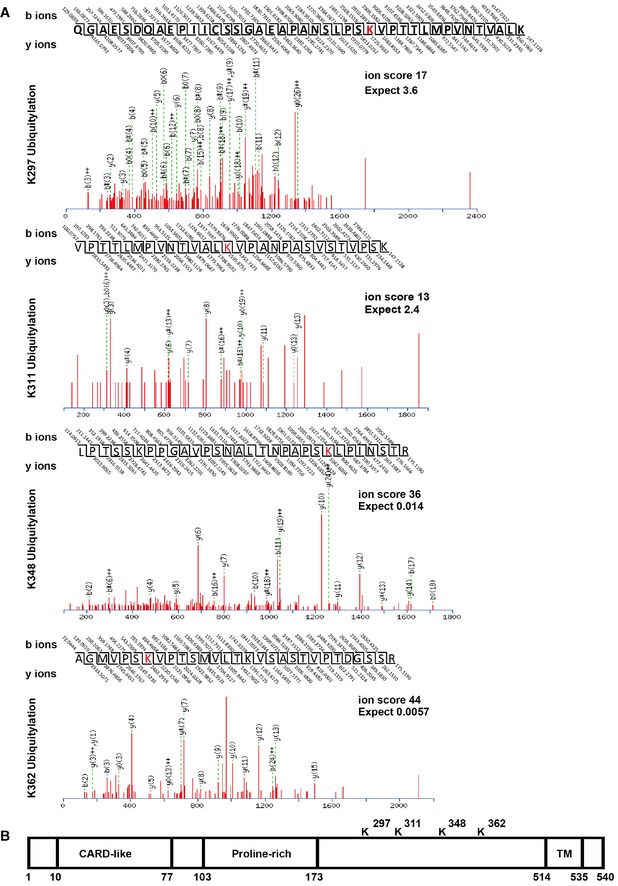
- MS analyses were performed on MAVS recovered from an in vitro ubiquitination assay.
- Schematic showing the distribution of the four Lys residues in MAVS that are ubiquitinated by RNF34. MS analyses were performed on MAVS recovered from an ubiquitination assay.
Figure 4. RNF34 initiates the K63‐ to K27‐linked polyubiquitination transition on MAVS.
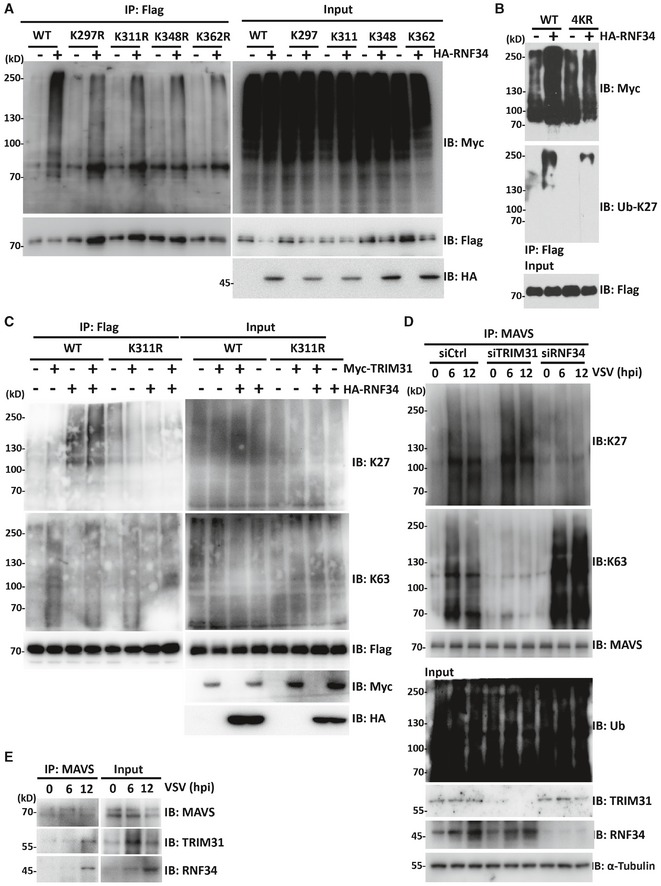
- Immunoprecipitation analysis of HEK293T cells expressing Flag‐MAVS or Lys to Arg mutants together with Myc‐Ub and HA‐RNF34. Anti‐Flag immunoprecipitates were analyzed using immunoblotting with an anti‐Myc or anti‐Flag antibody. Levels of the transfected proteins were analyzed using immunoblotting with an anti‐HA, anti‐Myc, or anti‐Flag antibody.
- Immunoprecipitation analysis of HEK293T cells expressing Flag‐MAVS or 4KR mutant together with Myc‐Ub and HA‐RNF34. Anti‐Flag immunoprecipitates were analyzed using immunoblotting with an anti‐Myc or anti‐Ub‐K27 antibody. Levels of the transfected proteins were analyzed by performing immunoblotting with an anti‐Flag antibody.
- Immunoprecipitation analysis of HEK293T cells expressing Flag‐MAVS or K311R mutant together with HA‐RNF34 and/or Myc‐TRIM31 following a 3MA (0.2 mM) treatment. Anti‐Flag immunoprecipitates were analyzed using immunoblotting with an anti‐Flag, anti‐Ub‐K63, or anti‐Ub‐K27 antibody. Levels of the transfected proteins were analyzed using immunoblotting with an anti‐HA or anti‐Flag antibody.
- Co‐immunoprecipitation analysis of the ubiquitination of endogenous MAVS in THP‐1 cells transfected with siCtrl, siRNF34, or siTRIM31 oligos and infected with VSV for the indicated times.
- Co‐immunoprecipitation analysis of the endogenous interaction of MAVS‐TRIM31 and MAVS‐RNF34 in PBMCs infected with VSV for the indicated times.
TRIM31 catalyzes the K63‐linked polyubiquitination of MAVS at Lys 10, 311 and 461 to promote the formation of MAVS aggregates after viral infection (Brubaker et al, 2014). Since Lys 311 is also required for efficient RNF34‐mediated K27‐ubiquitination, we proposed that RNF34 may initiate the K63 to K27 polyubiquitination transition on MAVS at Lys 311. To test this hypothesis, we first investigated the effect of RNF34 on the K63‐linked ubiquitination of MAVS catalyzed by TRIM31 with 3MA treatment. Overexpression of TRIM31 or RNF34 markedly promoted the K63‐ and K27‐linked ubiquitination of MAVS, respectively (Fig 4C). Notably, the K63‐linked ubiquitination of MAVS catalyzed by TRIM31 was dramatically reduced by RNF34 overexpression, whereas the K27‐linked polyubiquitination of MAVS induced by RNF34 was unaffected by TRIM31. Moreover, RNF34 overexpression decreased the K63‐linked polyubiquitination of MAVS, but had little effect on MAVS K311R mutant (Fig 4C). We then analyzed the effects of RNF34 and TRIM31 on the pattern of endogenous MAVS polyubiquitination in VSV‐infected THP‐1 macrophages. Interestingly, VSV infection enhanced the K63‐ and K27‐linked ubiquitination of MAVS at 6 hpi. The levels of K63‐linked ubiquitinated MAVS were significantly reduced by TRIM31 silencing, while silencing of RNF34 significantly decreased the levels of K27‐linked ubiquitinated MAVS. Specifically, the levels of K63‐linked ubiquitinated MAVS were further accumulated upon RNF34 silencing (Fig 4D). Results of co‐immunoprecipitation analysis revealed endogenous TRIM31, RNF34, and MAVS formed a complex in PBMCs after infection with VSV (Fig 4E). Together, these data indicated that RNF34 initiates the K63‐ to K27‐linked polyubiquitination transition on MAVS primarily at Lys 311.
RNF34 promotes the autophagic degradation of MAVS aggregates
As the K27/K29 ubiquitin linkage correlates with the autophagic degradation of proteins (Kraft et al, 2010), we next investigated the biological consequences of RNF34‐mediated ubiquitination of MAVS. Therefore, the autophagy inhibitor 3‐methyladenine (3‐MA), autolysosome inhibitor NH4Cl, or proteasome inhibitor MG132 was used. Indeed, levels of the MAVS protein were substantially decreased in response to VSV infection (Fig 5A), while the NH4Cl or 3MA incubation (Figs 5B and EV4A) led to MAVS accumulation after VSV infection. Similarly, ATG5 and ATG7 knockdown partially blocked RNF34‐induced MAVS degradation (Fig EV4B and D). Therefore, autophagosomal pathways mediated the degradation of MAVS following viral infection.
Figure 5. RNF34 promotes the autophagic degradation of MAVS aggregates.
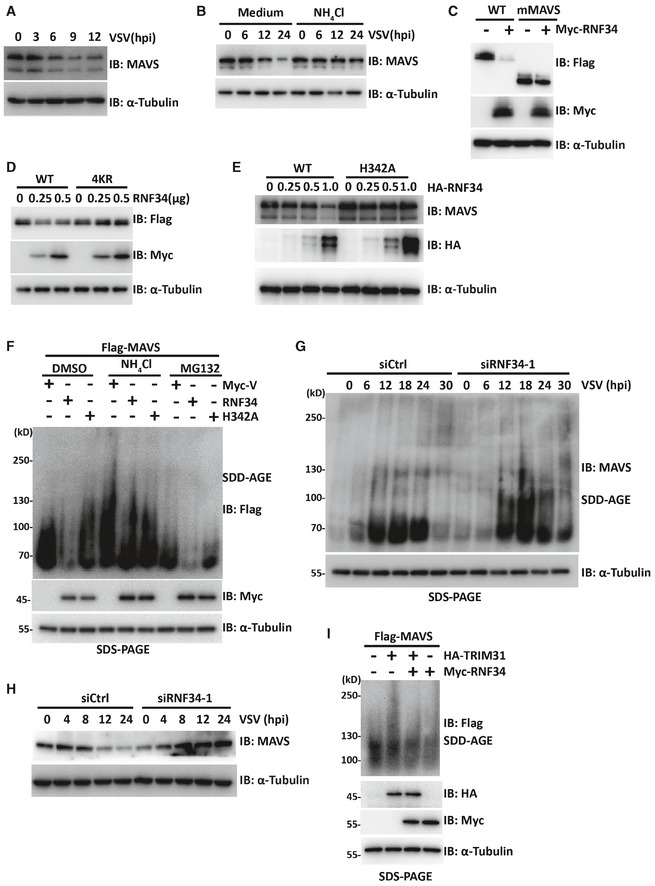
- Immunoblot showing the degradation of MAVS in HEK293T cells subjected to VSV infection (MOI = 1.0) for the indicated times. α‐Tubulin was used as a loading control.
- Immunoblot showing the degradation of MAVS in HEK293T cells infected with VSV (MOI = 1.0) for the indicated times in the presence or absence of NH4Cl (3 mM). α‐Tubulin was used as a loading control.
- Immunoblot showing the levels of the MAVS protein in HEK293T cells expressing Flag‐MAVS or Flag‐mMAVS together with Myc‐RNF34. α‐Tubulin was used as a loading control.
- Immunoblot showing the levels of the MAVS protein in HEK293T cells expressing Flag‐MAVS or its 4KR mutant together with increasing amounts of Myc‐RNF34. α‐Tubulin was used as a loading control.
- Immunoblot showing the levels of the MAVS protein in HEK293T cells expressing Flag‐MAVS with increasing amounts of HA‐RNF34 or its H342A mutant. α‐Tubulin was used as a loading control.
- SDD‐AGE analysis of MAVS aggregates in HEK293T cells expressing Flag‐MAVS together with WT Myc‐RNF34 or its ligase‐dead mutant and cultured in the presence or absence of MG132 (10 μM), 3‐MA (1 mM), or NH4Cl (3 mM). SDS–PAGE immunoblotting was used as a loading control.
- SDD‐AGE analysis of MAVS aggregates in siCtrl‐ or siRNF34‐1‐transfected cells using an anti‐MAVS antibody. SDS–PAGE immunoblotting was used as a loading control.
- Immunoblot showing the levels of the MAVS protein in siCtrl‐ or siRNF34‐1‐transfected PBMCs. α‐Tubulin was used as a loading control.
- SDD‐AGE analysis of MAVS aggregates in THP‐1 cells expressing Flag‐MAVS or the K311R mutant together with Myc‐RNF34 or Myc‐TRIM31. SDS–PAGE immunoblotting was used as a loading control.
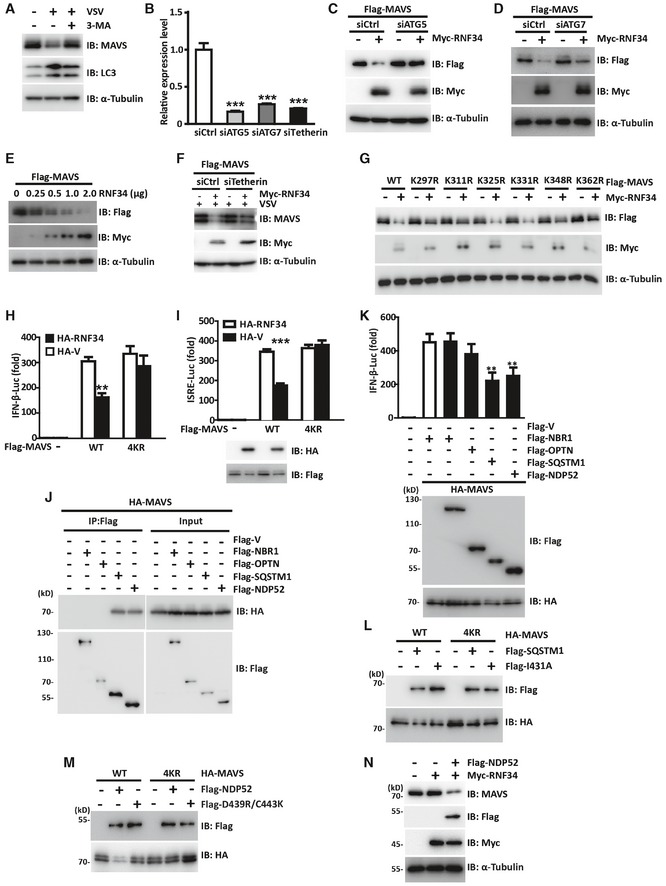
Figure EV4. RNF34‐mediated autophagic degradation of MAVS is facilitated by NDP52.
-
AImmunoblot showing levels of MAVS, RNF34, and LC3 in THP‐1 cells infected with VSV for 9 h in the presence or absence of 3‐MA (1 mM). α‐Tubulin was used as a loading control.
-
BThe efficiency of ATG5, ATG7, or tetherin knockdown was assayed using RT–PCR. The target gene was normalized to the ACTB gene.
-
C, DImmunoblot showing MAVS levels in ATG5‐ (C) or ATG7‐knockdown (D) cells transfected with Myc‐RNF34. α‐Tubulin was used as a loading control.
-
EImmunoblot showing Flag‐MAVS levels in HEK293T cells expressing Flag‐MAVS together with increasing amounts of Myc‐RNF34. α‐Tubulin was used as a loading control.
-
FImmunoblot showing Flag‐MAVS levels in siCtrl or siTetherin cells infected with or without VSV. α‐Tubulin was used as a loading control.
-
GImmunoblot showing levels of the MAVS protein in HEK293T cells expressing Flag‐MAVS or its KR mutants together with Myc‐RNF34. α‐Tubulin was used as a loading control.
-
H, ILuciferase activity driven by the IFN‐β (I) or ISRE (J) promoter in HEK293T cells transfected with Myc‐RNF34 together with Flag‐MAVS or 4KR and subsequently infected with VSV for 12 h.
-
JImmunoprecipitation analysis of HEK293T cells transfected with Flag‐NBR1, Flag‐OPTN,Flag‐SQSTM1, and Flag‐OPTN together with HA‐MAVS. Anti‐Flag immunoprecipitates were analyzed using immunoblotting with an anti‐HA or anti‐Flag antibody.
-
KLuciferase activity driven by the IFN‐β promoter in HEK293T cells transfected with HA‐MAVS together with Flag‐NBR1, Flag‐OPTN, Flag‐SQSTM1 or Flag‐NDP52 (top panel). Immunoblotting analysis of loading controls (lower panel).
-
LImmunoblotting analysis of loading controls for the experiments shown in Fig 6B.
-
MImmunoblotting analysis of loading controls for the experiments shown in Fig 6D.
-
NImmunoblot showing levels of the MAVS protein in MEFs expressing Flag‐NDP52 together with Myc‐RNF34. α‐Tubulin was used as a loading control.
The effect of RNF34 on MAVS expression was then determined. When HEK293T cells were transfected with increasing amounts of a plasmid encoding WT RNF34, a striking reduction in the MAVS levels was observed (Fig EV4E). Recently, tetherin was reported to promote the ubiquitination of MAVS for autophagic degradation (Jin & Cui, 2018). Here, RNF34 still decreased MAVS levels in the absence of tetherin following VSV infection, suggesting that RNF34 regulates MAVS levels independent of tetherin (Fig EV4F). Consistent with the binding data, RNF34 inhibited the expression of MAVS but failed to decrease the levels of mMAVS (Fig 5C).
Since Lys 297, 311, 348, and 362 Arg are the major sites for RNF34‐conjugated ubiquitination of MAVS, we next examined whether RNF34 affected the degradation of the MAVS KR mutant. As expected, in contrast to the RNF34‐mediated downregulation of WT, K325R, or K331R MAVS, the ability of RNF34 to downregulate the levels of the K297R, K311R, K348R, and K362R mutants was inhibited to some extent (Fig EV4G). Specifically, the ability of RNF34 to downregulate the expression of the MAVS 4KR mutant was significantly blocked (Fig 5D). Consistent with these findings, RNF34 failed to block the 4KR MAVS‐mediated induction of IFN‐β and ISRE production (Fig EV4H and I).
The RNF34 H342A E3 ligase‐dead mutant also failed to induce MAVS degradation (Fig 5E). Importantly, the formation of MAVS aggregates induced by Flag‐MAVS expression was significantly reduced by RNF34, but not by RNF34 H342A. Furthermore, the RNF34‐induced reduction in MAVS aggregates was partially restored by NH4Cl, but not by MG132 (Fig 5F). Likewise, we observed higher levels of MAVS aggregates in RNF34‐deficient cells in response to VSV infection (Fig 5G). Consistently, MAVS‐deficient PBMCs also displayed increased expression of MAVS after VSV infection (Fig 5H). To directly address the function of RNF34‐induced K63‐K27 ubiquitination transition on the degradation of MAVS aggregates, we next transfected MAVS together with RNF34 and/or TRIM31. As shown in Fig 5I, RNF34 overexpression decreased the levels of MAVS aggregates induced by TRIM31. Thus, RNF34 promotes the autophagic degradation of MAVS aggregates upon RIG‐I stimulation.
RNF34‐mediated autophagic degradation of MAVS aggregates is facilitated by NDP52
Putative autophagy adaptor proteins, such as SQSTM1, NBR1, OPTN, and NDP52, contain a ubiquitin‐binding domain and a LC3‐interacting region (LIR) to target aggregates to autophagosomes for selective degradation (Johansen & Lamark, 2011). Here, we attempted to identify the potential adaptor responsible for recognizing ubiquitinated MAVS and mediating its degradation. Among the four potential adaptors, only SQSTM1 and NDP52 bound to MAVS (Fig EV4J). In luciferase reporter assays, the induction of the IFN‐β promoter by MAVS was also inhibited by SQSTM1 and NDP52 (Fig EV4K). We then generated SQSTM1 I431A and NDP52 D439R/C443K mutants, which have folding defects in the UBA (ubiquitin‐associated) domain (Donaldson et al, 2003; Xie et al, 2015). WT SQSTM1 and its UBA mutant showed similar binding to MAVS (Fig 6A). The induction of the IFN‐β promoter by WT MAVS was inhibited by WT SQSTM1 (Figs 6B and EV4L), accompanied by a significant decrease in the levels of the MAVS protein (Fig 6C). In addition, immunoblotting and reporter assays indicated that the SQSTM1 I431A mutant still induced MAVS degradation and inhibited MAVS‐induced IFN‐β activation to a similar extent as WT SQSTM1 (Fig 6B). Both WT and SQSTM1 I431A expression led to the degradation of MAVS 4KR (Fig 6C). Although SQSTM1 induces MAVS degradation, it is not the adaptor that recognizes MAVS ubiquitination and mediates the selective degradation of MAVS.
Figure 6. RNF34‐mediated autophagic degradation of MAVS aggregates is facilitated by NDP52.
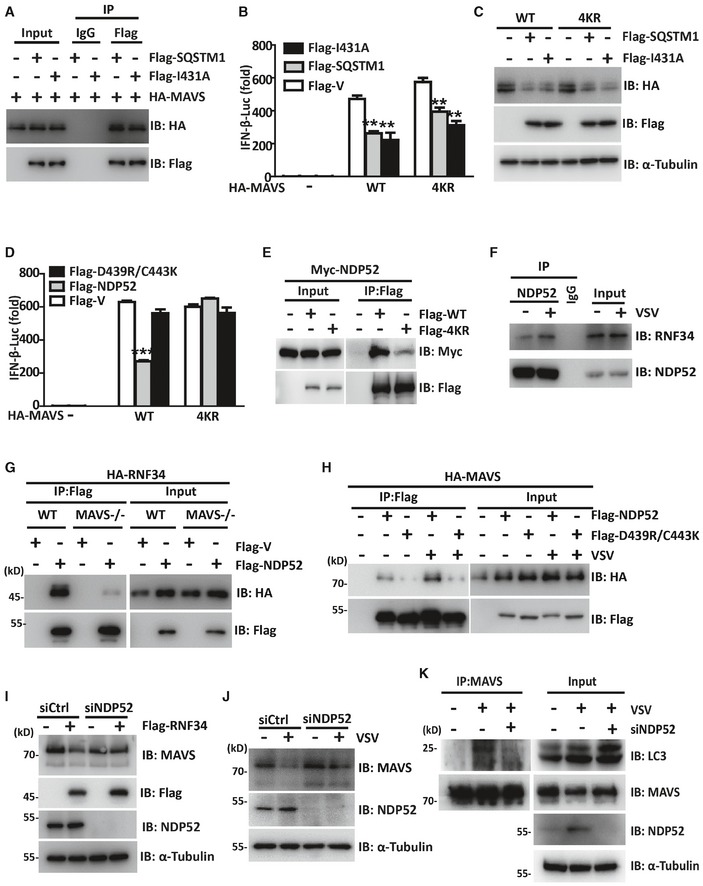
- Immunoprecipitation analysis of HEK293T cells transfected with Flag‐SQSTM1 or its I431A mutant together with HA‐MAVS. Anti‐Flag or IgG agarose immunoprecipitates were analyzed using immunoblotting with an anti‐HA or anti‐Flag antibody.
- Luciferase activity driven by the IFN‐β promoter in HEK293T cells transfected with HA‐MAVS or its 4KR mutant together with Flag‐SQSTM1 or its I431A mutant. Luciferase assays were performed 24 h after transfection.
- Immunoblot showing the levels of the MAVS protein in HEK293T cells expressing HA‐MAVS or its 4KR mutant together with Flag‐SQSTM1. α‐Tubulin was used as a loading control.
- Luciferase activity driven by the IFN‐β promoter in HEK293T cells transfected with HA‐MAVS or its 4KR mutant together with Flag‐NDP52 or its D439R/C443K mutant. Luciferase assays were performed 24 h after transfection.
- Immunoprecipitation analysis of HEK293T cells transfected with Flag‐MAVS or its 4KR mutant together with Myc‐NDP52. Anti‐Flag immunoprecipitates were analyzed using immunoblotting with an anti‐Myc or anti‐Flag antibody.
- Immunoprecipitation analysis of the DNP52‐RNF34 interaction in cells infected with VSV. Anti‐DNP52 immunoprecipitates were analyzed using immunoblotting with an anti‐DNP52 or anti‐RNF34 antibody. The WCL was immunoblotted with an anti‐MAVS or anti‐ RNF34 antibody.
- Immunoprecipitation analysis of the interaction between Flag‐NDP52 and HA‐RNF34 in WT or MAVS−/− cells. Anti‐Flag immunoprecipitates were analyzed using immunoblotting with an anti‐HA antibody.
- Immunoprecipitation analysis of HEK293T cells transfected with Flag‐NDP52 or its D439R/C443K mutant together with HA‐MAVS followed by VSV infection. Anti‐Flag immunoprecipitates were analyzed using immunoblotting with an anti‐HA or anti‐Flag antibody.
- Immunoblot showing the levels of the MAVS protein in siCtrl‐ or siNDP52‐transfected cells expressing Flag‐RNF34 or Flag‐V. α‐Tubulin was used as a loading control.
- Immunoblot showing the levels of the MAVS protein in siCtrl‐ or siNDP52‐transfected cells infected with VSV (MOI = 1, 12 h). α‐Tubulin was used as a loading control.
- Immunoprecipitation analysis of the MAVS‐LC3 interaction in siCtrl‐ or siNDP52‐transfected cells infected with VSV. Anti‐MAVS immunoprecipitates were analyzed using immunoblotting with an anti‐MAVS or anti‐LC3 antibody. NDP52 levels were analyzed by performing immunoblotting with an anti‐NDP52 antibody. α‐Tubulin was used as a loading control.
We next investigated whether NDP52 might be involved in MAVS autophagic degradation. Indeed, WT NDP52, but not its UBA mutant, abrogated IFN‐β activation induced by WT MAVS (Figs 6D and EV4M). Both the WT and D439R/C443K mutant NDP52 failed to block MAVS 4KR‐mediated IFN‐β induction (Fig 6D). The interaction between the 4KR mutant and NDP52 was much weaker than the interaction with WT MAVS (Fig 6E). Interestingly, although RNF34 physically interacted with NDP52 (Fig 6F), the RNF34‐NDP52 interaction was nearly completely abrogated in the absence of MAVS (Fig 6G). Furthermore, VSV infection increased the interaction of WT NDP52 with MAVS (Fig 6H), whereas the NDP52 UBA mutant bound to MAVS with a much lower affinity (Fig 6H). Similarly, NDP52 knockdown slowed RNF34‐induced MAVS degradation (Fig 6I) and increased the protein level of endogenous MAVS (Fig 6J). RNF34 failed to degrade MAVS in MEFs expressing mouse NDP52 lacking the ubiquitin‐binding domain. The reintroduction of human NDP52 restored the RNF34‐induced degradation of MAVS (Fig EV4N). Moreover, MAVS‐LC3 interactions were also substantially disrupted by the NDP52 deficiency (Fig 6K). These data suggested NDP52 cooperates with LC3 and functions as an autophagy receptor to mediate the autophagic degradation of MAVS.
RNF34 is required for the clearance of damaged mitochondria upon viral infection
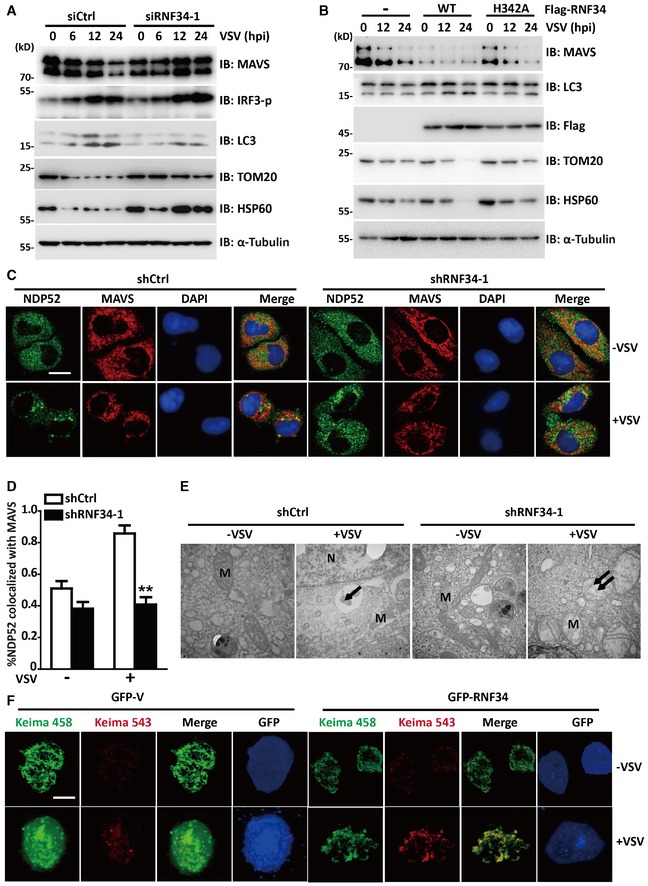
Autophagy was initially thought to be a non‐selective process; however, recent studies have shown that autophagy is a highly selective process that requires cargo recognition (Stolz et al, 2014). Mitophagy is regulated by MAVS following excessive RLR signaling (Sun et al, 2016). In the present study, RNF34 promoted the ubiquitination of MAVS, and NDP52 was an autophagic receptor for ubiquitinated MAVS. MAVS is mainly located on mitochondria; thus, we proposed that RNF34‐mediated ubiquitination of MAVS creates a signal for selective mitophagy. We evaluated VSV‐mediated mitophagy in siRNF34‐1 cells to test this hypothesis. TOM20 and HSP60 are constitutive mitochondria‐localized proteins; thus, immunoblotting was performed for these two proteins to test the extent of mitochondrial degradation. Western blot analyses of the mitochondrial proteins HSP60 and TOM20 confirmed a mitophagy defect in siRNF34‐1‐transfected cells (Fig 7A). To exclude the possible effect of VSV‐induced cell death on the loss of mitochondria from VSV‐induced mitophagy, we treated cells with Z‐VAD‐FMK, a pan‐caspase inhibitor that blocks virus‐induced cell death. Caspase‐3 activation induced by VSV infection was substantially reduced by the Z‐VAD treatment (Fig EV5A). A significant mitophagy defect was also observed in siRNF34‐1 cells in response to VSV infection (Fig EV5B). Indeed, WT RNF34 overexpression, but not the overexpression of its H342A mutant, stimulated mitochondrial clearance (Fig 7B). In the absence of RNF34, reduced colocalization was observed between TOM20 and LAMP1 after VSV infection (Fig EV4C and D). A substantial decrease in NDP52 and MAVS colocalization was also observed in shRNF34‐1 cells (Fig 7C and D). Furthermore, RNF34 overexpression reduced the intensity of TOM20 staining (Fig EV4E and F). We also observed defects in mitochondrial clearance in shRNF34‐1 cells in response to VSV infection using transmission electron microscopy (Fig 7E). We then used Keima, a pH‐sensitive fluorescent protein targeted to the mitochondria, to measure mitophagy flux in cells. Compared with control cells, RNF34 overexpression stimulated a shift in Keima fluorescence from 458 to 543 nm, indicating that an increased number of mitochondria entered the acidic environment of the lysosome in response to VSV infection (Fig 7F). Thus, RNF34 maintains mitochondrial homeostasis upon viral infection.
Figure 7. RNF34 is required for the clearance of damaged mitochondria upon viral infection.
-
AImmunoblot showing MAVS, IRF3‐p, LC3, TOM20, and HSP60 levels in siCtrl‐ or siRNF34‐1 cells infected with VSV and cultured in the presence of Z‐VAD (50 μM) for the indicated times. α‐Tubulin was used as a loading control.
-
BImmunoblot showing MAVS, LC3, TOM20, and HSP60 levels in cells transfected with Flag‐RNF34 or its H342A mutant and subsequently infected with VSV for the indicated times.
-
C, DRepresentative confocal images (C) and quantification (D) of immunofluorescence staining for NDP52 colocalization with MAVS in shCtrl‐ or shRNF34‐1 cells infected with VSV for the indicated times. Red represents MAVS, and green represents NDP52. Scale bar, 10 μm.
-
ETransmission electron microscopy images of shCtrl‐ and shRNF34‐1 HEK293T cells cultured in the presence or absence of VSV. Arrows indicate mitochondria engulfed in autophagosomes. Double arrows indicate swollen mitochondria with disrupted cristae. M, mitochondria and N, nucleus. 40,000× magnification.
-
FRepresentative confocal images of the shift in the fluorescence emission of Keima from 458 to 543 nm. Scale bar, 10 μm.
Figure EV5. RNF34 is required for the clearance of damaged mitochondria upon viral infection.
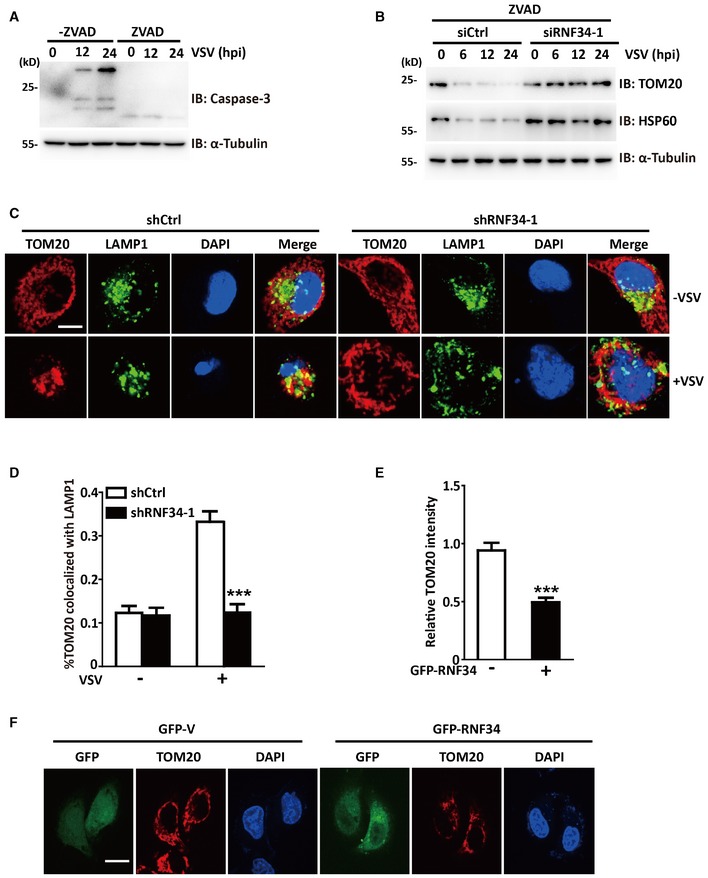
- Immunoblot showing MAVS, IRF3‐p, LC3, TOM20, and HSP60 levels in siCtrl‐ or siRNF34‐1‐transfected cells infected with VSV for the indicated times. α‐Tubulin was used as a loading control.
- Immunoblot showing the levels of activated caspase‐3 in 293T cells infected with VSV for the indicated times and cultured in the presence or absence of Z‐VAD (50 μM). α‐Tubulin was used as a loading control.
- Representative confocal images of immunofluorescence staining for TOM20 clearance in shCtrl‐ or shRNF34‐1 cells infected with VSV and stained with anti‐T0M20 and anti‐LAMP1 antibodies. Red represents TOM20; green represents LAMP1. Scale bar, 10 μm.
- Quantification of TOM20 colocalization with LAMP1 in the cells shown in (C).
- The product of the mean fluorescence intensity of TOM20 in GFP‐RNF34‐transfected cells and the mean fluorescence intensity of GFP‐transfected cells.
- Representative confocal images of TOM20 immunofluorescence staining in cells transfected with GFP or GFP‐RNF34. Scale bar, 10 μm.
Discussion
Autophagy represents a conserved host defense response to diverse intracellular pathogens, while the innate immune system is the first line of defense against invading pathogens (Levine & Kroemer, 2008; Deretic & Levine, 2009; He & Klionsky, 2009; Sumpter & Levine, 2010). Innate immunity and autophagy appear to be inextricably linked and are now known to reciprocally regulate each other (Deretic, 2012). Here, virus‐induced mitophagy depends on an adaptor protein, MAVS, in the RLR innate immune signaling pathway and an E3 ligase, RNF34. RNF34 mediates the ubiquitination of K27‐/K29‐linked MAVS aggregates, which are recognized by the cargo receptor NDP52 and then delivered to lysosomes for the subsequent autophagic clearance of aggregated and damaged mitochondria. RNF34 deficiency led to defective mitophagy and excess activation of RLR innate immune signaling pathways.
RNF34 encodes a RING‐finger domain protein that is highly homologous to XIAP (Konishi et al, 2005a). This protein targets and degrades CASP8, CASP10, TP53, phospho‐TP53, and NOD1 via the E3 ubiquitin activity of the RING‐finger domain. Therefore, the mammalian RNF34 proteins have been reported to be involved in the cellular apoptotic pathway and NF‐κB signaling pathways (Konishi et al, 2005b; Yang et al, 2007; Zhang et al, 2014). Indeed, RNF34 is expressed at high levels in colorectal carcinomas, suggesting its potential role as an oncogenic molecule affecting the apoptotic pathway (Sasaki et al, 2004). In addition, RNF34 is involved in brown fat metabolism by triggering the degradation of PPARGC1A (Wei et al, 2012). Here, we provided several lines of evidence showing that RNF34 is a potent negative regulator of MAVS‐mediated antiviral innate immunity through the direct conjugation of K27‐linked ubiquitin chains to MAVS at Lys 297, 311, 348, and 362 Arg. First, RNF34 is upregulated and translocated to the mitochondrial outer membrane where MAVS resides in response to a viral infection. Second, the silencing of RNF34 expression substantially enhances the antiviral response. Third, the inhibitory effects of RNF34 are mediated by the degradation of MAVS aggregates via the autophagy‐lysosomal pathway. Fourth, RNF34 does not associate with mMAVS and downregulate its expression, further highlighting the negative role of RNF34 in MAVS‐mediated type I IFN signaling.
MAVS forms functional prion‐like aggregates after viral infection, and these MAVS aggregates are responsible for IRF3 phosphorylation and IFN‐β production. Persistent MAVS aggregates may increase the production of type I IFNs and result in uncontrolled signaling, leading to the pathology of lupus. Here, RNF34 promoted the degradation of MAVS aggregates by the autophagy‐lysosomal pathway. RNF34 deficiency substantially increased the amount of MAVS aggregates after viral infection. Importantly, the RNF34‐induced reduction in the levels of MAVS aggregates was partially restored by NH4Cl, but not by MG132. Additionally, the K27‐linked polyubiquitination of MAVS at Lys 297, 311, 348, and 362 Arg regulated the aggregation and degradation of MAVS. Among the four critical ubiquitination sites of MAVS modified by RNF34, Lys 311 attracted our attention. This site is also modified by TRIM31 via K63‐linked polyubiquitination and is required for the formation of MAVS aggregates. Interestingly, RNF34 was essential for the degradation of the TRIM31‐induced MAVS aggregates. Furthermore, silencing of RNF34 significantly decreased the levels of K27‐linked ubiquitinated MAVS and induced the accumulation of K63‐linked ubiquitinated MAVS. We thus reasoned that the formation of K63‐linked polyubiquitin chains at Lys 311 in MAVS may recruit RNF34 to trigger the K27‐linked ubiquitination transition, which ultimately leads to the autophagic degradation of MAVS aggregates. MARCH5 is another E3 ligase that promotes the proteasome‐mediated degradation of MAVS aggregates (Yoo et al, 2015). Further investigations are required to determine whether and how MARCH5 and RNF34 function redundantly or cooperatively in mediating the degradation of activated MAVS oligomers.
Ubiquitination has been suggested to be involved in MAVS expression and function. Currently, nine MAVS ubiquitination sites have been functionally characterized at Lys 7, 10, 297, 311, 348, 362, 420, 461, and 500, which are mainly located between the proline‐rich domain and transmembrane domain (not within any of the major structural domains) (You et al, 2009; Zhong et al, 2010; Castanier et al, 2012; Du et al, 2015; Yoo et al, 2015; Jin et al, 2017; Liu et al, 2017). Interestingly, the transfer of K48‐linked ubiquitin to Lys 7 promotes its proteasome‐mediated degradation and the K27‐linked ubiquitin to Lys 7 promotes its autophagic degradation, whereas the transfer of K48‐linked ubiquitin to Lys 500 promotes its proteasome‐mediated degradation and the K63‐linked ubiquitin to Lys 500 positively regulates MAVS signal propagation (Yoo et al, 2015). In this report, four critical ubiquitination sites, including Lys 297, 311, 348, and 362 Arg, were identified to be catalyzed in the K27‐linked form by RNF34. Notably, the ubiquitination of Lys 311 can also be catalyzed in the K63‐linked form by TRIM31 and Lys 362 in the K48‐linked form by RNF5 (Zhong et al, 2010; Liu et al, 2017). Therefore, one single site catalyzed by different E3 ligases with different ubiquitination modes can deliberately regulate the protein fate of MAVS. In addition, RNF34 only targeted full‐length MAVS for degradation without affecting the expression of mMAVS. Thus, our results suggest a unique mechanism by which the expression of full‐length MAVS decreases over time, while the expression of the mMAVS remains constant during an RNA virus infection. All these diverse regulatory mechanisms for MAVS reveal a spatial and temporal regulation network to orchestrate antiviral immunity.
MAVS is strategically located in the mitochondria and peroxisomes (Dixit et al, 2010). Notably, polyubiquitinated protein aggregates or misfolded proteins recruit the autophagy machinery for selective autophagy (Yao, 2010). Therefore, the aggregation of MAVS may trigger the autophagy pathway to induce MAVS autophagic degradation and damaged mitochondrial clearance. In support of this hypothesis, the activation of MAVS, which functions as a potential mitophagy receptor to mediate proper mitochondrial turnover, was recently shown to be necessary and sufficient to induce autophagy (Sun et al, 2016). In addition, other emerging lines of evidence have suggested that the autophagy pathway is also engaged in controlling MAVS‐mediated antiviral signaling (Zhao et al, 2012). Here, we propose a critical role for autophagy in mediating the degradation of MAVS aggregates, and we also identified RNF34 as a key regulator of mitochondrial turnover and the antiviral response by promoting the K27‐/K29‐linked ubiquitination of MAVS. Autophagy, including the autophagy factors ATG5‐ATG12 and ATG9, negatively regulates RLR signaling, while RLRs, including MAVS or IFIH1, activate autophagy (Saitoh & Akira, 2010). The results presented here suggest a novel association between the innate immune response and autophagy regulation. The ubiquitin‐ and LC3‐binding adaptor NDP52, but not SQSTM1, OPTN, or NBR1, was essential for the induction of viral‐induced mitophagy by RNF34. Similar to the other three cargo receptors, NDP52 simultaneously binds LC3 and ubiquitinated cargo. A recent elegant study shows NDP52 acts as an autophagy receptor for K27‐linked ubiquitin‐MAVS for its autophagic degradation (Jin & Cui, 2018). Based on our results, NDP52 promoted WT MAVS degradation and inhibited MAVS‐mediated IFN‐β activation, with no effect on the MAVS aggregation‐defective or ubiquitination mutants. Consistent with these findings, the NDP52 UBA mutant failed to recognize ubiquitin chains, abrogating its ability to bind MAVS. Although MAVS itself is a cargo receptor that directly interacts with LC3, here, we showed that the MAVS‐LC3 interaction was substantially inhibited in the absence of NDP52. Furthermore, NDP52 knockdown slowed RNF34‐induced MAVS degradation. Thus, K27/K29 MAVS‐enriched mitochondria are recognized by the cargo receptor NDP52 and delivered to autophagosomes and then lysosomes for degradation. Thus, our studies revealed a crucial role for NDP52 in the RNF34‐mediated regulation of mitophagy upon viral infection.
In summary, we identified RNF34, an E3 ubiquitin ligase, as an important regulator of immunity and mitophagy by inducing the autophagic degradation of MAVS aggregates. RNF34 promoted the K63 to K27/K29 ubiquitination transition of MAVS and degraded activated MAVS oligomers. The loss of RNF34 led to defects in mitophagy. The RNF34‐mediated mitochondrial quality control mechanism links the innate immune response, mitochondrial homeostasis, and infection.
Materials and Methods
Plasmids and small interfering RNAs (siRNAs)
Flag‐tagged MAVS, HA‐tagged ubiquitin, Gal4‐luciferase, and Gal4‐IRF3 plasmids were provided by Dr. Zhijian Chen (University of Texas Southwestern Medical Center, Dallas, Texas). IFN‐β‐luciferase and ISRE‐luciferase reporter plasmids were purchased from Beyotime Corp. The RNF34, SQSTM1, NBR1, OPTN, NDP52, TRIM31, and RIG‐I cDNAs were amplified from a human spleen library and subsequently cloned into CMV promoter‐based vectors. Flag‐MAVS, HA‐ubiquitin mutants, Flag‐SQSTM1, Flag‐NDP52, and Flag‐RNF34 mutants were cloned into pcDNA3 using overlap extension PCR. Plasmids encoding GST‐fusion proteins were prepared by cloning PCR‐amplified fragments into pGEX4T‐2 (Amersham Biosciences). GFP‐RNF34 was prepared by cloning PCR‐amplified fragments into pDSRed (Biosciences Clontech). Other plasmids containing tagged cDNAs and mutants were constructed by PCR amplification of these plasmids. All plasmids were verified by restriction enzyme digestion and DNA sequencing. The siRNAs targeting human genes were purchased from Invitrogen and GenePharma. Their target sequences are as follows:
siRNF34‐1: 5′‐CUCCGUUUGUUCAGUCUUATT‐3′;
siRNF34‐2: 5′‐CUCAGUUAAUGCGACUGAATT‐3′;
siRNF34‐3: 5′‐GGGAACUGGUAGAGAAAGUTT‐3′;
siATG7: 5′‐GCAUCAUCUUCGAAGUGAATT‐3′;
siTetherin: 5′‐GCUCCUGAUCAUCGUGAUUTT‐3′;
siTRIM31:5′‐GCUGCUGGAGGAUAUCAAATT‐3′;
siATG5: 5′‐ GACGUUGGUAACUGACAAATT ‐3′;
siNDP52: 5′‐UUCAGUUGAAGCAGCUCUGUCUCCC‐3′.
Scrambled siRNA oligonucleotides were used as a control (siCtrl).
For the stable downregulation of RNF34, HEK293T cells were transfected with pSuper.Retro.puro‐shRNA‐1, pSuper.Retro.puro‐shRNA‐2, or pSuper.Retro.puro‐shRNA‐3 using Lipofectamine 2000 (Invitrogen) and selected in the presence of puromycin 3 days after transfection. Puromycin‐resistant single‐cell clones were amplified and screened using Western blotting with an anti‐RNF34 antibody.
Reagents
Reagents were obtained from the following suppliers: 3‐MA (S2767), MG132 (S2619), and rapamycin (S1039) were purchased from Selleck. Poly(I:C) and poly(dA:dT) (Sigma‐Aldrich), DMSO (Sigma, D2650), and HBSS (Gibco, 1441787) were obtained from commercial sources. The enzyme‐linked immunosorbent assay (ELISA) kits for human IFN‐β and IL6 were purchased from Thermo Fisher and Dakewe Biotech.
Cell culture and transfection
The human cell lines HEK293T, HeLa, and THP‐1 were obtained from ATCC. HeLa and HEK293T cells were routinely cultured in Dulbecco's Modified Eagle's Medium (DMEM; Invitrogen), and THP‐1 cells were cultured in RPMI medium 1640 basic (Gibco) supplemented with 10% heat‐inactivated fetal bovine serum (FBS; Gibco). Cells were maintained as monolayers in a humidified atmosphere containing 5% CO2 at 37°C. Lipofectamine 2000 reagent was used for transfection according to the manufacturer's protocol (Invitrogen). Stable cell clones were selected in 1 μg/ml puromycin for approximately 2 weeks. Individual clones were screened using standard immunoblotting protocols and produced similar results.
VSV, SeV, and NDV infection
VSV, SeV, and NDV were kindly provided by Dr. Cheng Cao (Beijing Institute of Biotechnology, Beijing). Cells were infected with the virus at a multiplicity of infection (MOI) of 1.0 for the indicated times, and then, the medium was replaced with fresh medium. For SeV and VSV, supernatants were collected and titers were measured by performing plaque assays using BHK21 cells (Zhang et al, 2008; Ma et al, 2014).
Western blotting and immunoprecipitation
Cell extracts were prepared, immunoprecipitated, and analyzed as previously described (He et al, 2010). An aliquot of the total lysate (5%, v/v) was included as a control for the interaction assay. Immunoprecipitation was performed with an anti‐Flag M2 affinity gel (Sigma‐Aldrich, A2220), anti‐NDP52 antibody (Abcam, ab68588), or anti‐MAVS antibody (Santa Cruz, sc‐166583). Western blotting was performed with HRP‐labeled anti‐Myc (Sigma‐Aldrich, A5598), anti‐HA (Sigma‐Aldrich, H9658), anti‐Ub (Epitomics, 6652‐1), anti‐Ub‐27 (Abcam, ab181537), anti‐Ub‐63 (Epitomics, 8070‐1), anti‐TBK1 (Santa Cruz, sc‐166583, sc‐52957), anti‐TBK1 (pSer172) (ab109272), anti‐IRF3 (pSer386) (Epitomics, 2562‐1), anti‐IRF3 (pSer396) (Cell Signaling Technology, 4947), anti‐VSV‐G (Santa Cruz, sc‐365019), anti‐RNF34 (Novus. NBP2‐56413), anti‐SQSTM1 (ABclonal, A7758), anti‐TOM20 (ABclonal, A11308), anti‐HSP60 (Santa Cruz, sc‐166583, sc‐136291) anti‐TRIM31 (Sigma‐Aldrich, AV34717), anti‐LC3 (Novus. NB100‐2220), anti‐LAMP1 (Santa Cruz, sc‐19992), or anti‐α‐tubulin (Sigma‐Aldrich, T6074) antibodies. The antigen–antibody complexes were visualized using chemiluminescence.
In the far‐Western assay, immunoprecipitates were separated by SDS–PAGE and then blotted onto nitrocellulose membranes, which were subsequently incubated with purified GST‐fusion proteins for 1 h at room temperature. An anti‐GST antibody was used to probe the GST‐fusion proteins bound to nitrocellulose.
Immunofluorescence staining and confocal microscopy
HeLa cells were fixed with 4% paraformaldehyde and then permeabilized with 0.2% Triton X‐100. Then, cells were stained with primary antibodies (anti‐LC3, 1:200; anti‐MAVS, 1:100; anti‐LAMP1, 1:200; anti‐RNF34, 1;100; anti‐TOM20, 1:500, and anti‐Flag M2 antibody, 1:500) and suitable Alexa Fluor‐conjugated secondary antibodies for 1 h at room temperature. After another wash with TBST, the coverslips were mounted with DAPI for the visualization of fluorescence signals. An UltraVIEW VoX confocal microscope (Perkin Elmer) was used to capture confocal images.
Native gel electrophoresis
Cells were lysed in NP‐40 lysis buffer as previously described (He et al, 2010). Briefly, cell lysates were pre‐separated on an 8% native gel for 30 min at 40 mA, and the inner chamber contained a buffer composed of 25 mM Tris, 192 mM glycine, and 1% deoxycholate (DOC). The proteins from the native gel were transferred to PVDF membranes for immunoblotting analyses, as described above.
In situ PLA
Fixed and permeabilized cells were incubated overnight at 4°C with the following pairs of primary antibodies: anti‐RNF34 (Epitomics, 2131‐1) or a human antibody against MAVS (Santa Cruz, sc‐398366). The cells were washed and allowed to react with a pair of proximity probes (Olink Bioscience). The remainder of the in situ PLA protocol was performed according to the manufacturer's instructions. Cells were examined under a fluorescence microscope (UltraView VoX, PerkinElmer), and the Duolink Image Tool (Olink Bioscience) was used for quantitative analyses.
Luciferase reporter assays
HEK293T cells cultured in 24‐well plates were transfected with 0.1 μg of reporter, 0.002 μg of the pRL control vector, and various amounts of the indicated constructs using Lipofectamine 2000. After a 24‐h incubation, the cells were harvested, and luciferase activity was analyzed using the Dual Luciferase Reporter Assay System (Promega). Total light production was measured with a TD‐20/20 Single‐Tube Luminometer (Turner BioSystems). All experiments were repeated at least three times.
Semi‐denaturing detergent agarose gel electrophoresis (SDD‐AGE)
Crude mitochondria and cytosolic extracts were separated from HEK293T cells using differential centrifugation. HEK293T cells were resuspended in buffer (Beyotime, C3601) and then lysed by grinding; cell debris and the supernatant were separated by centrifugation at 800 g for 10 min. The supernatants were then removed to a new EP tube and centrifuged at 13,200 g for 10 min at 4°C to separate crude mitochondria and cytosolic extracts. The crude mitochondria were resuspended in 1× sample buffer (0.5× TAE, 10% glycerol, 2% SDS, and 0.0025% bromophenol blue) and loaded onto a 1.5% agarose gel. Then, the samples were electrophoresed at a constant voltage of 100 V at 4°C until the bromophenol blue dye reached the bottom of the agarose gel. The proteins were transferred to PVDF membranes (Millipore) for immunoblotting.
LC‐MS/MS analysis
Flag‐tagged MAVS immunoprecipitates prepared from whole‐cell lysates or gel‐filtrated fractions were resolved on SDS–PAGE gels, and protein bands were excised. The samples were digested with trypsin, and after adequate trypsinization, ubiquitinated peptides were enriched with a ubiquitin‐specific antibody (5562S, Cell Signaling Technology). LC‐electrospray ionization‐MS/MS‐resolved peptides were analyzed using a Q‐TOF2 system (Micromass), and the data were compared to SWISSPROT using the Mascot search engine (http://www.matrixscience.com) for ubiquitination.
ELISA
Cells transfected with the indicated plasmids were infected with viruses for 12 or 24 h. The levels of human IFN‐β and IL6 in the supernatants were measured using ELISAs, according to the manufacturer's instructions.
Transmission electron microscopy
Cells were fixed with 4% formaldehyde and 1% glutaraldehyde and then processed for transmission electron microscopy by the China National Center of Biomedical Analysis.
Statistical analysis
Significant differences were calculated using a paired Student's t‐test: *P < 0.05; **P < 0.01; and ***P < 0.001.
Author contributions
HZ, CWW, and XH designed the study; XH, YJZ, YQG, JGo, JGe, PPZ, XTZ, NL, YMP, CBW, YJW, XL, LW, and YHZ performed the experiments. HZ, CWW, FG, and XH supervised the study. HZ wrote the paper.
Conflict of interest
The authors declare that they have no conflict of interest.
Supporting information
Expanded View Figures PDF
Source Data for Expanded View
Review Process File
Source Data for Figure 1
Source Data for Figure 2
Source Data for Figure 3
Source Data for Figure 4
Source Data for Figure 5
Source Data for Figure 6
Source Data for Figure 7
Acknowledgements
The authors thank Dr. Zhijian Chen, Dr. Cheng Cao, and Dr. Xin Pan for generously providing reagents. The authors thank Dr. Cuifeng Yin (Biomed Editor LLC, Princeton, NJ, USA) for editing and proofreading the manuscript. This study was supported in part by grants from the Beijing Natural Science Foundation (5182029) and the National Natural Science Foundation of China (31872715, 31470850, 31471325, and 31571424). The funders had no role in the study design, data collection and analysis, decision to publish, or preparation of the manuscript.
The EMBO Journal (2019) 38: e100978
Contributor Information
Congwen Wei, Email: weicw@yahoo.com.
Hui Zhong, Email: towall@yahoo.com.
References
- Altman BJ, Rathmell JC (2012) Metabolic stress in autophagy and cell death pathways. Cold Spring Harb Perspect Biol 4: a008763 [DOI] [PMC free article] [PubMed] [Google Scholar]
- Arimoto K, Takahashi H, Hishiki T, Konishi H, Fujita T, Shimotohno K (2007) Negative regulation of the RIG‐I signaling by the ubiquitin ligase RNF125. Proc Natl Acad Sci USA 104: 7500–7505 [DOI] [PMC free article] [PubMed] [Google Scholar]
- Ashrafi G, Schwarz TL (2013) The pathways of mitophagy for quality control and clearance of mitochondria. Cell Death Differ 20: 31–42 [DOI] [PMC free article] [PubMed] [Google Scholar]
- Brubaker SW, Gauthier AE, Mills EW, Ingolia NT, Kagan JC (2014) A bicistronic MAVS transcript highlights a class of truncated variants in antiviral immunity. Cell 156: 800–811 [DOI] [PMC free article] [PubMed] [Google Scholar]
- Camello‐Almaraz C, Gomez‐Pinilla PJ, Pozo MJ, Camello PJ (2006) Mitochondrial reactive oxygen species and Ca2+ signaling. Am J Physiol Cell Physiol 291: C1082–C1088 [DOI] [PubMed] [Google Scholar]
- Castanier C, Zemirli N, Portier A, Garcin D, Bidere N, Vazquez A, Arnoult D (2012) MAVS ubiquitination by the E3 ligase TRIM25 and degradation by the proteasome is involved in type I interferon production after activation of the antiviral RIG‐I‐like receptors. BMC Biol 10: 44 [DOI] [PMC free article] [PubMed] [Google Scholar]
- Chandel NS (2014) Mitochondria as signaling organelles. BMC Biol 12: 34 [DOI] [PMC free article] [PubMed] [Google Scholar]
- Deretic V, Levine B (2009) Autophagy, immunity, and microbial adaptations. Cell Host Microbe 5: 527–549 [DOI] [PMC free article] [PubMed] [Google Scholar]
- Deretic V (2012) Autophagy as an innate immunity paradigm: expanding the scope and repertoire of pattern recognition receptors. Curr Opin Immunol 24: 21–31 [DOI] [PMC free article] [PubMed] [Google Scholar]
- Dixit E, Boulant S, Zhang Y, Lee AS, Odendall C, Shum B, Hacohen N, Chen ZJ, Whelan SP, Fransen M et al (2010) Peroxisomes are signaling platforms for antiviral innate immunity. Cell 141: 668–681 [DOI] [PMC free article] [PubMed] [Google Scholar]
- Donaldson KM, Li W, Ching KA, Batalov S, Tsai CC, Joazeiro CA (2003) Ubiquitin‐mediated sequestration of normal cellular proteins into polyglutamine aggregates. Proc Natl Acad Sci USA 100: 8892–8897 [DOI] [PMC free article] [PubMed] [Google Scholar]
- Du J, Zhang D, Zhang W, Ouyang G, Wang J, Liu X, Li S, Ji W, Liu W, Xiao W (2015) pVHL negatively regulates antiviral signaling by targeting MAVS for proteasomal degradation. J Immunol 195: 1782–1790 [DOI] [PubMed] [Google Scholar]
- Glick D, Barth S, Macleod KF (2010) Autophagy: cellular and molecular mechanisms. J Pathol 221: 3–12 [DOI] [PMC free article] [PubMed] [Google Scholar]
- He C, Klionsky DJ (2009) Regulation mechanisms and signaling pathways of autophagy. Annu Rev Genet 43: 67–93 [DOI] [PMC free article] [PubMed] [Google Scholar]
- He X, Zheng Z, Song T, Wei C, Ma H, Ma Q, Zhang Y, Xu Y, Shi W, Ye Q et al (2010) c‐Abl regulates estrogen receptor alpha transcription activity through its stabilization by phosphorylation. Oncogene 29: 2238–2251 [DOI] [PubMed] [Google Scholar]
- Hou F, Sun L, Zheng H, Skaug B, Jiang QX, Chen ZJ (2011) MAVS forms functional prion‐like aggregates to activate and propagate antiviral innate immune response. Cell 146: 448–461 [DOI] [PMC free article] [PubMed] [Google Scholar]
- Jin S, Tian S, Luo M, Xie W, Liu T, Duan T, Wu Y, Cui J (2017) Tetherin suppresses type i interferon signaling by targeting MAVS for NDP52‐mediated selective autophagic degradation in human cells. Mol Cell 68: 308–322.e304 [DOI] [PubMed] [Google Scholar]
- Jin S, Cui J (2018) BST2 inhibits type I IFN (interferon) signaling by accelerating MAVS degradation through CALCOCO2‐directed autophagy. Autophagy 14: 171–172 [DOI] [PMC free article] [PubMed] [Google Scholar]
- Johansen T, Lamark T (2011) Selective autophagy mediated by autophagic adapter proteins. Autophagy 7: 279–296 [DOI] [PMC free article] [PubMed] [Google Scholar]
- Kanki T, Klionsky DJ (2009) Atg32 is a tag for mitochondria degradation in yeast. Autophagy 5: 1201–1202 [DOI] [PubMed] [Google Scholar]
- Kanki T (2010) Nix, a receptor protein for mitophagy in mammals. Autophagy 6: 433–435 [DOI] [PubMed] [Google Scholar]
- Karbowski M, Neutzner A, Youle RJ (2007) The mitochondrial E3 ubiquitin ligase MARCH5 is required for Drp1 dependent mitochondrial division. J Cell Biol 178: 71–84 [DOI] [PMC free article] [PubMed] [Google Scholar]
- Kato H, Takeuchi O, Sato S, Yoneyama M, Yamamoto M, Matsui K, Uematsu S, Jung A, Kawai T, Ishii KJ et al (2006) Differential roles of MDA5 and RIG‐I helicases in the recognition of RNA viruses. Nature 441: 101–105 [DOI] [PubMed] [Google Scholar]
- Kawai T, Takahashi K, Sato S, Coban C, Kumar H, Kato H, Ishii KJ, Takeuchi O, Akira S (2005) IPS‐1, an adaptor triggering RIG‐I‐ and Mda5‐mediated type I interferon induction. Nat Immunol 6: 981–988 [DOI] [PubMed] [Google Scholar]
- Konishi T, Sasaki S, Watanabe T, Kitayama J, Nagawa H (2005a) Exogenous expression of hRFI induces multidrug resistance through escape from apoptosis in colorectal cancer cells. Anticancer Res 25: 2737–2741 [PubMed] [Google Scholar]
- Konishi T, Sasaki S, Watanabe T, Kitayama J, Nagawa H (2005b) Overexpression of hRFI (human ring finger homologous to inhibitor of apoptosis protein type) inhibits death receptor‐mediated apoptosis in colorectal cancer cells. Mol Cancer Ther 4: 743–750 [DOI] [PubMed] [Google Scholar]
- Korac J, Schaeffer V, Kovacevic I, Clement AM, Jungblut B, Behl C, Terzic J, Dikic I (2013) Ubiquitin‐independent function of optineurin in autophagic clearance of protein aggregates. J Cell Sci 126: 580–592 [DOI] [PMC free article] [PubMed] [Google Scholar]
- Koshiba T, Bashiruddin N, Kawabata S (2011) Mitochondria and antiviral innate immunity. Int J Biochem Mol Biol 2: 257–262 [PMC free article] [PubMed] [Google Scholar]
- Kraft C, Peter M, Hofmann K (2010) Selective autophagy: ubiquitin‐mediated recognition and beyond. Nat Cell Biol 12: 836–841 [DOI] [PubMed] [Google Scholar]
- Kuang E, Qi J, Ronai Z (2013) Emerging roles of E3 ubiquitin ligases in autophagy. Trends Biochem Sci 38: 453–460 [DOI] [PMC free article] [PubMed] [Google Scholar]
- Lee JY, Koga H, Kawaguchi Y, Tang W, Wong E, Gao YS, Pandey UB, Kaushik S, Tresse E, Lu J et al (2010) HDAC6 controls autophagosome maturation essential for ubiquitin‐selective quality‐control autophagy. EMBO J 29: 969–980 [DOI] [PMC free article] [PubMed] [Google Scholar]
- Levine B, Kroemer G (2008) Autophagy in the pathogenesis of disease. Cell 132: 27–42 [DOI] [PMC free article] [PubMed] [Google Scholar]
- Lin B, Ke Q, Li H, Pheifer NS, Velliquette DC, Leaman DW (2017) Negative regulation of the RLH signaling by the E3 ubiquitin ligase RNF114. Cytokine 99: 186–193 [DOI] [PubMed] [Google Scholar]
- Liu B, Zhang M, Chu H, Zhang H, Wu H, Song G, Wang P, Zhao K, Hou J, Wang X et al (2017) The ubiquitin E3 ligase TRIM31 promotes aggregation and activation of the signaling adaptor MAVS through Lys63‐linked polyubiquitination. Nat Immunol 18: 214–224 [DOI] [PubMed] [Google Scholar]
- Ma F, Liu SY, Razani B, Arora N, Li B, Kagechika H, Tontonoz P, Nunez V, Ricote M, Cheng G (2014) Retinoid X receptor alpha attenuates host antiviral response by suppressing type I interferon. Nat Commun 5: 5494 [DOI] [PMC free article] [PubMed] [Google Scholar]
- Mathew R, Karantza‐Wadsworth V, White E (2007) Role of autophagy in cancer. Nat Rev Cancer 7: 961–967 [DOI] [PMC free article] [PubMed] [Google Scholar]
- Meylan E, Curran J, Hofmann K, Moradpour D, Binder M, Bartenschlager R, Tschopp J (2005) Cardif is an adaptor protein in the RIG‐I antiviral pathway and is targeted by hepatitis C virus. Nature 437: 1167–1172 [DOI] [PubMed] [Google Scholar]
- Mizushima N (2007) Autophagy: process and function. Genes Dev 21: 2861–2873 [DOI] [PubMed] [Google Scholar]
- Moresco EM, Beutler B (2010) LGP2: positive about viral sensing. Proc Natl Acad Sci USA 107: 1261–1262 [DOI] [PMC free article] [PubMed] [Google Scholar]
- Moscat J, Diaz‐Meco MT (2011) Feedback on fat: p62‐mTORC1‐autophagy connections. Cell 147: 724–727 [DOI] [PMC free article] [PubMed] [Google Scholar]
- von Muhlinen N, Thurston T, Ryzhakov G, Bloor S, Randow F (2010) NDP52, a novel autophagy receptor for ubiquitin‐decorated cytosolic bacteria. Autophagy 6: 288–289 [DOI] [PubMed] [Google Scholar]
- Saitoh T, Akira S (2010) Regulation of innate immune responses by autophagy‐related proteins. J Cell Biol 189: 925–935 [DOI] [PMC free article] [PubMed] [Google Scholar]
- Sasaki S, Watanabe T, Konishi T, Kitayama J, Nagawa H (2004) Effects of expression of hRFI on adenoma formation and tumor progression in colorectal adenoma‐carcinoma sequence. J Exp Clin Cancer Res 23: 507–512 [PubMed] [Google Scholar]
- Seth RB, Sun L, Ea CK, Chen ZJ (2005) Identification and characterization of MAVS, a mitochondrial antiviral signaling protein that activates NF‐kappaB and IRF 3. Cell 122: 669–682 [DOI] [PubMed] [Google Scholar]
- Shaid S, Brandts CH, Serve H, Dikic I (2013) Ubiquitination and selective autophagy. Cell Death Differ 20: 21–30 [DOI] [PMC free article] [PubMed] [Google Scholar]
- Shibutani ST, Yoshimori T (2014) A current perspective of autophagosome biogenesis. Cell Res 24: 58–68 [DOI] [PMC free article] [PubMed] [Google Scholar]
- Stolz A, Ernst A, Dikic I (2014) Cargo recognition and trafficking in selective autophagy. Nat Cell Biol 16: 495–501 [DOI] [PubMed] [Google Scholar]
- Sumpter R Jr, Levine B (2010) Autophagy and innate immunity: triggering, targeting and tuning. Semin Cell Dev Biol 21: 699–711 [DOI] [PMC free article] [PubMed] [Google Scholar]
- Sun X, Sun L, Zhao Y, Li Y, Lin W, Chen D, Sun Q (2016) MAVS maintains mitochondrial homeostasis via autophagy. Cell Discov 2: 16024 [DOI] [PMC free article] [PubMed] [Google Scholar]
- Takeuchi O, Akira S (2008) MDA5/RIG‐I and virus recognition. Curr Opin Immunol 20: 17–22 [DOI] [PubMed] [Google Scholar]
- Wang Y, Tong X, Ye X (2012) Ndfip1 negatively regulates RIG‐I‐dependent immune signaling by enhancing E3 ligase Smurf1‐mediated MAVS degradation. J Immunol 189: 5304–5313 [DOI] [PubMed] [Google Scholar]
- Wang W, Jiang M, Liu S, Zhang S, Liu W, Ma Y, Zhang L, Zhang J, Cao X (2016) RNF122 suppresses antiviral type I interferon production by targeting RIG‐I CARDs to mediate RIG‐I degradation. Proc Natl Acad Sci USA 113: 9581–9586 [DOI] [PMC free article] [PubMed] [Google Scholar]
- Wei P, Pan D, Mao C, Wang YX (2012) RNF34 is a cold‐regulated E3 ubiquitin ligase for PGC‐1alpha and modulates brown fat cell metabolism. Mol Cell Biol 32: 266–275 [DOI] [PMC free article] [PubMed] [Google Scholar]
- Widlansky ME, Gutterman DD (2011) Regulation of endothelial function by mitochondrial reactive oxygen species. Antioxid Redox Signal 15: 1517–1530 [DOI] [PMC free article] [PubMed] [Google Scholar]
- Xie X, Li F, Wang Y, Wang Y, Lin Z, Cheng X, Liu J, Chen C, Pan L (2015) Molecular basis of ubiquitin recognition by the autophagy receptor CALCOCO2. Autophagy 11: 1775–1789 [DOI] [PMC free article] [PubMed] [Google Scholar]
- Xu LG, Wang YY, Han KJ, Li LY, Zhai Z, Shu HB (2005) VISA is an adapter protein required for virus‐triggered IFN‐beta signaling. Mol Cell 19: 727–740 [DOI] [PubMed] [Google Scholar]
- Yang W, Rozan LM, McDonald ER III, Navaraj A, Liu JJ, Matthew EM, Wang W, Dicker DT, El‐Deiry WS (2007) CARPs are ubiquitin ligases that promote MDM2‐independent p53 and phospho‐p53ser20 degradation. J Biol Chem 282: 3273–3281 [DOI] [PubMed] [Google Scholar]
- Yao TP (2010) The role of ubiquitin in autophagy‐dependent protein aggregate processing. Genes Cancer 1: 779–786 [DOI] [PMC free article] [PubMed] [Google Scholar]
- Yoneyama M, Kikuchi M, Natsukawa T, Shinobu N, Imaizumi T, Miyagishi M, Taira K, Akira S, Fujita T (2004) The RNA helicase RIG‐I has an essential function in double‐stranded RNA‐induced innate antiviral responses. Nat Immunol 5: 730–737 [DOI] [PubMed] [Google Scholar]
- Yoo YS, Park YY, Kim JH, Cho H, Kim SH, Lee HS, Kim TH, Sun Kim Y, Lee Y, Kim CJ et al (2015) The mitochondrial ubiquitin ligase MARCH5 resolves MAVS aggregates during antiviral signalling. Nat Commun 6: 7910 [DOI] [PMC free article] [PubMed] [Google Scholar]
- You F, Sun H, Zhou X, Sun W, Liang S, Zhai Z, Jiang Z (2009) PCBP2 mediates degradation of the adaptor MAVS via the HECT ubiquitin ligase AIP4. Nat Immunol 10: 1300–1308 [DOI] [PubMed] [Google Scholar]
- Zhang M, Tian Y, Wang RP, Gao D, Zhang Y, Diao FC, Chen DY, Zhai ZH, Shu HB (2008) Negative feedback regulation of cellular antiviral signaling by RBCK1‐mediated degradation of IRF3. Cell Res 18: 1096–1104 [DOI] [PubMed] [Google Scholar]
- Zhang R, Zhao J, Song Y, Wang X, Wang L, Xu J, Song C, Liu F (2014) The E3 ligase RNF34 is a novel negative regulator of the NOD1 pathway. Cell Physiol Biochem 33: 1954–1962 [DOI] [PubMed] [Google Scholar]
- Zhao Y, Sun X, Nie X, Sun L, Tang T‐S, Chen D, Sun Q (2012) COX5B regulates MAVS‐mediated antiviral signaling through interaction with ATG5 and repressing ROS production. PLoS Pathog 8: e1003086 [DOI] [PMC free article] [PubMed] [Google Scholar]
- Zhong B, Zhang Y, Tan B, Liu TT, Wang YY, Shu HB (2010) The E3 ubiquitin ligase RNF5 targets virus‐induced signaling adaptor for ubiquitination and degradation. J Immunol 184: 6249–6255 [DOI] [PubMed] [Google Scholar]
Associated Data
This section collects any data citations, data availability statements, or supplementary materials included in this article.
Supplementary Materials
Expanded View Figures PDF
Source Data for Expanded View
Review Process File
Source Data for Figure 1
Source Data for Figure 2
Source Data for Figure 3
Source Data for Figure 4
Source Data for Figure 5
Source Data for Figure 6
Source Data for Figure 7


