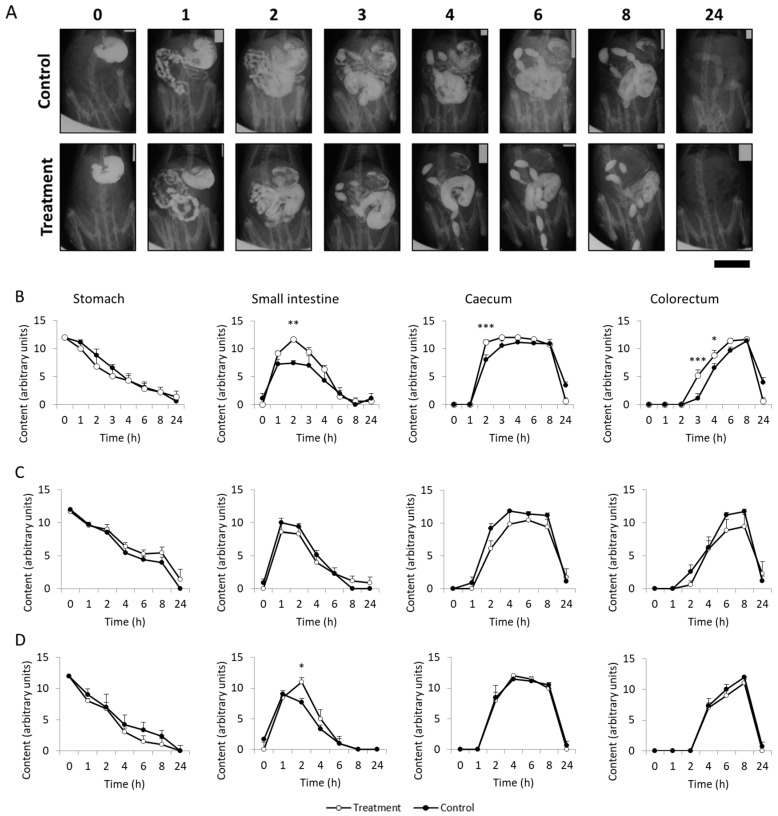
Figure 4.
(A) Radiological images of X-rays from the 1st day of treatment of controls and rats treated with SCGs, taken immediately and 1, 2, 3, 4, 6, 8, and 24 h after barium administration. Scale bar = 3 cm. Radiological analysis of X-rays taken on the 1st (B), 14th (C), and 28th (D) day of treatment according to Cabezos et al. (2008) [21]. Data represent the mean ± SE. * (p < 0.05), ** (p < 0.005), *** (p < 0.001) (two-way ANOVA followed by Bonferroni test).

