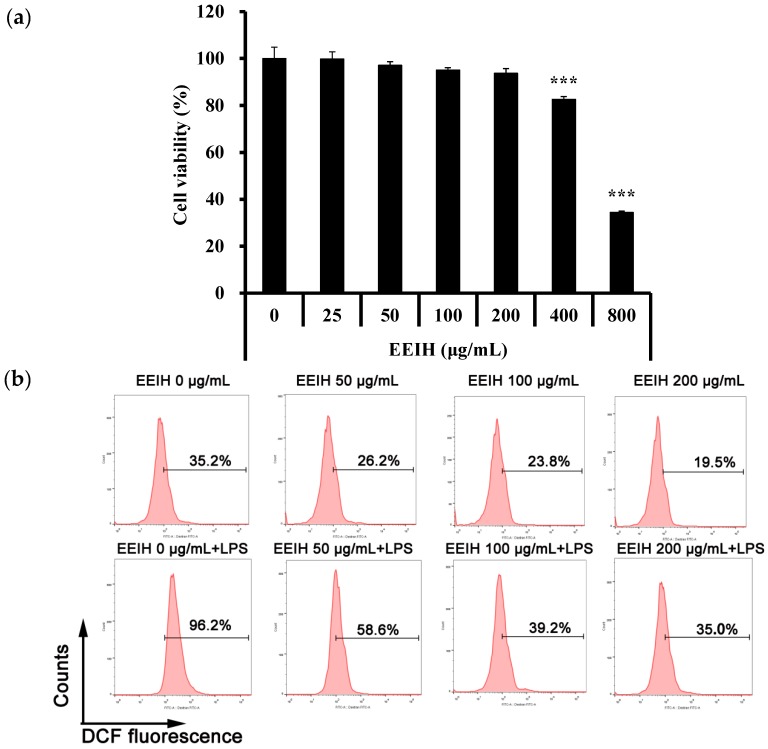
Figure 3.
Effect of EEIH on viability (a) and reactive oxygen species (ROS) production (b) of RAW264.7 cells. The values are presented as mean ± SD (n = 3). Significant differences with control cells were designated as *** p < 0.001. The figure shown is representative of three independent experiments.

