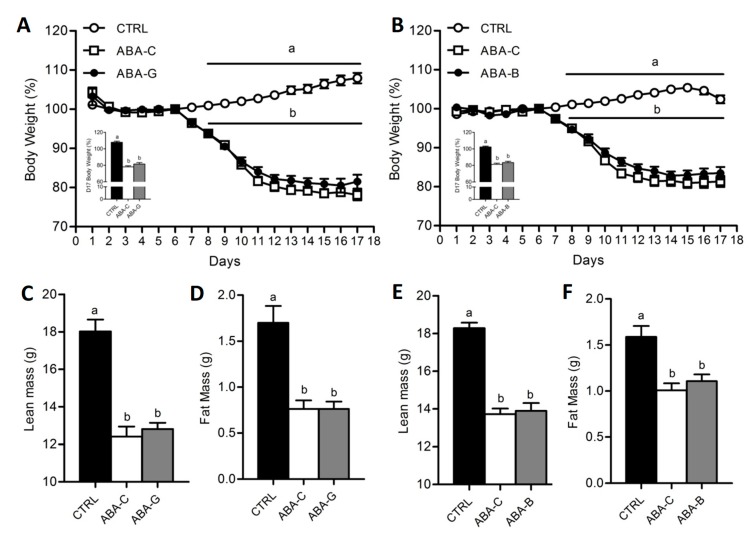
Figure 1.
Body weight, lean mass and fat mass. Body weight was monitored each day, expressed in percentage compared to day 6, for both Gln (A) and BCAA (B) series with control mice (CTRL; open circles), non-supplemented activity-based anorexia mice (ABA-C; open squares, n = 16) and supplemented activity-based anorexia mice (ABA-G or ABA-B; closed squares). Body change at day 17 was measured, expressed in percentage compared to day 6, for both Gln and BCAA. Lean and fat mass, expressed in grams, were measured by using Minispec for both Gln (C,D) and BCAA (E,F) series. Column bar graphs showed control mice (CTRL; black bars), non-supplemented activity-based anorexia mice (ABA-C; open bars) and supplemented activity-based anorexia mice (ABA-G or ABA-B; grey bars). Values without a common letter significantly differ (p < 0.05). The number of mice was n = 16 for CTRL, n = 16 for ABA-C and n = 12 for ABA-G (A,C,D) and n = 16 for CTRL, n = 16 for ABA-C and n = 14 for ABA-B (B,E,F).

