

Abstract
Methylation of cytosine to 5-methylcytosine (5mC) is a prevalent DNA modification found in many organisms. Sequential oxidation of 5mC by TET dioxygenases results in a cascade of additional epigenetic marks and promotes DNA demethylation in mammals1,2. However, the enzymatic activity and the function of TET homologs in diverse eukaryotes remains largely unexplored. In our study of TET homologs in the green alga Chlamydomonas reinhardtii, we have found a 5mC-modifying enzyme (CMD1) that catalyzes conjugation of a glyceryl moiety to the methyl group of 5mC through a carbon-carbon bond, resulting in two novel stereoisomeric nucleobase products. The catalytic activity of CMD1 requires Fe(II) and the integrity of its binding motif His-x-Asp (HxD), which is conserved in Fe-dependent dioxygenases3. However, unlike all previous described TET enzymes which utilize 2-oxoglutarate (2-OG) as a co-substrate4, CMD1 utilizes L-ascorbic acid (vitamin C, VC) as an essential co-substrate. VC donates the glyceryl moiety to 5mC with concurrent formation of glyoxylic acid and CO2. The VC-derived DNA modification is present in the genome of C. reinhardtii and its level decreases significantly in a CMD1 mutant strain. The fitness of CMD1 mutant cells during high light exposure is reduced. LHCSR3, a critical gene for protection of C. reinhardtii from photooxidative damage in high light, is hypermethylated and downregulated compared to wild-type cells, causing a lowered capacity for photoprotective non-photochemical quenching (NPQ). Our study thus reveals a new eukaryotic DNA base modification, which is catalyzed by a divergent TET homolog and unexpectedly derived from VC, and its role as a potential epigenetic mark that may counteract DNA methylation in the regulation of photosynthesis.
Main Text:
Enzymes that target or modify DNA are involved in the epigenetic control of multiple biological processes. In Arabidopsis, 5mC can be targeted directly by specific glycosylases to generate abasic sites5. In mammals, 5mC can be oxidized by Ten-Eleven Translocation (TET) dioxygenases to 5-hydroxymethylcytosine (5hmC), 5-formylcytosine (5fC) and 5-carboxylcytosine (5caC)6–9. Both of these 5mC processing mechanisms have been shown to promote DNA demethylation2,10,11. Although many other organisms, including the amoeba Naegleria gruberi and fungus Coprinopsis cinerea, contain 5mC and its oxidative derivatives12–14, other modes of 5mC processing have not been reported so far15.
The conserved TET-JBP domain responsible for dioxygenase activity can be readily identified in a wide variety of organisms, including C. reinhardtii, a unicellular green alga whose lineage diverged from land plants over a billion years ago16. Eight TET homologs were identifiable in the genome of C. reinhardtii17 (Extended Data Fig. 1). These CrTET proteins share the conserved HxD motif for Fe(II) binding with the dioxygenases from N. gruberi and mammals12,18. However, the binding sites for 2-oxoglutarate (2-OG) appear to be absent in the CrTET proteins, even though 2-OG is an essential co-substrate of all known dioxygenases in this family19.
To characterize the CrTET proteins, we performed a dioxygenase activity assay on recombinant proteins purified from E. coli. After incubation of a 5mC-containing DNA substrate with wild-type CrTET1, two unknown products (P1 and P2) were detected in HPLC analysis at retention times distinctive from the anticipated nucleosides. These products were not detected with mutant protein controls which lacked HxD or other conserved motifs (Fig. 1a and Extended Data Fig. 2a–c). The accumulation of these two products correlated with the reduction of 5mC abundance (Extended Data Fig. 2d, e). Neither 5hmC nor unmodified cytosine could be converted under the same conditions (Extended Data Fig. 2f). Thin-layer chromatography (TLC) analysis using 14C to trace the methyl group in 5mC confirmed the generation of two unidentified nucleotides and indicated that the methyl carbon has been retained in the products (Fig. 1b). These observations thus suggested CrTET1 as a novel 5-methylcytosine modifying enzyme (CMD1). Of note, two minor peaks appearing in the reaction products of wild-type but not the mutant CMD1 (Fig. 1a and Extended Data Fig. 2f) were confirmed to represent 5hmC and 5caC respectively (Extended Data Fig. 3a, b). This reveals an intrinsic capability of CMD1 similar to a conventional 5mC dioxygenase at least in vitro.
Figure 1. CMD1 catalyzes novel DNA modifications of 5-methylcytosine.

a, HPLC analysis of nucleosides from 5mC-containing DNA treated with wild-type (WT) CMD1 or a mutant proposed to lack activity (Mut; H345Y/D347A). P1 and P2 denote unknown modified nucleosides. AU, absorption units. Data shown are representative of at least three independent experiments.
b, TLC detection of the modified nucleotides. 5mC-DNA with a 14C-labeled methyl group was incubated with WT CMD1 and various mutants as indicated and hydrolyzed to nucleotides. P1/P2 indicate the new nucleotides detected on the autoradiogram. Markers were 32P-labeled nucleotides. Data shown are representative of two independent experiments. For source data, see Supplementary Figure 1.
To identify unknown nucleosides P1 and P2, we used high-resolution mass spectrometry. P1 yielded an [M+H]+ ion at m/z 332.1448 and P2 yielded an ion at 332.1449 (Fig. 2a), corresponding to the same molecular formula, C13H22N3O7+. To determine whether the addition of 90 Daltons to 5mC ([M+H]+, m/z 242.1134) occurs on the methyl group, 5mC-DNA with a fully deuterated methyl group was used as the substrate (Extended Data Fig. 3c). A 2-Dalton gain (m/z 334.1569 vs. 332.1449) was found in P1 and P2 (Fig. 2b and Extended Data Fig. 3d), indicating that the conversion of 5mC to P1 and P2 generates a new chemical bond to the methyl group of 5mC with the concomitant loss of a single deuterium. P1 and P2 have the same collision-induced dissociation (CID) fragmentation pattern in tandem mass spectrometry (Extended Data Fig. 3d), suggesting that they are stereoisomers. After neutral loss of a deoxyribose moiety, three subsequent smaller fragment ions differed in mass by the interval of a water molecule, suggesting the presence of three hydroxyl groups in both P1 and P2. These data suggest the addition of a glyceryl moiety to the methyl group of 5mC occurred during the CMD1-catalyzed reaction.
Figure 2. Structural determination of the modified nucleosides P1 and P2.

a, Mass spectrometry analysis of the HPLC fractions P1 and P2. Fragment ion at m/z 216 indicates a base product formed after neutral loss of a deoxyribose residue (molecular weight 116) from the precursor 2’-deoxynucleoside (m/z 332). The chemical formulas of P1 and P2 nucleosides were deduced from their high-resolution mass spectra. Data shown are representative of at least three independent experiments.
b, MS detection of P1 and P2 nucleoside generated from D3-labeled 5mC upon incubation with CMD1. The mass of resultant P1 and P2 increases by 2 units when the DNA substrate contains completely deuterated methyl groups in 5mC. Data shown are representative of two independent experiments.
c, Structures of P1 and P2 determined by two-dimensional nuclear magnetic resonance spectroscopic analyses and DFT calculations. P1 and P2 are stereoisomers having different configurations at C8.
Figure 3. Vitamin C is required as a glyceryl donor in CMD1-catalyzed 5mC modification.

a, Dependence of CMD1 activity on VC to modify 5mC. Reactions were performed under indicated conditions for HPLC detection of P1 and P2 nucleosides. Data shown are representative of at least three independent experiments.
b, Isotope tracing of P1 nucleoside using 13C-labeled VC. Reactions were performed using 12C- or 13C-VC and molecular weights of P1 nucleosides were measured with mass spectrometry. Data shown are representative of two independent experiments.
c, The CMD1-catalyzed modification of 5mC in the presence of VC and O2. As a co-substrate in the reaction, VC provides a glyceryl moiety (highlighted in red), which is transferred onto the methyl group of 5mC to produce the P1 and P2 forms of 5gmC nucleotides in DNA. The wavy line linking a hydroxyl group to C8 in the base product denotes the presence of the two configurations identified for the stereoisomers P1 and P2 (Fig. 2c).
Structures of P1 and P2 were determined using NMR spectroscopy and density functional theory (DFT) calculation. Cross-peaks in the 1H-1H COSY and TOCSY spectra (Extended Data Fig. 4a–c) revealed P1 having deoxyribose, cytosine and trihydroxybutyl (THB) moieties with connectivity between cytosine and THB via an oxygen-free CH2. The 1H-13C HSQC and HMBC spectra (Extended Data Fig. 4d–f) further confirmed P1 structure as 5-(1-[2, 3, 4-trihydroxybutyl])-2’-deoxycytidine (Fig. 2c) with all proton and carbon signals unambiguously assigned (Extended Data Table 1). The J-coupling constants of protons attached to the chiral carbons (i.e., C8, C9) were used to determine the absolute configurations of these two carbons according to the Karplus equation20. Comparison of these J-coupling constants from NMR experiments and DFT calculations (Extended Data Table 1) revealed P1 having an 8S and 9S configuration, while P2 is a stereoisomer of P1 (Extended Data Fig. 5) differing only in the configuration at C8, with an 8R and 9S geometry (Fig. 2c). P1 and P2 were thus identified as 5-glyceryl-methylcytosines (5gmC).
To identify the origin of the glyceryl group transferred to 5mC, we expressed CMD1 in E. coli growing in M9 minimum medium containing 13C-glucose as the only carbon source. No increase was observed in the m/z of P1 product resulted from the use of the 13C-CMD1 enzyme prepared (Extended Data Fig. 6a), excluding the possibility that the glyceryl group arose from a component associated with CMD1. Although O2 was indispensable for the reaction (Extended Data Fig. 6b), the oxygen atom from either O2 or H2O was not incorporated into P1 nucleoside (Extended Data Fig. 6c). These observations prompted us to search for a glyceryl-containing component in the reaction buffer which was necessary for the 5mC modification. We found that the reaction was completely dependent on the presence of L-ascorbic acid (vitamin C, VC) and Fe2+, but not 2-OG (Fig. 3a and Extended Data Fig. 6d, e). VC typically acts as an enhancing factor to facilitate the stabilization of Fe2+ and is non-essential for previously characterized dioxygenases, such as human TET27 (Extended Data Fig. 6f). In contrast, the substitution of VC with its analogs or derivatives did not support the activity of CMD1 (Extended Data Fig. 6g–i). Replacing unlabeled VC with uniformly 13C-labeled VC (13C6-VC) increased the mass of P1 nucleoside by 3 Daltons, providing support for VC as the donor of the 3-carbon unit for 5mC alkylation (Fig. 3b). Furthermore, using selectively 13C-labeled VC proved that C4-C6 of VC were incorporated into the P1 nucleoside (Extended Data Fig. 7a, b). These observations provide evidence that VC specifically contributes to the glycerylation as an essential co-substrate in CMD1-mediated 5mC modification.
Given the essentiality of Fe2+ and its binding motif His-x-Asp but distinct co-substrate requirements (Fig. 3a–b and Extended Data Fig. 6d–i), we propose a CMD1 reaction mechanism similar to that of the 5mC oxidation catalyzed by Fe(II) and 2-OG dependent TET dioxygenases3,12. CMD1 utilizes VC in the place of 2-OG, and O2 for coordination with ferrous iron, yielding an FeIV=O intermediate through oxidative decarboxylation of VC (Extended Data Fig. 7c). This intermediate is reactive and may abstract a hydrogen atom from 5mC to initiate a C-C bond cleavage of coordinated L-xylonic acid and attack of the resulting 5mC radical, leading to the production of 5gmC nucleotides in DNA and glyoxylate as a co-product. This mechanism is consistent with the mixed stereochemistry observed at C8 in P1 and P2. To confirm this hypothesis, we used GC-MS to detect CO2. In the presence of 13C6-labeled VC, 13C-labeled CO2 (MW 45.0) was produced, and selective 13C-labeling of VC confirmed that CO2 was derived from C1 of VC (Extended Data Fig. 7d). Furthermore, glyoxylic acid was also identified by LC-MS analysis after derivatization with 2,4-dinitrophenylhydrazine (DNP), thus clarifying the fate of the remaining carbons C2-C3 of VC (Extended Data Fig. 7e). Therefore, CMD1 appears to be a novel VC-dependent oxygenase catalyzing the reaction that leads to the transfer of the glyceryl portion of VC to 5mC to produce 5gmC in DNA along with the generation of CO2 and glyoxylic acid as co-products (Fig. 3c).
5gmC was unambiguously detected in vivo at the level of about 10 per million cytosines or at 0.25% of 5mC in the genomic DNA of wild-type C. reinhardtii (Fig. 4a). To verify that 5gmC is generated by CMD1, a CMD1 mutant (hereafter cmd1) strain was generated using the CRISPR/Cas9 system (Extended Data Fig. 8a–f). The amount of 5gmC decreased by ~60% and the 5mC level doubled in the cmd1 mutant compared to wild-type cells (Fig. 4a). To examine whether VC is the glyceryl donor for 5gmC formation in vivo, VC-deficient strains (hereafter vtc2) were generated by knocking out the key VC synthesis gene VTC221 (Extended Data Fig. 9a). In vtc2 mutant strains, VC content was reduced to ~10% of the wild-type level (Extended Data Fig. 9b). Consequently, 5gmC decreased by ~80%, and 5mC doubled in the mutant (Fig. 4a). When wild-type C. reinhardtii was grown in the presence of 5-azacytidine, an inhibitor of DNA methyltransferases, the 5mC level was reduced by over 50%. As a consequence, the 5gmC level was decreased by 13% (Extended Data Fig. 10a). These data provide support that the 5gmC is derived from VC and 5mC in vivo.
Figure 4. Identification of the VC-derived modification and its function in the regulation of photosynthesis in C. reinhardtii.

a, Quantification of 5gmC and 5mC in WT, cmd1 or vtc2 cells using triple-quadrupole tandem mass spectrometry. Data are represented as mean ± S.E. from three independent biological replicates. Individual replicates are shown as circles.
b, Erlenmeyer flasks containing different cells growing photoautotrophically after 16 h of exposure to low or high light. Shown are representative photographs from three independent experiments. The npq4 strain is the double mutant of LHCSR3.1 and LHCSR3.2.
c, NPQ induction of WT, cmd1, cmd1 expressing WT CMD1, the catalytically inactive mutant of CMD1 (CMD1-HD) or LHCSR3, and npq4 cells. Cells were grown photoautotrophically at 180 μmol photons·m−2·s−1 for 24 h and NPQ was recorded upon illumination with 600 μmol photons·m−2·s−1 for 5 min (white bar) followed by 2.5 min of darkness (black bar). Data shown are means ± S.E. of five independent biological replicates.
d, Western blot analysis of the LHCSR3 accumulation after exposure to low (LL) or high light (HL). α-Tubulin was used as a sample processing control. Representative results are shown from three independent experiments. For source data, see Supplementary Figure 1.
e, Quantitative analysis of LHCSR3.1 and LHCSR3.2 mRNA in WT and cmd1 cells after exposure to low or high light. The expression levels were first normalized to GBLP, then compared to those of WT under high light, which were set to 1.0. Data presented are mean ± S.E. of three independent biological replicates. Individual replicates are shown.
f, Methylation analysis of the 5’ region of LHCSR3.1 in WT, cmd1 as well as the complemented strains. Cells were grown under high light. The open and black circles represent unmethylated and methylated CpG sites respectively. Representative results are shown from three independent experiments.
Despite the marked alteration of the genomic 5gmC and 5mC levels, the cmd1 strain did not exhibit noticeable morphological and growth phenotypes under low light. However, when cultured photoautotrophically in high light, cmd1 cells were more prone to photodamage compared to wild-type cells (Fig. 4b). This phenotype co-segregated with the CMD1 mutation following mating and tetrad dissection (Extended Data Fig. 8g). Non-photochemical quenching (NPQ) is a photoprotective process known to promote fitness in high light and this phenomenon requires LHCSR3 (light harvesting complex stress related protein 3)22. Complete knockout of LHCSR3 (npq4) resulted in severely impaired NPQ induction (Fig. 4c). In cmd1 cells, NPQ induction was similarly compromised upon high light exposure (Fig. 4c). Additionally, the photosynthetic electron transport rate (ETR) was also reduced during high light fluxes in cmd1 cells (Extended Data Fig. 10b). This suggests that the increased sensitivity in excess light could be due to an overall reduced photosynthetic capacity. RNA-Seq analysis revealed the altered expression of over 20 photosynthesis-related genes, including a reduction in transcripts of LHCSR3 (Extended Data Fig. 10c–e). Further analysis showed that both the protein and mRNA expression levels of LHCSR3 were lower in the cmd1 mutant compared to the wild-type after exposure to high light (Fig. 4d, e).
To examine the link of altered gene expression with localized 5mC change, we performed whole-genome bisulfite sequencing on both WT and cmd1 strains. In the wild-type strain, lower expressed genes tended to be more methylated and genes that gained promoter methylation in the cmd1 mutant tended to be downregulated compared to the wild-type (Extended Data Fig. 10f–k). This indicates an inverse correlation between DNA methylation and gene expression in C. reinhardtii. Bisulfite sequencing confirmed the hypermethylation in the analyzed region 5’ of LHCSR3 in cmd1 cells (Fig. 4f and Extended Data Fig. 10l), which may have led to the impaired expression of LHCSR3 in cmd1 cells. Consistently, vtc2 cells depleted of intracellular VC also showed increased methylation and reduced expression of LHCSR3, as well as compromised NPQ induction (Extended Data Fig. 9c–e). On the other hand, VTC2 expression and the VC content in cmd1 cells were upregulated compared to wild-type (Extended Data Fig. 9b, f). This implies both the existence of a compensatory mechanism and a functional connection between VC content and NPQ capacity regulated by CMD1.
To further confirm the requirement of CMD1 function in regulating photoacclimation, complementation experiments were performed. Constitutive expression of the wild-type CMD1 but not the catalytically inactive mutant in cmd1 cells restored hypomethylation and expression of LHCSR3 together with NPQ-mediated photoprotection (Fig. 4c, f & Extended Data Fig. 11a–d). Rescue of the phenotypic and molecular defects in cmd1 cells was also achieved by constitutive expression of LHCSR3 (Fig. 4c & Extended Data Fig. 11a, c–d). These data link the function of CMD1 with the regulation of photosynthesis through the controlof LHCSR3 expression.
The 5mC increase both globally and locally at the 5’ region of LHCSR3 (Fig. 4a, f) in cmd1 cells suggested that CMD1 may function to counteract cytosine methylation in suppressing transcription, reminiscent of the role of TET dioxygenases in antagonizing DNMTs in mammals23. However, the biological significance of cytosine methylation in C. reinhardtii has been under-investigated and unlike in other organisms, no correlation between 5mC deposition and gene expression has been established24. To test the role of 5mC and 5gmC on gene expression, these two modifications were introduced on two luciferase reporter plasmids in vitro prior to transformation into C. reinhardtii. While 5mC alone conferred a strong and stable transcriptional repression to the reporter, its conversion to 5gmC led to significant alleviation of the repression in a time-dependent manner (Extended Data Fig. 11e), correlated with the de-modification of 5gmC to cytosine (by 13.4% at 48 h) as revealed by 5gmC mapping experiments (Extended Data Fig. 11f–h). These observations indicate that 5gmC can promote demethylation and thus increase gene expression. Of note, the relevance of 5gmC in the control of target genes in vivo was also supported by ChIP data showing the enrichment of CMD1 at the 5’ region of LHCSR3 (Extended Data Fig. 11i).
In this study, we have shown that 5mC in the C. reinhardtii genome can be further modified by the addition of a glyceryl group from VC to form 5gmC, a novel nucleobase generated by the TET homolog CMD1. VC is widely believed to function as an antioxidant and promotes the recycling of Fe2+ in numerous contexts, including the epigenetic reprogramming of cell fates by TET enzymes and histone demethylases25,26. Our observation that VC acts as an essential co-substrate raises the intriguing possibility that VC might have a more direct role in epigenetic regulation. Functionally, our data implicate the role of CMD1-catalyzed glycerylation of 5mC in the control of the transcriptional competence of LHCSR3, a gene critical for the acclimation of algal cells to excess light22,27. This observation adds an additional layer of complexity to the regulation of photoprotection via LHCSR3, which is induced by a blue light sensing photoreceptor28. Our data suggests that the repressive effect of 5mC on transcription might be conserved in C. reinhardtii. Although 5gmC itself appears to negatively impact transcription, it can promote demethylation and thus de-repression over time. Among other possibilities, the demethylation process triggered by 5gmC could take place either through passive dilution due to inhibition of maintenance methylation or through base excision repair by a specific glycosylase capable of excising 5gmC. The C. reinhardtii genome indeed contains homologues of TDG and AlkD glycosylases, which are able to excise 5caC and bulky base modifications respectively6,29. Further understanding of the role and interplay of the two cytosine modifications present in the C. reinhardtii genome requires the generation and analysis of mutants completely depleted of 5gmC formation. 5gmC can, in principle, function as an independent epigenetic mark, similar to 5mC and N6-methyladenine marks in various organisms30. Finally, given its selectivity, 5gmC modification by CMD1 might be of utility in DNA technologies such as the genome-wide mapping of 5mC.
Methods
CMD1 recombinant protein expression and purification.
The ORF of CMD1 (Cre12.g553400.t2.1, Phytozome) was cloned into modified pET28a (pPEI-His-SUMO supplied by Yanhui Xu)18 and the construct was transformed into E. coli strain BL21 (DE3). The CMD1 mutants were constructed in the same vector. The bacterial cells grown to an absorbance of 0.8 at OD600 were induced with 0.1 mM isopropyl-β-D-thiogalactopyranoside (IPTG) at 16 °C for 16 h. Tagged CMD1 protein was bound to Ni-NTA beads (Qiagen) and cleaved off from the His-SUMO tag by overnight incubation with His-tagged Ulp1 protease at 4 °C. The collected CMD1 protein was further purified using a Resource Q anion exchange column (GE Healthcare) with a linear gradient of buffer A (20 mM Tris-HCl, pH 8.5)/buffer B (20 mM Tris-HCl, pH 8.5, 1 M NaCl) from 100/0 to 50/50, and a Superdex 200 10/300 GL gel filtration column (GE Healthcare) in buffer (20 mM HEPES pH 7.0, 100 mM NaCl). The protein was concentrated to 10 μg/μl using Ultracel-10K centrifugal filters (Millipore).
Preparation of DNA substrates for CMD1 reaction in vitro.
A 1.1-kb 5mC-containing DNA fragment (5mC-DNA) was prepared by PCR amplification from a randomly selected portion of C. reinhardtii genomic DNA using 5-methyl-dCTP. 5-hydroxymethyl-dCTP and unmodified dCTP were also used in PCR to prepare 5hmC-DNA and C-DNA in order to test the substrate specificity of CMD1. The forward primer used was 5’-biotin- AAGGGTTGGATTGTAGGTAGTTTAGAAAT-3’ and the reverse primer was 5’- TGAGGGTGGTAAATTAG-3’.
Dioxygenase assay.
Typically, 0.5 μg of biotinylated 5mC-DNA was incubated with 4 μg of CMD1 or hTET2 enzyme (at about 1:2 molar ratio of enzyme to 5mC) in a total volume of 100 μl at 37 °C for 1 h in the presence of 50 mM HEPES (pH 7.0 for CMD1, pH 8.2 for hTET2), 50 mM NaCl, 1 mM L-ascorbic acid, 1 mM 2-OG, 0.1 mM Fe(NH4)2(SO4)2, 1 mM DTT and 1 mM ATP according to previously described6. For 13C-tracing experiment, 13C-labeled L-ascorbic acid (Omicron Biochemicals) was used in the reaction. After treatment with proteinase K (Lifefeng, RE111–03), the DNA was purified using Streptavidin Sepharose beads (GE Healthcare) following the manufacturer’s instruction.
HPLC analysis of nucleoside hydrolysates of CMD1-modified DNA.
HPLC analysis was performed as previously described6. Briefly, the purified biotinylated DNA was digested by nuclease P1 (Sigma) in the presence of 0.2 mM ZnSO4 and 20 mM NaAc (pH 5.3) at 55 ºC for at least 1 h and then was dephosphorylated with Calf Intestinal Alkaline Phosphatase (CIAP, Takara) at 37ºC for additional 1 h. The samples were centrifuged and the supernatants were analyzed by an Agilent 1260 HPLC with a Welch AQ-C18 column (4.6 × 250 mm, 5 μm) at 15 °C. The mobile phase was 10 mM KH2PO4 (pH 3.95), running at 0.6 ml/min or 20 mM NH4Ac (pH 5.21), running at 1 ml/min, and the detector was set to 280 nm.
Labeling of DNA substrate at 5mC with 14C isotope or D (deuterium or 2H).
5 μg of plasmid DNA was incubated with 20 units of M.SssI CpG methyltransferase (Zymo Research) and 8 μl of S-[methyl-14C]-adenosyl-L-methionine (14C-SAM, 1.48–2.22 GBq/mmol, PerkinElmer) or S-[methyl-D3]-adenosyl-L-methionine ([methyl-D3]-SAM, Zzstandard) in a total volume of 100 μl at 30 °C overnight. The DNA was purified using Qiaquick Nucleotide Removal Kit (Qiagen) and used for CMD1 reaction.
Analysis of 5mC derivatives using thin-layer chromatography (TLC).
Briefly, after incubation of 14C-5mC-DNA with CMD1, the samples were treated with proteinase K and purified by phenol-chloroform extraction and ethanol precipitation before dissolved into 8 μl water. The DNA was digested using nuclease P1 and then 0.5 μl of the digestion product was spotted on PEI-cellulose TLC plate (Merck). The plate was developed in isopropanol: HCl: H2O (70:15:15) and then analyzed by phosphorimager scanning with FujiFilm Fluorescent Image Analyzer FLA-3000.
LC-MS analysis.
For the determination of the molecular weight of the new products of 5mC generated in CMD1-catalyzed reaction, nucleoside fractions of interest were collected from HPLC and subjected to mass spectrometry analysis. UPLC-MS/MS was performed using a Q Exactive (Thermo Scientific) mass spectrometer in positive-ion mode with an ACQUITY UPLC HSS T3 (1.8 μm, 2.1 mm × 100 mm, Waters) column. Buffer A (water containing 0.05% CH3COOH) and B (acetonitrile, ACN) were used as mobile phase at a flow rate of 0.3 ml/min. The gradient began with a condition of 100% A, followed by a linear gradient of 95% A at 2 min, 50% A at 4 min, which was held for 1 min, followed by 0% A at 5.1 min, then re-equilibrated to the starting condition at 8 min, holding for 1 min.
For glyoxylic acid analysis, the reaction mixture was filtered after the reaction to remove proteins and precipitates. Derivation was carried out using 2,4-dinitrophenylhydrazine (DNP) as previously described31 before subjected to LC-MS analysis. The LC-MS program was identical with nucleoside analysis.
For the quantitative determination of the content of 5gmC nucleosides in genomic DNA, multiple reaction monitoring (MRM)-based LC-MS/MS analysis was used. The LC-MS/MS analyses were performed using a UPLC system (1290 series, Agilent Technologies) coupled to a triple quadrupole mass spectrometer (Agilent 6495 QQQ, Agilent Technologies). An ACQUITY UPLC BEH amide column (1.7 μm; 2.1 mm × 100 mm, Waters) was used for the LC separation. The mobile phases A = 25 mM ammonium acetate and 25 mM ammonium hydroxide in 100 % water and B = 100 % acetonitrile, were used for compound separation. The linear gradient elutes from 85 to 40 % B (0–2 min), 40% B (2–4 min), 40 to 85% B (4–4.1 min), then stays at 85 % B until 7 min for re-equilibrium. The flow rate was set to 0.6 mL/min. Optimized MRM transition parameters for each of nucleosides 5gmC, 5mC and C, G were obtained using pure compound standards. 5gmC: 332.1/216.1 (quantifier transition, CE 24); 332.1/150.0 (qualifier transition, CE 44); 5mC: 242.1/126.1 (quantifier transition, CE 8); 242.1/54.3 (qualifier transition, CE 60); C: 228.1/112.1 (quantifier transition, CE 8); 228.1/41.3 (qualifier transition, CE 64); G: 268.1/152.1 (quantifier transition, CE 21); 268.1/135 (quantifier transition, CE 45). All compounds were measured on positive ESI mode. Then the retention time for each compound was individually determined by measuring the corresponding MRM transitions on the BEH amide column. For 5gmC: 2.04 min; 5mC: 1.26 min; C: 1.32 min; G: 1.37 min. The amount of each nucleoside was calculated according to the peak areas of quantifier MRM transitions: 5gmC (332.1/216.1), 5mC (242.1/126.1), C (228.1/112.1) and G (268.1/152.1) by interpolation from the standard curves.
GC-MS analysis.
For the analysis of CO2, the CMD1-catalyzed reaction was performed in sealed vials under N2 atmosphere in a glove box, with air blown of pure O2 manually. The reaction products within the vials were directly subjected to GC-MS analysis using an Agilent 7890A GC, equipped with an Agilent J&W GC 113–3133 column (30 m × 320 μm × 3 μm) and a mass spectrometer 5975C as detector. Helium was used as carrier gas, at a flow rate of 1.5 ml/min. Oven temperature was initially 35 °C for 6 min, then gradually increased to 320 °C at 11 min.
Determination of cellular content of VC
The method for VC content quantification was based on a published protocol32, but with some modifications. The algal cells were cultured in TAP medium to mid-exponential phase. 1 × 10⁷ cells were harvested in a 1.5 ml centrifuge tube and washed with 1 ml water. Cell pellet was frozen in liquid nitrogen. VC was extracted by adding 300 μl of extraction buffer (2 mM EDTA, 10 mM DTT) followed by vigorous shaking. 100 μl of glass beads (Sigma) were added and vortexed using a bead-beater at maximum speed for 30 s. The samples were centrifuged at 19,000 × g at 4 °C for 30 min. The supernatant was collected and filtered into chromatographic vials using 4 mm hydrophilic PTFE syringe filters with a pore size of 0.22 μm (Microlab).
VC was quantified using LC-MS. It was separated chromatographically using a Q Exactive™ LC-MS system (Thermo Scientific) with an ACQUITY UPLC BEH Amide Column (130Å, 1.7 μm, 2.1 mm × 50 mm, Waters) with negative ion mode. The tray temperature of the autosampler was set at 4 °C and the column oven temperature at 30 °C. For the elution of VC, the flow rate was set at 0.3 ml/min, and the mobile phase used was A = 25 mM NH4Ac + 25 mM NH3·H2O, B = ACN. The linear gradient eluted from 95% B for 2 min, 95% B to 40% B (2 min-6 min), then stayed at 40 % B until 9 min for re-equilibrium. The amount of VC was calculated according to the calibration curve. The cellular VC concentration was calculate using the following formula (The average cell volume for C. reinhardtii is about 200 fl):
Structural determination of P nucleosides by nuclear magnetic resonance.
Up to 40 μg of purified P1 and P2 nucleosides were dissolved respectively in 50 μl of phosphate buffer (0.1 M in D2O, pD 7.4)33 and their NMR data were acquired on Bruker 600 MHz and 850 MHz spectrometers both equipped with 5-mm cryogenic TCI probe. One-dimensional 1H NMR spectra and a set of two-dimensional (2D) NMR spectra were recorded and processed as reported previously34 including 1H-1H COSY (Correlation Spectroscopy), 1H-1H TOCSY (Total Correlation Spectroscopy), 1H JRES (J-Resolved Spectroscopy), 1H-13C HSQC (Heteronuclear Single Quantum Correlation) and 1H-13C HMBC (Heteronuclear Multiple Bond Correlation) 2D spectra. The 1H and 13C chemical shifts were referenced to methyl signals of TSP (δH 0.000, δC 0.00). For the stronger proton coupling systems and more complex split peaks, the accurate chemical shifts and coupling constants were simulated with NMR-Sim5.435.
Three-bond 1H-to-1H J-coupling constants (3JH-H) were calculated for those protons attached to the chiral carbons (C8 and C9) and their adjacent carbons (C7 and C10). For both nucleosides P1 and P2, such constants were calculated for all four possible configurations (i.e. 8R,9R; 8S,9S; 8R,9S; 8S,9R) using the density function theory (DFT) approach after molecular geometries were fully optimized at the wb97xd/6–311G (d,p) level. All calculations were carried out using the Gaussian 09 software package with the Fermi contact, diamagnetic spin-orbit, paramagnetic spin-orbit and spin-dipole terms being taken into consideration according to the Ramsey theory36.
C. reinhardtii strains and culture conditions.
Wild-type strains (CC124 and CC125) were obtained from the C. reinhardtii Resource Center. The npq4 mutant strain22 is a kind gift from Dr. Wenqiang Yang. All strains were cultured mixotrophically in Tris/acetate/phosphate (TAP) medium on a rotary shaker at 25 °C and maintained at a light intensity of 20 μmol photons·m−2·s−1. In the experiment, cells were transferred to Sueoka’s high salt medium (HSM)37 at 1×10⁵ ml−1 and exposed to light intensity as described in the main text and figure legends. For mRNA quantification, protein immunoblotting and bisulfite sequencing analysis, low light refers to ~20 μmol photons·m−2·s−1, high light refers to ~300 μmol photons·m−2·s-1. For the phenotype characterization, the cells were grown at ~300 μmol photons·m−2·s−1 to 1×10⁶ ml−1 and treated at low light (~50 μmol photons·m−2·s−1) or high light (~750 μmol photons·m−2·s−1) for at least 16 hours.
For 5-aza-2’-deoxycytidine (5-aza, Sigma) treatment, CC125 cells at cell density of 1.2×10⁴ ml−1 were cultured in TAP medium in the presence of 400 μM 5-aza. At day 2 the medium was changed to TAP medium with fresh 400 μM 5-aza and the cells were harvested at day 4 for further analysis.
Gene editing in C. reinhardtii based on CRISPR/Cas9-mediated co-selection.
The principle and the flow chart of gene editing procedure we developed are summarized in Extended Data Fig. 8a, b. Briefly, pPEI-His-SUMO-SpCas9 plasmid was transformed into E. coli strain Transetta (DE3) (TransGen Biotech). SpCas9 protein was bound to Ni-NTA beads and collected from the resin in elution buffer (20 mM HEPES, pH 7.5, 150 mM KCl, 1 mM DTT, and 10% glycerol). The eluted sample was next loaded into a 5-ml HiTrap SP HP Sepharose column (GE Healthcare Life Sciences) and eluted with buffer A (20 mM HEPES pH 7.5, 1 mM DTT and 10% glycerol) with a linear gradient of 100 mM to 1 M KCl. The fractions containing SpCas9 was mixed and concentrated to 500 μl with a centrifugal filter (30 kDa, Millipore) and further purification was performed by gel filtration on a Superdex 200 16/300 column (GE Healthcare Life Sciences) in GF buffer (20 mM HEPES pH 7.5, 150 mM KCl, 1 mM DTT and 10% glycerol). The eluted SpCas9 sample was then filtered through a 0.2 μm Whatman filter to remove possible bacteria contamination.
The single guide RNAs (sgRNAs) in C. reinhardtii were designed using CRISPR RGEN Tools (http://www.rgenome.net/cas-designer/). The sgRNA was prepared in vitro using the MEGAshortscript T7 kit (Ambion). The sgRNA sequences are: MAA7: CAUAGCGACCAUUUGCGUCC; CMD1: GGAACAUCUCGUCGCAUGCU; VTC2: UUUCCCGGCUACUGGCGUUU. Genotyping primers are as follows: MAA7-F: GCGTAATTCGGCTACTTTCAC; MAA7-R: TCTCAGCAAACACCCGTCATT; CMD1-primer1-F: TGCTATGGGCGTCTCGCTCAC; CMD1-primer2-F: CGTTTAACGACTGGAAGGCTGC; CMD1-primer1/2-R: TCGGCATGGATAGATGGTCAGAC; CMD1-primer3-F: GCAAAATGAGTGTCGCCCTA; CMD1-primer3-R: TAGAAAACCACCTCCTGCCC; VTC2-F: GGAGCTTTTCGTCGATCAACA; VTC2-R: CGTCTGTCACTGCAACTACG.
For the transformation experiment, C. reinhardtii cells (CC125, mt+) were grown to a cell density of 2×10⁶ cells ml−1 in TAP medium. For electroporation, 2×10⁷ cells were suspended in 1 ml Max Efficiency Transformation Reagent (Thermo Fisher Scientific), followed by suspension in the same reagent supplemented with 60 mM sorbitol. Purified SpCas9 (100 μg, 0.53 nmol) in storage buffer (20 mM HEPES pH 7.5, 150 mM KCl, 1 mM DTT, and 10% glycerol) was pre-incubated with the sgRNA for MAA7 and the sgRNA for the CMD1 gene (0.8 nmol each) at a 1:1.5:1.5 molar ratio at 37 °C for 15 min to assemble ribonucleoprotein (RNP) complexes. For co-transformation of C. reinhardtii, 250 μl of cell suspension (5×10⁶ cells) were mixed with the preincubated RNP complexes. Cells were electroporated in a 4 mm cuvette (600 V, 50 μF, infinite resistance) using Gene Pulser Xcell (Bio-Rad) as described by Kwangryul Baek38. Immediately after electroporation, 600 μl of TAP with 60 mM sorbitol were added. Cells were recovered overnight in 10 ml TAP with 60 mM sorbitol shaken at 110 rpm under continuous low light and then plated onto TAP media supplemented with 25 μM 5-fluoroindole (5-FI) and 20% starch. The plates were incubated under 30 μmol photons·m−2·s-1. The 5-FI resistance colonies appeared after 5–7 days and were picked up for genotype characterization.
Backcross and random spore analysis.
The selected cmd1 mutant clone was backcrossed with wild-type CC124 (mt-) to segregate the MAA7 mutation from other potential off-target genetic alterations. For gametogenesis, 20 ml of each type of vegetative cells were cultured to a concentration of 2× 10⁶ ml-1. The cells were resuspended and cultured in M1 medium depleted of nitrogen under a light intensity of 120 μmol photons·m−2·s−1 for 18 h. Gametes were mixed in the dark for 2 h then 0.2 ml of the mixed cultures were spread onto a 4% agar TAP plate and exposed to light for 1 d and then stored at darkness for 5 d for maturation of zygotes. All the cells were collected and subjected to the treatment with 2% SDS for 2 h at room temperature. Subsequently, the cells were washed with TAP medium for at least 6 times before plating onto a TAP plate. After zygotes germination, the cells were diluted and plated onto a TAP plate again to isolate single clones for genotyping. Multiple independent cmd1 clones obtained from two consecutive crosses were used for phenotype characterization.
For the random spore analysis, the gametes on 4% agar plates were removed with a razor blade (the zygotes stick to the agar plate) and the remaining gametes were killed with chloroform. About 30 zygotes on a small piece of agar were transferred to the germination plate (1% TAP agar plate) and incubated under the light for 20 h. Then 0.1 ml TAP medium was added on the agar to release the daughter cells from the zygotes, and then the medium was spread onto the whole plate. After 5–8 days, meiotic products grew into visible colonies that were picked for subsequent analysis. The colonies were grown in 1 ml of TAP medium in 24-well plates at low light for 2 days, and then diluted to OD620 = 0.1 with TAP medium. 3 μl of cells were spotted on 1.5% agar plates and the plates were incubated in low light (20 μmol photons·m−2·s−1) or high light (1000 μmol photons·m−2·s−1) for 66 hours.
Gene complementation in C. reinhardtii.
For the complemented expression of wild-type or mutant CMD1 in the cmd1 strain, the Hsp70A/Rbcs2 (HSRB) fusion promoter and PsaD terminator were used. A HA-tag coding sequence was fused at the C terminus-coding sequence of a cloned CMD1 genomic fragment. The paromomycin resistance gene AphVIII was fused downstream as a selection marker. For the expression of LHCSR3, the Hsp70A/Rbcs2 fusion promoter and PsaD terminator were added to the full-length genomic LHCSR3.1 gene. In this construct, the AphVIII marker driven by Hsp70A/Rbcs2 fusion promoter was included. The constructs were introduced into cmd1 cells by electroporation using BTX Gemini SC2 Electroporation System in a 4 mm cuvette (600 V, 50 μF, infinite resistance). The transformants were screened for their resistance to 10 μM paromomycin and identified by Western blot analysis with anti-HA (Cell Signaling Technology) and anti-LHCSR3 (Agrisera) antibodies.
RNA preparation and gene-specific mRNA quantification.
Total RNA was extracted from C. reinhardtii using Trizol™ (Thermo) according to the instruction manual. To measure the gene expression level, quantitative RT-PCR was performed using CFXP6™ Real-Time PCR with SYBR Premix™ Ex Taq (Tli RNaseH Plus, Takara). A gene encoding G-protein-subunit-like protein (GBLP) was used as the endogenous control.
The primers used were: LHCSR3.1-qRT-F (5ʹ-CACAACACCTTGATGCGAGATG-3ʹ), LHCSR3.1-qRT-R (5ʹ-CCGTGTCTTGTCAGTCCCTG-3ʹ), LHCSR3.2-qRT-F (5ʹ-TGTGAGGCACTCTGGTGAAG-3ʹ), LHCSR3.2-qRT-R (5ʹ-CGCCTGTTGTCACCATCTTA-3ʹ), VTC2-qRT-F (5ʹ TGCTAAAGCTGCTGCCGACATTG-3ʹ), VTC2-qRT-R (5ʹ CACTGAGACACGTCGTACCTGAAC-3ʹ)
GBLP-qRT-F (5 ʹ-CAAGTACACCATTGGCGAGC-3ʹ) and GBLP-qRT-R (5ʹ-CTTGCAGTTGGTCAGGTTCC-3ʹ).
Western blot analysis.
Cells were harvested by centrifugation at 12,000 × g for 30 s, and resuspended in 60 μl of SBA buffer (100 mM DTT, 100 mM Na2CO3), with 40 μl of SBB buffer (30% sucrose, 5% SDS). The samples were vortex for 20 min at room temperature and then subjected to 3 freeze/thaw cycles. After centrifugation, the supernatants were loaded on a 10%−12.5% SDS-PAGE gel and the proteins were blotted onto a nitrocellulose membrane. Membranes were blocked for 0.5 h with 5% milk in TBST and then incubated with anti-LHCSR3 polyclonal antibody (Agrisera), diluted 1:10,000 in TBST or anti-HA mono-clonal antibody (Cell Signaling Technology), diluted 1:1,000, anti-α-Tubulin mono-clonal antibody (Sigma) diluted 1:1,000 for one hour and then rinsed three times for 5 min before incubation with peroxidase-conjugated affinipure goat anti-rabbit IgG (Jackson) or peroxidase-conjugated affinipure goat anti-mouse IgG (Jackson) both diluted 1:10,000 for 1 hour. The blots were developed with ECL detection reagent (Millipore) and images of the blots were obtained using a CCD imager (Thermo).
Large-scale DNA preparation from C. reinhardtii.
Total DNA was isolated using CTAB method described by Maniatis et. al, 198239 and was dissolved in nuclease-free water for further analysis.
Southern blotting of genomic DNA.
10 μg of total DNA was digested using SalI and NheI restriction enzymes and samples were separated by electrophoresis on a 1% agarose gel. After treating the gel in 0.2 N HCl for 10 min, denaturation buffer (1.5 M NaCl, 0.5 M NaOH) for 30 min, and neutralization solution (0.5 M Tris-HCl, 3 M NaCl, pH 6.8) for 30 min, the DNA in the gel was blotted onto nylon membrane by capillary transfer in 20 x SSC buffer. The Southern blotting probe fragment was prepared by PCR amplification from the C. reinhardtii genomic DNA using primers: CMD1-Southern-F (5ʹ-GGCCAAACAACCGAGTCTTG-3ʹ) and CMD1-Southern-R (5ʹ-CACAGCAACAACACCACTCA-3ʹ). Probe labeling and the detection of hybridization signal were performed using the DIG High Prime Labeling and Detection Starter Kit II (Roche) according to the instruction manual.
Bisulfite sequencing (BS-seq) and TET bisulfite sequencing (TET BS-seq).
For bisulfite sequencing, genomic DNA was extracted and treated with the EZ DNA Methylation-Direct Kit (Zymo Research). The bisulfite-treated DNA was subjected to PCR amplification using Taq HS polymerase (TAKARA). The bisulfite primers were LHCSR3-BSF (5ʹ-TGGGTTGGTTGATATAGTTTGATA-3ʹ), and LHCSR3-BSR (5ʹ-AATCTCRCTAACTCCCCTATCT-3ʹ). HSRB-BSF (5ʹ-TGAAGTTATAGGATTGATTTGG-3ʹ), and HSRB-BSR (5ʹ-TACAAATACTCAAATACCCCAT-3ʹ). PCR products were then purified with a Gel Extraction Kit (Qiagen) and cloned into pClone007 Simple Vector (Tsingke). Individual clones were sequenced by standard Sanger sequencing. Data were analyzed by an online tool QUMA (http://quma.cdb.riken.jp/).
For TET BS-seq, the genomic DNA was subjected to oxidation by recombinant human TET2CD before bisulfite treatment. Briefly, 200 ng DNA was incubated with 10 μg of hTET2CD in a total volume of 20 μl at 37 °C for 3 h in the presence of 50 mM HEPES (pH 8.2), 50 mM NaCl, 1 mM L-ascorbic acid, 1 mM 2-OG, 0.1 mM Fe(NH4)2(SO4)2, 1 mM DTT and 1 mM ATP. After that, TET-treated DNA was directly used for BS-seq as described above.
Chlorophyll fluorescence measurements.
Chlorophyll fluorescence of C. reinhardtii cells was measured using a Dual-PAM-100 (Walz) with an emitter-detector unit ED-101US/MD. WT and cmd1 strains were cultured in the light intensity condition of 180 μmol photons·m−2·s−1. Cells were then exposed to actinic light of 600 μmol photons·m−2·s−1 to induce NPQ. Total NPQ was calculated as (Fm-Fm’)/Fm’, where Fm is the maximum fluorescence resulting from the measuring during a brief, saturating flash of light, and Fm’ is the maximum fluorescence measured in the light-adapted state. The photosynthetic electron transport rate was calculated as ETR = (Fm’-Fs)/Fm’ × photon flux density (μmol photons·m−2·s−1), where Fs is the steady-state fluorescence level.
Luciferase assay.
For the construction of luciferase reporter, the Hsp70A/Rbcs2 fusion promoter and PsaD terminator were fused with the renilla coding sequence. Independently, the promoter region of LHCSR3.1 (chromosome_8: 1945381–1947449) was cloned to generate another reporter plasmid. The plasmids were treated with M.SssI methyltransferase (Zymo Research) to generate 5mC-plasmids. 5mC-plasmids were further treated with CMD1 to generate 5gmC-plasmids. For luciferase assay, these plasmids were linearized and introduced into wild-type CC125 cells by electroporation with BTX Gemini SC2 Electroporator in a 4 mm cuvette (600 V, 50 μF, infinite resistance). The cells are harvested at different time and subjected to luciferase activity measurement with Renilla Luciferase Assay System (Promega). The luciferase activity was normalized to the corresponding chlorophyll fluorescence and then compared to the value of the mock control which is set to 1. Each experiment was repeated three times.
Chromatin immunoprecipitation assay (ChIP).
ChIP assay was performed according to Strenkert et al. 201140. An anti-HA mono-clonal antibody (Cell Signaling Technology) was used to pull down CMD1-HA, with a mouse IgG used as a negative control. The pull-down complex was eluted and subjected to quantitative RT-PCR. Signals for individual genomic regions from anti-HA pulldown samples were normalized against IgG control samples and then to the corresponding signals of cmd1 cells lacking CMD1-HA, which was set to 1. Primers used were as follows: F1: 5ʹ-TGTGTTTCCGACTTTGCCAG-3ʹ, R1: 5ʹ-GACACGACATCACACGACAG-3ʹ; F2: 5ʹ-CACTCCTCCCTCTCCTTGC-3ʹ, R2: 5ʹ-GAAGAAGAGGCGGTGGAGAG-3ʹ; F3: 5ʹ-GGTTGCAACACCCTAACGTT-3ʹ, R3: 5ʹ-CCCATGAAACCAAGCACCAA-3ʹ; F4: 5ʹ-CATACGGGGTCCCTACACTC-3ʹ, R4: 5ʹ-TGTCCAGTGAGAAGTAGCCG-3ʹ.
Statistical analysis.
No statistical methods were used to predetermine sample size, the experiments were not randomized and the investigators were not blinded to allocation during experiments and outcome assessment. All values were expressed as mean ± S.E. calculated from the average of at least two independent biological replicates. The statistical significance of differences was estimated by Student’s t-tests, using GraphPad software. P<0.05 was considered significant. All other statistical tests are clearly described in the figure legends and methods.
Whole-genome bisulfite sequencing.
Genomic DNA was isolated as described above. For library preparation, the genomic DNA spiked with unmethylated lambda DNA (~2% of the genomic DNA) was sheared by Covaris S220 for the generation of fragments (~300 bp in length). Then about 500 ng of sheared DNA was converted by bisulfite and purified with EZ DNA Methylation-Direct Kit (Zymo Research). DNA libraries were prepared using TruSeq DNA Methylation Kit (Illumina) and sequenced on Illunima NextSeq-500 platform with pair-end 150 bp mode. After quality control (FastQC Version 0.11.5) and adapter trimming (Trimmomatic41 V0.36), the clean reads were aligned to the C. reinhardtii genome (V5.5, Phytozome) using BSMAP version v2.942.
Raw methylation estimates were called for cytosines covered at least twenty reads. Commonly detected cytosine sites were averaged across replicates to increase robustness. To determine the methylation status of genes, methylation ratios of cytosines within the promoter region (2 kb upstream of TSS) were collected and compared between wild-type and CMD1 mutant samples with Wilcoxon signed-rank test and corrected for false discovery rate (FDR) with the Benjamini-Hochberg method43. Fold changes, absolute differences and percentage of relative differences were also calculated. To control false positives more stringently, we determine differentially methylated genes as those with FDR values below 0.001 combined with a 20% relative change and a 0.04 absolute methylation change in the methylation level. Functional enrichment was analyzed with Gene Ontology annotation and Fisher’s exact test.
RNA-Seq analysis.
Total RNA was extracted from C. reinhardtii using Trizol™ (Thermo). RNA libraries were prepared using TruSeq Stranded Total RNA Sample Prep Kit (Illumina) and sequenced using Illumina Hiseq Xten platform with pair-end 150 bp mode. After quality control (FastQC Version 0.11.5) and adapter trimming (Trimmomatic41 V0.36), the clean reads were aligned to the C. reinhardtii genome (V5.5, Phytozome) using TopHat2 (version v2.1.1)44 with default settings. The transcription levels of annotated genes (FPKM, fragments per kilobase of transcript per million mapped reads) were quantified and normalized using Cufflinks (v2.0.0)45 with default parameters. Differential analysis was performed using the quasi-likelihood F-test implemented in edgeR (v3.16.5)46 and genes with P value < 0.005 and at least 1.5-fold change were considered to be differentially expressed.
Extended Data
Extended Data Figure 1. Alignment of TET homologs in C. reinhardtii with Naegleria Tet1.

Eight TET-like proteins were found using the TET-JBP domain as query for BLAST search in the Phytozome database of C. reinhardtii. These proteins have a conserved HxD motif as observed in the TET proteins from mammals and Naegleria. The symbols above the sequence denote the functional residues in Naegleria’s NgTet1 determined by structural and biochemical analyses. ‘m’ stands for metal (iron) binding site; ‘C’ for 5mC interaction; ‘a’ for the active center; ‘α’ stands for the 2-OG binding site, which is not conserved in CrTET1 (CMD1). The gene names for the CrTET in the Phytozome database are as follows: CrTET1: Cre12.g553400, CrTET2: Cre16.g654100, CrTET3: Cre02.g081150, CrTET4: Cre02.g141466, CrTET5: Cre17.g734757, CrTET6: Cre15.g643388, CrTET7: Cre02.g142867, CrTET8: Cre15.g642800.
Extended Data Figure 2. Purification of recombinant CMD1 and determination of DNA substrate specificity.

a, Coomassie blue staining of the untagged full-length CMD1 protein purified from E. coli. An image for fractions collected from gel filtration chromatography column (eluted between 14–17 min, 1 ml/min) is shown. Representative image is shown from at least three independent experiments.
b, Coomassie blue staining of the purified wild-type or mutant CMD1 proteins. H345 and D347 correspond to the conserved residues of the iron-binding sites based on the sequence alignment of TET homologs; A330 is predicted to be in the active site required for CMD1 enzymatic activity; D350 might be involved in 5mC interaction. Representative image is shown from two independent experiments. For source data in panels a-b, see supplementary Figure 1.
c, CMD1 mutants had no or significantly reduced activity to convert 5mC into P1 and P2. Data shown are representative of two independent experiments.
d, P1 and P2 nucleosides accumulate over a period of 2 h upon incubation of the 5mC-DNA substrate with CMD1 shown by HPLC analysis of nucleosides in DNA samples collected at the indicated time points. Data shown are representative of two independent experiments.
e, Time-course of the relative amounts of 5mC, P1 and P2 during incubation of 5mC-DNA with CMD1. The amount was determined based on the peak area of each nucleoside in HPLC analysis in panel d. Data shown are representative of two independent experiments.
f, 5mC-, but not C- or 5hmC-containing DNA, serves as a substrate for CMD1. DNA substrates containing C, 5hmC or 5mC were prepared by PCR, incubated with CMD1, and then subjected to nucleoside composition analysis using HPLC. Note that P1 and P2 nucleosides only appear in 5mC-DNA upon incubation with WT CMD1. Mut CMD1 is an inactive mutant carrying point mutations (H345Y/D347A). Data shown are representative of two independent experiments.
Extended Data Figure 3. Deuterium tracing of the methyl group in 5mC-DNA.

a-b, Tandem mass spectrometry analysis of the HPLC fractions corresponding to the minor side products generated in the CMD1 reaction and comparison with authentic 5hmC (a) and 5caC (b) standards (refer to Fig. 1a. Also see the reaction mechanism we proposed in Extended Data Fig. 7c for further discussion on the origin of 5hmC and 5caC). Data shown are representative of two independent experiments.
c, MS detection of 5mC nucleoside in a DNA substrate methylated in vitro with M.SssI using D3-labeled S-adenosyl-L-methionine ([methyl-D3]-SAM). The mass of 5mC increases by 3 units when [methyl-D3]-SAM was used. Data shown are representative of two independent experiments.
d, Identification of P1/P2 bases based on the masses of molecules and fragmentation products from tandem mass spectrometry. P1 and P2 produce identical collision-induced-dissociation (CID) fragments, suggesting that they are stereoisomers. Shown are the most abundant fragments generated by CID of P1/P2. Molecular formulae were deduced from the molecular masses. Since all the fragment ions of P1/P2 generating from the D3-labeled 5mC are 2 Daltons larger than those from unlabeled 5mC, the new modification most likely occurs at the methyl group; the bridging methylene linked to the pyrimidine ring seems unaltered in CID. P1/P2 appeared to lose three H2O (MW 18.0100) in CID consecutively, indicating the presence of three hydroxyl groups in the P1 and P2 structures. Data shown are representative of two independent experiments.
Extended Data Figure 4. NMR signal assignments support P1 identity as 5-(1-[2,3,4-trihydroxybutyl])-2’-deoxycytidine.

a, 1H NMR spectrum of P1 with signal assignments. The spectrum shows all the non-exchangeable proton signals with their chemical shifts J-coupling constants for P1 (Extended Data Table 1).
b, 1H-1H 2D COSY spectrum for P1 with assignments. The sequential positions of protons showed in two spin-coupling systems as δH 6.299–2.320/3.437–4.455–4.062–3.773/3.860 in a deoxyribosyl moiety and δH 3.813/3.664–3.615–3.811–2.793/2.505.
c, 1H-1H 2D TOCSY spectrum for P1 with assignments. Three coupling systems were observed in this TOCSY spectrum. The first coupling system showed a typical signal pattern for a deoxyriboside moiety here with seven protons at δH 6.299 (1H, t, H1’), 4.455 (1H, m, H3’), 4.062 (1H, m, H4’), 3.860 (1H, dd, H5’b), 3.773 (1H, dd, H5’a), 2.437 (1H, ddd, H2’b) and 2.320 (1H, dt, H2’a). The second one was observed for six protons at δH 3.813 (1H, H10b), 3.811 (1H, ddd, H8), 3.664 (1H, dd, H10a), 3.615 (1H, ddd, H9), 2.793 (1H, ddd, H7b) and 2.505 (1H, ddd, H7a) and 2.320 (1H, dt, H2’a). A third coupling system was observed as a weak correlation between δH 7.759 (1H, t, H6) and a CH2 moiety (H7a and H7b, δH 2.793, 2.505).
d, 1H-1H JRES spectrum for P1. It shows J-coupling patterns from all protons (Extended Data Table 1). The F1 dimension gives coupling constants (Hz) while the F2 dimension gives chemical shift information.
e, 1H-13C 2D HSQC spectrum for P1 with assignments. The direct H-C linkages were detected by the one-bond 1H-13C correlations in this HSQC spectrum.
f, 1H-13C 2D HMBC spectrum for P1 with assignments. The long-rang 1H-13C correlations were detected in the HMBC spectrum. The proton at δH 7.759 showed long-range correlations with C2, C4, C5 (δC 159.98, 168.53, 107.64, respectively) of a cytosine residue, with C7 of the trihydroxybutyl moiety (THB) (δC 33.64), and with the deoxyribosyl C1’ (δC 88.95). This indicated that C7 (CH2) of the THB moiety was attached to C6 of a cytosine ring. Such is further confirmed with long-range correlations between H7 (δH 2.793, 2.505) and C4, C5, C6, C8, C9 (δC 168.53, 107.64, 143.83, 72.56, 76.94). The long correlations between H1’ (δH 6.299) and C2, C6 (δC 168.53, 143.83) in HMBC spectrum further confirmed the N1-C1’ linkage between the deoxyribosyl and cytosine moieties. Taking all above into consideration, P1 was finally determined as 5-(1-[2,3,4-trihydroxybutyl])-2’-deoxycytidine shown in Fig. 2c with its 1H and 13C signals unambiguously assigned and tabulated in Extended Data Table 1. In panels a-f, representative results are shown from two independent experiments.
Extended Data Figure 5. P2 is determined as a stereoisomer of P1.

a, 1H NMR spectrum for P2 with signal assignments.
b, 1H-1H COSY spectrum for P2 with assignments.
c, 1H-1H TOCSY spectrum for P2 with assignments.
d, 1H-1H JRES spectrum for P2.
e, 1H-13C HSQC spectrum for P2 with assignments.
f, 1H-13C HMBC spectrum for P2 with assignments. In the same manner, the structure of P2 (Fig. 2c) was determined as 5-(1-[2, 3, 4-trihydroxybutyl])-2’-deoxycytidine using 1H NMR spectrum and a series of 2D NMR spectra indicating P2 as a stereoisomer of P1. Unlike P1, there were stronger coupling relationships among H8, H9, H10a and H10b and this showed more complicated splitting of peaks in P2. Therefore, accurate chemical shifts and coupling constants were simulated with NMR-Sim5.4 in order to achieve the maximum similarity with experimental data (Extended Data Table 1). In panels a-f, representative results are shown from two independent experiments.
Extended Data Figure 6. Comparison of co-factor requirements of CMD1 and hTET2.
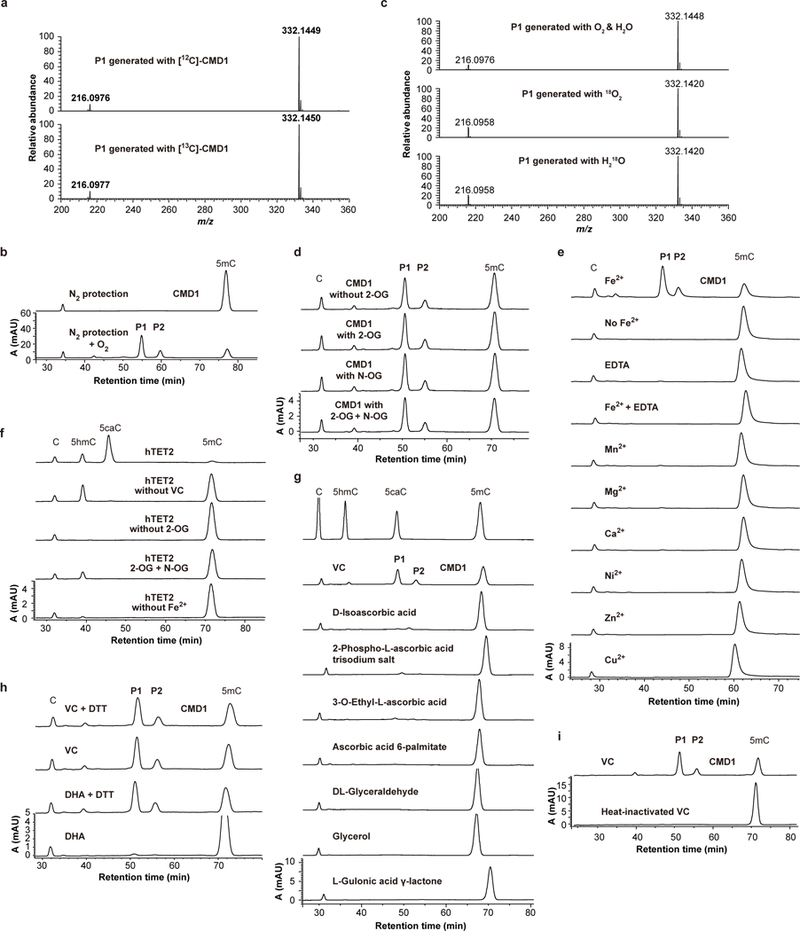
a, The 90-Dalton modification on 5mC does not originate from CMD1 or co-purified small compounds. The CMD1 protein was purified from E. coli grown in M9 medium with 12C or 13C-labeled glucose as the only carbon source. The lack of mass increase in P1 generated with the 13C-CMD1 preparation suggests that the P1 modification is derived from a reaction component rather than a compound co-purified with the CMD1 enzyme. Data shown are representative of two independent experiments.
b, O2 is indispensable for CMD1 activity. P1 and P2 were not detectable unless O2 was bubbled into the reaction mixture that was incubated under an N2 atmosphere in a glove box. Data shown are representative of two independent experiments.
c, Mass analysis of P1 nucleoside from reactions using 18O-labeled oxygen or water. The mass of P1 nucleoside remained unaltered compared to that of P1 obtained from the reaction using unlabeled oxygen or water. Data shown are representative of two independent experiments.
d, 2-OG is not required for CMD1. Reactions were performed under indicated conditions and HPLC was used to analyze the nucleosides of DNA products. N-oxalylglycine (N-OG), an analog of 2-OG, does not inhibit the activity of CMD1. Data shown are representative of two independent experiments.
e, Fe2+ is indispensable for CMD1 activity. Reactions were performed in the presence of indicated metal ions or EDTA. Data shown are representative of two independent experiments.
f, 2-OG and Fe2+, but not VC, are required for the activity of hTET2. Reactions were performed under indicated conditions. N-OG inhibits the activity of hTET2. Data shown are representative of two independent experiments.
g, Analogs of VC do not support CMD1 activity. Data shown are representative of at least three independent experiments.
h, Dehydroascorbic acid (DHA), an oxidized form of VC, supports the CMD1 activity only upon its reduction into VC by DTT. The conversion of DHA into VC by DTT treatment was confirmed by MS analysis (not shown). Data shown are representative of at least three independent experiments.
i, Heat-inactivated VC (100ºC overnight) does not support the CMD1 activity. Data shown are representative of two independent experiments.
Extended Data Figure 7. Characterization of reaction mechanism of CMD1.

a, Mass analysis of P1 nucleoside from reactions using various 13C-labeled VC co-substrates. The use of [13C6]-VC led to a 3-Dalton increase of P1 mass, while no mass change was detected when [1-13C]-VC or [3-13C]-VC was used. This indicated that the glyceryl moiety was from C4-C6 of VC. Data shown are representative of two independent experiments.
b, Mass determination of the most abundant fragment ions generated by CID of P1. Arch arrows denote the relationship of ions featuring the loss of 13C carbons (upper three panels) and loss of 12C carbons (bottom panel). The mass corresponding to the fragments containing 13C atoms are indicated in red. These data indicate that [6-13C] of VC ends up in the distal carbon of the side chain of P1 (C10 in Fig. 2c), and 13C from [5-13C]-VC ends up in C9. Data shown are representative of two independent experiments.
c, Proposed mechanism of CMD1 catalysis. The catalysis starts with the coordination of Fe(II) to the conserved 2-His-1-carboxylate triad of the enzyme, leaving three sites on the metal that are occupied by water molecules (A). Deprotonated VC displaces two bound water molecules and coordinates to Fe(II) with its C-1 carbonyl group and C-2 alkoxide (B). Hydrolysis of the bound VC yields the ring opened intermediate (C), which then tautomerizes to the α-keto form (D). The remaining bound water molecule leaves when 5mC binds to the active site (E). The binding of O2 to the iron center generates an Fe(III)-superoxo intermediate (F). The nucleophilic attack of the distal oxygen onto C-2 of 2-keto-L-gulonate yields a Fe(IV)-peroxo species (G). This species initiates an oxidative decarboxylation of VC to produce a Fe(IV)-oxo species, which is coordinated with the C-1 carboxylate of the resulting L-xylonic acid (H). The Fe(IV)-oxo species abstracts a hydrogen atom from 5mC to generate Fe(III)-hydroxide species and a 5mC radical (I). The C-2 hydroxyl group of the coordinated L-xylonic acid binds to the Fe(III) center with a loss of a bound water molecule (J). Homolysis of the C2-C3 bond of the coordinated L-xylonic acid and non-stereoselective attack of the 5mC radical lead to the formation of the product nucleobases P1 and P2 and Fe(II) bound glyoxylic acid (K). Eventually, glyoxylate dissociates from the iron center to complete the catalytic cycle. The side reaction generating 5hmC can be explained based on this reaction mechanism. Namely, the 5mC radical combines with a hydroxide group linked to Fe(III) (intermediate I), in a manner similar to reactions catalyzed by TET dioxygenases. Notably, however, the generation of trace amount of 5hmC is not dependent on 2-OG (see Fig 3a, and Extended Data Fig 6d), confirming that a different mechanism is at play.
d, GC-MS analysis of the co-product CO2 from CMD1-catalyzed reactions using 13C-labeled VC. The reactions were carried out in airtight vials and directly subjected to GC-MS analysis. The carbon atom of CO2 is shown to come from the C1 of VC. Data shown are representative of two independent experiments.
e, Mass spectrometry analysis of the co-product glyoxylic acid upon DNP derivatization. As the C4-C6 and C-1 of VC were transferred into base P and CO2 respectively, the remaining two carbons of VC were converted into glyoxylic acid. This is in close agreement with the mass increases of the glyoxylic acid derivatives when using uniformly-labeled (13C6) and singly (3-13C) labeled VC. The arrow indicates the peak of the DNP conjugate in the LC profiles. Data shown are representative of two independent experiments.
Extended Data Figure 8. Generation of a cmd1 strain using a CRISPR/Cas9-based co-selection strategy and co-segregation of the high light-sensitive phenotype with the CMD1 mutation.

a, The conversion of indole to tryptophan is catalyzed by the tryptophan (Trp) synthase β subunit encoded by the endogenous MAA7 gene in C. reinhardtii. When 5-fluoroindole (5-FI) is used in place of indole, it will be converted into 5-fluorotryptophan, which is lethally toxic to cells.
b, The CRISPR/Cas9-mediated co-selection strategy to introduce mutation in C. reinhardtii. Recombinant Cas9 protein purified from E. coli was assembled with single guide RNA (sgRNA) for both the MAA7 gene and a target gene of interest to form RNP complexes. Upon electroporation of the mixture of the two RNP complexes into cells, 5-FI resistant colonies were selected and genotyped to identify clones with a desired mutation in the targeted gene. The mutant strains were then backcrossed with the wild-type strain to segregate the target gene mutation from the MAA7 mutation or other off-target mutations if any.
c, The genomic loci of CMD1 (also known as CrTET1) and its close paralog CrTET2. At the CMD1 locus of cmd1 cells, there is an insertion of 245 bp in the exon 3, thus generating a frame-shift mutation. Chromosome locations of the two paralogs are indicated on the top. DNA sequences from the targeted loci in wild-type and cmd1 strains are shown on the bottom. The 3-nt PAM and 20-nt sgRNA-binding sequences are distinctively colored.
d, Genomic PCR genotyping of the cmd1 strain using two primer pairs as shown in panel c. Sizes expected for the PCR products are indicated. Note that the forward primer of primer pair 1 (panel c) can binds to both the CMD1 and CrTET2 genomic loci. The forward primer of primer pair 2 is specific for a site upstream of CMD1. Representative image is shown from at least three independent experiments.
e, Southern blot analysis of the CMD1 genomic locus. The locations of the probe (dark blue bar) and the SalI and NheI restriction sites used for the digestion of the genomic DNA are indicated in panel c. Two bands detected in the lane of the cmd1 DNA sample arose from the mutant CMD1 locus with a 245-bp insert and the unaltered CrTET2 paralogous locus of almost identical sequence, respectively. Expected lengths of the detected restriction fragments are given in the brackets. Representative image is shown from two independent experiments.
f, RT-PCR analysis of the region spanning the targeted site of exon 3. The expected lengths of PCR products from the wild-type and cmd1 cells are given in the brackets. Representative image is shown from two independent experiments.
g, Co-segregation analysis of the CMD1 mutation in the progeny of a cross between wild-type CC124 with the cmd1 strain. Equal amounts of the cells were dripped on agar plates and exposed to low light (20 μmol photons·m−2·s−1) or high light (1000 μmol photons·m−2·s−1) for 66 h. A1 and A2 are the cmd1 and wild-type CC124 cells respectively. Red circles mark the clones of the parental cmd1 strain and the progeny lines, of which the growth was inhibited under high light. 48 progeny clones were tested and 14 of them were shown here representatively. Shown at the right is the result of algal colony PCR for genotyping of the progeny clones. Primer pair 2 shown in panel c was used. For source data in panels d-g, see Supplementary Figure 1.
Extended Data Figure 9. Role of vitamin C in the regulation of LHCSR3 expression and NPQ.

a, Generation of vtc2 mutant strains. Shown are the genomic structure of the VTC2 gene and the sequences flanking the Cas9 cleavage site (downward arrows) in wild-type (WT) and mutant strains. An 83-nt donor oligonucleotide carrying a frame-shift mutation (insertion of an A) was co-electroporated into algal cells for homology directed repair (HDR) with VTC2 in CRISPR/Cas9-based co-selection procedure (Extended Data Fig. 8b). Out of 48 5-FI resistant MAA7 mutant clones obtained, 7 clones were identified to be vtc2 mutants by sequencing. Among them, 2 clones (#1–2) carried the desired insertion of an A, apparently derived from HDR-mediated editing and the other 5 clones (#3–7) carried indels, arising from non-homologous end joining. In the wild-type gene sequence, the 20-nt sgRNA-binding and 3-nt PAM sequences are distinctively colored.
b, Cellular VC content in WT, vtc2 and cmd1 mutant strains determined by LC-MS. The cells were cultured in TAP medium under continuous illumination of 50 μmol photons·m−2·s−1. Data presented are mean ± S.E. of two independent biological replicates with individual data shown as dots.
c, Methylation analysis of the genomic locus 5’ of the LHCSR3.1 gene in wild-type and vtc2 strains after exposure to high light (300 μmol photons·m−2·s−1). The open and black circles represent unmethylated and methylated CpG sites respectively. Representative results are shown from two independent experiments.
d, Determination of the mRNA expression of LHCSR3.1 and LHCSR3.2 in WT and vtc2 strains after exposure to high light (300 μmol photons·m−2·s−1). The expression levels of LHCSR3.1 and LHCSR3.2 were first normalized to the expression of a house keeping gene GBLP, and the resulted values were then compared to those of WT samples, which were set to 1.0. Data presented are mean ± S.E. of two independent biological replicates with individual data shown as dots.
e, NPQ induction kinetics of WT and mutant strains. Cells were grown under the light intensity of 180 μmol photons·m−2·s−1 for 24 h. NPQ was then recorded upon illumination with 600 μmol photons·m−2·s−1 for 5 min (white bar) followed by 2.5 min in darkness (black bar). Data are represented as mean ± S.E. by five independent biological replicates.
f, VTC2 mRNA expression in WT and cmd1 strains after exposure to high light (300 μmol photons·m−2·s−1). Real-time RT-PCR analysis was used for quantification. The expression levels of VTC2 were first normalized to the expression of a house keeping gene GBLP, and then the resulted values were compared to that of WT sample, which was set to 1.0. Data presented are mean ± S.E. of four independent biological replicates with individual data shown as dots.
Extended Data Figure 10. Functional analyses of the VC-derived modification in C. reinhardtii.

a, Quantification of 5gmC and 5mC nucleosides in genomic DNA from wild-type CC125 strain treated with 400 μM 5-aza-2′-deoxycytidine (5-aza). Data are represented as mean ± S.E. from three independent biological replicates which are shown as dots. Two-tailed Student’s t-test was used without adjustment for multiple comparisons.
b, Determination of ETR of WT and cmd1 cells with Dual-PAM-100. Cells were prepared as in the experiment of NPQ induction presented in Fig. 4c. Data are represented as mean ± S.E. from three independent biological replicates.
c, Expression levels of photosynthesis-related genes in cmd1 cells determined by RNA-seq analysis. Cells were grown under high light (300 μmol photons·m−2·s−1). Expression levels are relative to wild-type (WT) which is set as 1.0.
d, Volcano plot showing the differentially expressed genes (DEGs) of cmd1 cells versus WT cells. n=3. The analysis was based on edgeR’s quasi-likelihood F-test which is a two-sided test without adjustment for multiple comparisons.
e, Gene ontology analysis of DEGs in cmd1 cells. n=3. Functional enrichment was based on one-sided Fisher’s exact test and the top significant GO terms were selected without adjustment for multiple comparisons.
f, Nucleotide contexts enriched in differential methylated cytosines in cmd1 cells compared to the WT.
g, Genomic feature distribution of differentially methylated regions (DMRs) in cmd1 mutant cells compared to the wild-type. DMRs were filtered by the length (at least 400 bp) and the methylation ratio difference between WT and cmd1 cells (at least 20% methylation changes). The DMRs were annotated and analyzed for feature distribution.
h, DNA methylation frequency distribution in wild-type and cmd1 mutant cells. The cytosines were categorized in ten intervals based on their methylation levels and their numbers in each interval were counted.
i, 5mC abundance at genes of low and high expression in wild-type cells. 5mC exhibits a slightly higher abundance in the lower expressed genes. All genes were divided into the low 50% and high 50% expression categories. Methylation at −2 to 0 kb upstream of TSS was analyzed. n=2. The two-sided Wilcoxon signed-rank test was used without adjustment for multiple comparisons.
j, Comparison of the expression of hypermethylated and hypomethylated genes in cmd1 cells comparing to WT cells. Hypermethylated genes show a reduced expression level. Methylation at −2 to 0 kb upstream of TSS was analyzed. n=2. Two group of genes were chosen by controlling false discovery rate to be 0.001 after adjustment for multiple comparisons. The two-sided Wilcoxon signed-rank test was used. In box plots in panel i and j, the outer edges of the box represents the first and third quartiles, and the midline indicates the median. The top or bottom line indicates the maximum or minimum value within the 1.5-fold of the interquartile range.
k, Gene ontology of differentially methylated genes at the promoter region in cmd1 cells. n=2. Two-sided Fisher’s exact test was used without adjustments for multiple comparisons.
l, Methylation pattern at the genomic locus of LHCSR3.1 in WT and cmd1 mutant cells. Vertical bars indicate the methylation level at individual CpG dyads. The grey-shaded area indicates the region analyzed in Fig. 4f. Representative image is shown from two independent experiments.
Extended Data Figure 11. CMD1 regulates LHCSR3 expression by promoting DNA demethylation through 5gmC generation.

a, Schematics of the CMD1 and LHCSR3 transgene expression constructs used in complementation of the cmd1 strain. The paromomycin resistance marker (AphVIII) was used for selection of transgenic clones. The HSP70A/RBCS2 fusion promoter (HSRB) drives transgene expression. HA epitope added to the C-terminus of CMD1 allows for detection of the fusion protein.
b, Western blot analysis for the CMD1-HA protein expressed in WT, cmd1 and cmd1 strains complemented with wild-type CMD1-HA (WT-1 and −2) or mutant CMD1-HA (HD-1 and −2) as indicated on the top. Anti-HA antibody was used for the detection. Detection with anti-α-tubulin provided a sample processing control. WT and cmd1 lines without the CMD1-HA transgene served as negative controls. Representative results are shown from two independent experiments.
c, Western analysis of the LHCSR3 protein in WT, cmd1 and cmd1 lines complemented with CMD1-HA or with LHCSR3 as indicated on the top. Detection with anti-α-tubulin provided a sample processing control. Representative results are shown from two independent experiments. For source data in panels b-c, see Supplementary Figure 1.
d, Erlenmeyer flasks containing different cells as indicated growing photoautotrophically after 16 h of exposure to high light (750 μmol photons·m−2·s−1). Shown are representative photographs from three independent experiments.
e. Determination of the effect of 5mC and 5gmC on transcription in C. reinhardtii using a luciferase reporter assay. The luciferase reporter driven by the promoter (either HSRB or LHCSR3) containing unmodified cytosine, 5mC or 5gmC respectively which were prepared by M.SssI treatment or further treated by CMD1 were transformed into C. reinhardtii. The cells were harvested at different time points for measuring the luciferase activity. The mock sample was transformed with an empty vector. The luciferase activity was normalized to the corresponding chlorophyll fluorescence and then compared to the value of the mock control which is set to 1. Data are represented as mean ± S.E. by two independent biological replicates which are shown as dots.
f. Schematic diagram of TET-bisulfite (BS) sequencing analysis. In the conventional bisulfite sequencing, C, 5fC and 5caC but not 5mC or 5hmC are converted into U by bisulfite treatment, which is read as T in PCR and sequencing. However, 5gmC is read as C, which is thus indistinguishable from 5mC or 5hmC. By TET treatment, both 5mC and 5hmC are oxidized into 5caC, which is then read as T in subsequent bisulfite sequencing. Therefore, only 5gmC (orange lollipop) in the starting DNA sample is read as C (blank lollipop lower right) in TET-BS sequencing.
g, Establishment of TET-BS assay to distinguish 5gmC from all other forms. A lambda DNA fragment was used to test the feasibility of the assay. After methylation with M.SssI enzyme, all CpG sites are resistant to deamination and thus read as C in BS-seq. 5gmCs that only exist in the CMD1-treated 5mC-λDNA are detected as C because they are non-convertible in TET-BS treatment. Each circle represents a CpG site. Representative results are shown from two independent experiments.
h, BS-seq and TET-BS-seq analysis of the HSRB promoter used in the luciferase assay. Upon nuclear transformation of the cytosine-modified DNA, a significant portion of 5gmC underwent a conversion to C (reduced from 84.2% to 70.8%) while the high 5mC level remained. Notably, individual 5gmCs at neighboring Cs on a same DNA template appear to behave differently. While the mechanism of conversion is not clear, 5gmC might be lost slowly over time through DNA repair or an alternative demethylation process. Representative results are shown from two independent experiments.
i, ChIP analysis of the interaction of CMD1-HA with the 5’ genomic region of LHCSR3.1. The different regions of DNA fragments precipitated with anti-HA antibodies were amplified by qPCR. The region amplified by primer pair 3 (chromosome_8: 1947066–1947226) exhibits strongest interaction with CMD1-HA. The enrichment relative to IgG were normalized to that of cmd1 cells which was set as 1. Data are represented as mean ± S.E. by two independent biological replicates which are shown as dots.
Extended Data Table 1. The NMR assignment of the compound P1/P2 and the comparison of experimental and calculated 3JH -H coupling constants (Hz).
Upper part: 1H and 13C signal assignment of the compound P1/P2; dd: doublet of doublets; ddd: doublet of doublets of doublets; dt: doublet of triplets; m: multiplet; t: triplets. * showed the simulated data with NMR-Sim 5.4.
Lower part: The experimental and calculated 3JH -H coupling constants (Hz) for four possible stereoisomers of P1 and P2 having different C8 and C9 configurations. In order to further determine the absolute configuration of these two chiral centers (C8 and C9) in the THB residue in P1 and P2, the J-coupling constants of all four stereoisomers (i.e. 8R,9R; 8S,9S; 8R,9S; 8S,9R) were calculated with the density functional theory (DFT) calculations using the GIAO method. This is because J-coupling constants are dependent on the dihedral angles of the planes in which protons locate. By comparing the calculated J-coupling values with experimental data, the absolute configurations were determined as (8S, 9S) and (8R, 9S) for P1 and P2 as the only reasonable possibility, respectively.
| Summary of the NMR assignment of the compound P1/P2 | ||||||
|---|---|---|---|---|---|---|
| Atom NO |
P1 | P2 | ||||
| 1H(ppm, multi, J) | 13C(ppm) | HMBC | 1H(ppm, multi, J) | 13C(ppm) | HMBC | |
| 2 | - | 159.98 | - | 159.97 | ||
| 4 | - | 168.53 | - | 168.31 | ||
| 5 | - | 107.64 | - | 107.38 | ||
| 6 | 7.759 (t, 1.5) | 143.83 | C2, C4, C5, C7, C1’ | 7.768 (t, 1.6) | 143.64 | C2, C4, C5, C7, C1’ |
| 7a | 2.505 (ddd, 15.5, 9.0, 15) | 33.64 | C4, C5, C6, C8, C9 | 2.588 (ddd, 15.2, 9.4, 16) | 33.97 | C4, C5, C6, C8 |
| 7b | 2.793 (ddd, 15.5, 3.0, 15) | 33.64 | C4, C5, C6 | 2.654 (ddd, 15.2, 4.1, 16) | 33.97 | C5, C6 |
| 8 | 3.811 (ddd, 9.0, 6.8, 3.0) | 72.56 | C5, C9 | 3.851 (ddd, 9.4, 4.1, 3.4) | 72.13 | |
| 9 | 3.615 (ddd, 6.7, 6.7, 3.3) | 76.94 | C10 | 3.668(7.0, 4.0, 3.4)* | 76.35 | |
| 10a | 3.664 (dd, 11.8, 6.6) | 65.69 | C8, C9 | 3.681 (10.9, 7.0)* | 65.83 | C9 |
| 10b | 3.813 (dd, 11.8, 3.3) | 65.69 | C8 | 3.723 (10.9, 4.0)* | 65.83 | C9 |
| 1’ | 6.299 (t, 6.6) | 88.95 | C2, C6 | 6.288 (t, 6.6) | 89.02 | C6 |
| 2’a | 2.320 (dt, 14.1, 6.6) | 42.35 | C1’, C3’ | 2.319 (dt, 14.1, 6.6) | 42.36 | C1’, C3’ |
| 2’b | 2.437 (ddd, 14.1, 6.5, 4.2) | 42.35 | C1’, C3’ | 2.440 (ddd, 14.1, 6.5, 4.2) | 42.36 | C3’ |
| 3’ | 4.455 (m) | 73.41 | C1’, C5’ | 4.457 (m) | 73.36 | |
| 4’ | 4.062 (m) | 89.60 | C3’ | 4.064 (m) | 89.66 | |
| 5’a | 3.773 (dd, 12.5, 5.1) | 64.15 | C3’, C4’ | 3.776 (dd, 12.5, 5.1) | 64.13 | C3’ |
| 5’b | 3.860 (dd, 12.5, 3.5) | 64.15 | C3’ | 3.859 (dd, 12.5, 3.5) | 64.13 | |
| The experimental and calculated 3JH -H coupling constants | ||||||
| 3J8–7a | 3J8–7b | 3J8–9 | 3J9–10a | 3J9–10b | ||
| Calculated | 8R, 9R | 1.2 | 9.0 | 6.6 | 3.1 | 9.0 |
| 8S, 9S | 3.1 | 9.4 | 7.1 | 2.5 | 8.3 | |
| 8R, 9S | 1.7 | 9.5 | 2.7 | 2.2 | 8.0 | |
| 8S, 9R | 2.3 | 8.0 | 2.3 | 0.8 | 8.7 | |
| Experimental | P1 | 3.0 | 9.0 | 6.8 | 3.3 | 6.6 |
| P2 | 4.1 | 9.4 | 3.4 | 4.0 | 7.0 | |
Supplementary Material
Acknowledgments:
We thank Y. Xu for pPEI-His-Sumo vector; We also thank Y. Shan, D. Qiu, J. Kang, B. Han and L. Xu for assistance in mass spectrometry analysis; N. Xu for assistance in C. reinhardtii culturing and gametogenesis experiment; W. Yang for npq4 strain; J. Minagawa, G. Peers, S. Toth, M. Levine, C. Fulton, Y. Wang, W. Yang, and C. Yi for discussions. This work is supported by the National Key R&D Program of China [2017YFA0102700 to G.X.; 2017YFC0906800 to H.T.], the National Science Foundation of China [31830018 and 31430049 to G.X.; 81590953 21575151, and 21575151 to H.T.; 91851201 to K.H], Shanghai Municipal Science and Technology Project [2017SHZDZX01, 16JC1400500 to H.T.], Chinese Academy of Sciences [XDB19010102 to G.X.], Heye Health Technology Inc., NIH grant R01-GM118501. Z.-J. Z. is also supported by Thousand Youth Talents Program and Agilent Technologies Thought Leader Award.
Footnotes
Data availability statement
All the sequencing data reported in this paper are summarized in Supplementary Table 2 and deposited in the Gene Expression Omnibus database under accession code GSE122719. Source data for Fig. 1b, 4d and Extended Data Fig. 11b, 11c, 8d, 8e, 8f, 8g are presented in Supplementary Fig. 1. All other data are available from the corresponding author on request.
Author Information: Reprints and permissions information is available at www.nature.com/reprints. The authors declare no competing financial interests. Correspondence and requests for materials should be addressed to G.X. (glxu@sibcb.ac.cn) or H.T. (Huiru_Tang@fudan.edu.cn), K.H. (huangky@ihb.ac.cn).
Supplementary Information is linked to the online version of the paper at www.nature.com/nature.
References
- 1.Pastor WA, Aravind L & Rao A TETonic shift: biological roles of TET proteins in DNA demethylation and transcription. Nat Rev Mol Cell Biol 14, 341–356, (2013). [DOI] [PMC free article] [PubMed] [Google Scholar]
- 2.Bochtler M, Kolano A & Xu GL DNA demethylation pathways: Additional players and regulators. Bioessays 39, 1–13, (2017). [DOI] [PubMed] [Google Scholar]
- 3.Martinez S & Hausinger RP Catalytic Mechanisms of Fe(II)- and 2-Oxoglutarate-dependent Oxygenases. J Biol Chem 290, 20702–20711, (2015). [DOI] [PMC free article] [PubMed] [Google Scholar]
- 4.Walport LJ, Hopkinson RJ & Schofield CJ Mechanisms of human histone and nucleic acid demethylases. Curr Opin Chem Biol 16, 525–534, (2012). [DOI] [PubMed] [Google Scholar]
- 5.Morales-Ruiz T et al. DEMETER and REPRESSOR OF SILENCING 1 encode 5-methylcytosine DNA glycosylases. Proceedings of the National Academy of Sciences of the United States of America 103, 6853–6858, (2006). [DOI] [PMC free article] [PubMed] [Google Scholar]
- 6.He YF et al. Tet-mediated formation of 5-carboxylcytosine and its excision by TDG in mammalian DNA. Science 333, 1303–1307, (2011). [DOI] [PMC free article] [PubMed] [Google Scholar]
- 7.Tahiliani M et al. Conversion of 5-methylcytosine to 5-hydroxymethylcytosine in mammalian DNA by MLL partner TET1. Science 324, 930–935, (2009). [DOI] [PMC free article] [PubMed] [Google Scholar]
- 8.Ito S et al. Tet Proteins Can Convert 5-Methylcytosine to 5-Formylcytosine and 5-Carboxylcytosine. Science 333, 1300–1303, (2011). [DOI] [PMC free article] [PubMed] [Google Scholar]
- 9.Kriaucionis S & Heintz N The Nuclear DNA Base 5-Hydroxymethylcytosine Is Present in Purkinje Neurons and the Brain. Science 324, 929–930, (2009). [DOI] [PMC free article] [PubMed] [Google Scholar]
- 10.Wu X & Zhang Y TET-mediated active DNA demethylation: mechanism, function and beyond. Nature reviews. Genetics 18, 517–534, (2017). [DOI] [PubMed] [Google Scholar]
- 11.Zhang H & Zhu JK Active DNA demethylation in plants and animals. Cold Spring Harb Symp Quant Biol 77, 161–173, (2012). [DOI] [PMC free article] [PubMed] [Google Scholar]
- 12.Hashimoto H et al. Structure of a Naegleria Tet-like dioxygenase in complex with 5-methylcytosine DNA. Nature 506, 391–395, (2014). [DOI] [PMC free article] [PubMed] [Google Scholar]
- 13.Zhang L et al. A TET homologue protein from Coprinopsis cinerea (CcTET) that biochemically converts 5-methylcytosine to 5-hydroxymethylcytosine, 5-formylcytosine, and 5-carboxylcytosine. J Am Chem Soc 136, 4801–4804, (2014). [DOI] [PMC free article] [PubMed] [Google Scholar]
- 14.Chavez L et al. Simultaneous sequencing of oxidized methylcytosines produced by TET/JBP dioxygenases in Coprinopsis cinerea. Proceedings of the National Academy of Sciences of the United States of America 111, E5149–5158, (2014). [DOI] [PMC free article] [PubMed] [Google Scholar]
- 15.Carell T et al. Structure and function of noncanonical nucleobases. Angewandte Chemie 51, 7110–7131, (2012). [DOI] [PubMed] [Google Scholar]
- 16.Iyer LM, Tahiliani M, Rao A & Aravind L Prediction of novel families of enzymes involved in oxidative and other complex modifications of bases in nucleic acids. Cell Cycle 8, 1698–1710, (2009). [DOI] [PMC free article] [PubMed] [Google Scholar]
- 17.Merchant SS et al. The Chlamydomonas genome reveals the evolution of key animal and plant functions. Science 318, 245–250, (2007). [DOI] [PMC free article] [PubMed] [Google Scholar]
- 18.Hu L et al. Crystal structure of TET2-DNA complex: insight into TET-mediated 5mC oxidation. Cell 155, 1545–1555, (2013). [DOI] [PubMed] [Google Scholar]
- 19.Hausinger RP FeII/alpha-ketoglutarate-dependent hydroxylases and related enzymes. Critical reviews in biochemistry and molecular biology 39, 21–68, (2004). [DOI] [PubMed] [Google Scholar]
- 20.Karplus M Vicinal Proton Coupling in Nuclear Magnetic Resonance. Journal of the American Chemical Society 85, 2870–2871, (1963). [Google Scholar]
- 21.Urzica EI et al. Impact of Oxidative Stress on Ascorbate Biosynthesis in Chlamydomonas via Regulation of the VTC2 Gene Encoding a GDP-L-galactose Phosphorylase. Journal of Biological Chemistry 287, 14234–14245, (2012). [DOI] [PMC free article] [PubMed] [Google Scholar]
- 22.Peers G et al. An ancient light-harvesting protein is critical for the regulation of algal photosynthesis. Nature 462, 518-U215, (2009). [DOI] [PubMed] [Google Scholar]
- 23.Dai HQ et al. TET-mediated DNA demethylation controls gastrulation by regulating Lefty-Nodal signalling. Nature 538, 528–532, (2016). [DOI] [PubMed] [Google Scholar]
- 24.Lopez D et al. Dynamic Changes in the Transcriptome and Methylome of Chlamydomonas reinhardtii throughout Its Life Cycle. Plant Physiol 169, 2730–2743, (2015). [DOI] [PMC free article] [PubMed] [Google Scholar]
- 25.Young JI, Zuchner S & Wang GF Regulation of the Epigenome by Vitamin C. Annu Rev Nutr 35, 545–564, (2015). [DOI] [PMC free article] [PubMed] [Google Scholar]
- 26.Cimmino L, Neel BG & Aifantis I Vitamin C in Stem Cell Reprogramming and Cancer. Trends in cell biology, (2018). [DOI] [PMC free article] [PubMed] [Google Scholar]
- 27.Bonente G et al. Analysis of LhcSR3, a protein essential for feedback de-excitation in the green alga Chlamydomonas reinhardtii. PLoS biology 9, e1000577, (2011). [DOI] [PMC free article] [PubMed] [Google Scholar]
- 28.Petroutsos D et al. A blue-light photoreceptor mediates the feedback regulation of photosynthesis. Nature 537, 563-+, (2016). [DOI] [PubMed] [Google Scholar]
- 29.Mullins EA et al. The DNA glycosylase AlkD uses a non-base-flipping mechanism to excise bulky lesions. Nature 527, 254–258, (2015). [DOI] [PMC free article] [PubMed] [Google Scholar]
- 30.Heyn H & Esteller M An Adenine Code for DNA: A Second Life for N6-Methyladenine. Cell 161, 710–713, (2015). [DOI] [PubMed] [Google Scholar]
- 31.Hemming BC & Gubler CJ High-pressure liquid chromatography of alpha-keto acid 2,4-dinitrophenylhydrazones. Anal Biochem 92, 31–40, (1979). [DOI] [PubMed] [Google Scholar]
- 32.Vidal-Meireles A et al. Regulation of ascorbate biosynthesis in green algae has evolved to enable rapid stress-induced response via the VTC2 gene encoding GDP-(L)-galactose phosphorylase. New Phytol 214, 668–681, (2017). [DOI] [PubMed] [Google Scholar]
- 33.Jiang LM, Huang J, Wang YL & Tang HR Eliminating the dication-induced intersample chemical-shift variations for NMR-based biofluid metabonomic analysis. Analyst 137, 4209–4219, (2012). [DOI] [PubMed] [Google Scholar]
- 34.Liu H et al. Identification of three novel polyphenolic compounds, origanine A-C, with unique skeleton from Origanum vulgare L. using the hyphenated LC-DAD-SPE-NMR/MS methods. J Agric Food Chem 60, 129–135, (2012). [DOI] [PubMed] [Google Scholar]
- 35.Lambert JB & Mazzola EP Nuclear magnetic resonance spectroscopy: an introduction to principles, applications, and experimental methods. (Pearson education, 2004). [Google Scholar]
- 36.Gaussian 09 (Gaussian, Inc., Wallingford, CT, USA, 2009).
- 37.Sueoka N, Chiang KS & Kates JR Deoxyribonucleic acid replication in meiosis of Chlamydomonas reinhardtii. I. Isotopic transfer experiments with a strain producing eight zoospores. J Mol Biol 25, 47–66, (1967). [DOI] [PubMed] [Google Scholar]
- 38.Baek K et al. DNA-free two-gene knockout in Chlamydomonas reinhardtii via CRISPR-Cas9 ribonucleoproteins. Sci Rep 6, 30620, (2016). [DOI] [PMC free article] [PubMed] [Google Scholar]
- 39.Maniatis T Molecular cloning: a laboratory manual. (1982). [Google Scholar]
- 40.Strenkert D, Schmollinger S & Schroda M Protocol: methodology for chromatin immunoprecipitation (ChIP) in Chlamydomonas reinhardtii. Plant Methods 7, 35, (2011). [DOI] [PMC free article] [PubMed] [Google Scholar]
- 41.Bolger AM, Lohse M & Usadel B Trimmomatic: a flexible trimmer for Illumina sequence data. Bioinformatics 30, 2114–2120, (2014). [DOI] [PMC free article] [PubMed] [Google Scholar]
- 42.Xi Y & Li W BSMAP: whole genome bisulfite sequence MAPping program. BMC Bioinformatics 10, 232, (2009). [DOI] [PMC free article] [PubMed] [Google Scholar]
- 43.Benjamini Y & Hochberg Y Controlling the False Discovery Rate - a Practical and Powerful Approach to Multiple Testing. J Roy Stat Soc B Met 57, 289–300, (1995). [Google Scholar]
- 44.Kim D et al. TopHat2: accurate alignment of transcriptomes in the presence of insertions, deletions and gene fusions. Genome Biol 14, R36, (2013). [DOI] [PMC free article] [PubMed] [Google Scholar]
- 45.Trapnell C et al. Differential gene and transcript expression analysis of RNA-seq experiments with TopHat and Cufflinks. Nat Protoc 7, 562–578, (2012). [DOI] [PMC free article] [PubMed] [Google Scholar]
- 46.Robinson MD, McCarthy DJ & Smyth GK edgeR: a Bioconductor package for differential expression analysis of digital gene expression data. Bioinformatics 26, 139–140, (2010). [DOI] [PMC free article] [PubMed] [Google Scholar]
Associated Data
This section collects any data citations, data availability statements, or supplementary materials included in this article.