Abstract
Purpose:
This study aimed to validate a binocular function score that is based on common clinical measures of visual function, providing a more complete analysis of binocular outcomes, against laboratory-based dichoptic tests of threshold stereoacuity and depth of suppression.
Methods:
Scores on a composite binocular function (BF) score derived from clinical stereoacuity measures (Randot Preschool Stereoacuity Test and Randot Butterfly) and the Worth 4 Dot test were determined in adults (n = 20; age 24.8 ± 7.2 years) and children (N = 77; age 8.3 ± 1.7 years) with abnormal binocular vision from strabismus or amblyopia. Adults had threshold stereoacuity measured with a novel, computerised dichoptic psychophysical test of stereopsis. Depth of suppression (dichoptic eye chart inter-ocular contrast balance test) was determined in both adults and children.
Results:
Clinical Randot stereoacuity was measurable in 50% of adult and 61% of child participants. Threshold stereoacuity was measurable in 65% of the adult participants. The presence of suppression or simultaneous perception (flat fusion or diplopia) was measurable in all participants, enabling assignment of a BF score to all participants in both groups. In adults, the BF score was highly correlated with the psychophysical threshold stereoacuity measure (ρ = 0.71; p < 0.001). In both adults and children, there was also a high correlation between the BF score and inter-ocular contrast balance (adult ρ = 0.90; child ρ = 0.86; p < 0.001).
Conclusions:
The composite BF score is a convenient and valid scale of binocularity that can be used to extend the stereoacuity measure in cohorts where nil stereoacuity is common and thus could be considered as an outcome measure in clinical trials.
Keywords: binocular vision, simultaneous perception, stereoacuity, suppression
Introduction
Amblyopia refers to impaired vision due to anomalous neurophysiological development that is the result of abnormal visual experiences early in life.1 The clinical measure typically used to quantify the magnitude of amblyopic vision impairment and evaluate the efficacy of treatment is monocular high contrast visual acuity. However, altered binocular visual function also characterises the condition, with many patients experiencing reduced or nil stereoacuity or suppression of the amblyopic eye.2,3
In addition to reporting visual acuity change, recent amblyopia treatment studies, including randomised clinical trials, have sought to quantify changes in the level of suppression or stereoacuity.4–9 This requires recording binocular function in individuals with a broad range of measureable stereoacuity through to those with complete suppression and no measurable stereopsis. Previous studies have assigned an arbitrary log stereopsis value to those with no measurable stereopsis,10 but this approach does not enable differentiation between suppression and simultaneous perception (fusion or diplopia) in the nil stereopsis group. To resolve this problem in a previous study, we reported the level of binocular function in children before and after binocular treatment for amblyopia,4 and proposed a composite binocular score based on widely used clinical measures that combines results from the Randot Preschool Stereoacuity Test11 and the Worth 4 Dot test.12 Stereoacuity was recorded as log arc sec for the smallest disparity Randot target that was correctly identified; the Worth 4 Dot test was used to indicate the presence or absence of binocular single vision. If stereoacuity was nil on the Randot test, but the child did not suppress on the Worth 4 Dot test, demonstrating second-degree fusion or simultaneous perception, (i.e. they reported either four or five dots) an arbitrary log threshold of four was recorded.10 If the child reported only two red or three green dots on the Worth 4 Dot they were considered to have complete suppression and were assigned an arbitrary log threshold score of five. The arbitrary values of four and five were chosen to clearly differentiate outcomes that were determined by Worth 4 Dot measures from those based on stereoacuity measures within our ordinal binocular function scale. By assigning a value to represent the presence or absence of suppression in our composite binocular function score we extended the log stereoacuity scale that has been previously employed,10 and thus included all participants in the analysis of binocular function.
A validated scale based upon common binocular clinical tests potentially has several useful applications. The ability to measure and quantify the full range of binocular function may be beneficial in studies that inform which aspects of binocular vision are most relevant for performance of visual and motor function during habitual binocular viewing conditions. Our scale could be used for this purpose. It provides a common nomenclature for recording suppression and stereoacuity enabling more sophisticated statistical analysis than current measures. The scale can be used as an outcome measure of binocular perception in clinical trials that explore methods for treating amblyopia in children and adults.
Here we report the concurrent validity of the binocular function (BF) score by determining the correlation between the assigned BF score and a computer-based threshold stereoacuity test that measures with a range up to 4096 arc sec in a participant group of adults with abnormal binocular vision. Further, we determined the correlation between the BF score and laboratory-based dichoptic tests of depth of suppression in the adult and a child participant group. We also considered relative testability of the BF score by comparing the proportion of interpretable responses obtained in both participant groups for the various tests of binocular perception.
Methods
Participants
Binocular function score was determined in two participant groups (adult and child) with abnormal binocular vision from amblyopia or strabismus. None had co-existing general developmental, systemic or ocular pathology or congenital abnormality. Eligibility criteria in both groups were a history of strabismus (with or without amblyopia), or amblyopia (anisometropic, strabismic or combined mechanism). Amblyopia was defined as an inter-ocular difference in best-corrected visual acuity of 0.2 logMAR or worse.
Adults aged 20–65 years
Visual acuity (electronic Early Treatment of Diabetic Study e-ETDRS); clinical stereoacuity [Randot® Preschool Stereoacuity Test (RPST) (www.stereooptical.com/products/stereotests-color-tests/randot-preschool/); Worth 4 Dot response at 33 cm; threshold stereoacuity (using computer generated random dot stereogram (RDS)]13; and depth of suppression [contrast balance index (CBI)]14 were tested in adults (n = 20; age 24.8 ± 7.2 [21–63] years). Room illumination was approximately 175 lux for all testing. Data were collected at the Queensland University of Technology. The study was conducted in accordance with the requirements of the Queensland University of Technology Human Research Ethics Committee. All protocols were in accord with the guidelines of the Declaration of Helsinki.
Children aged 6–12 years
Visual acuity (HOTV for children aged 6 years, e-ETDRS age 7 years and above); clinical stereoacuity (RPST and the Stereo Butterfly Test) (www.stereooptical.com/products/stereotests-color-tests/butterfly/); Worth 4 Dot response at 33 cm; and depth of suppression (CBI)15 were tested in children (n = 77; age 8.3 ± 1.7 [6.12013–12.7] years). All tests were administered and scored according to the manufacturer’s instructions. Clinical stereo testing was conducted at 40 cm, according to the manufacturer’s instructions. The Worth 4 Dot test was conducted at 33 cm. Room illumination was approximately 200 lux. All children were tested in the Pediatric Vision Laboratory at the Retina Foundation of the Southwest. Written informed consent was obtained from a parent after explanation of the study. All procedures and the protocol were approved by the Institutional Review Board of University of Texas Southwestern Medical Center, followed the tenets of the Declaration of Helsinki, and complied with the requirements of the US Health Insurance Portability and Accountability Act of 1996.
Stimuli and apparatus
Composite binocular function score (BF Score)
The BF score was derived from stereoacuity measured with the Randot Preschool Stereoacuity Test (RPST) (from 40 to 800 arc sec), the Randot Butterfly test (2000 arc sec) or the Worth 4 Dot test. The best stereoacuity level correctly identified by the participant was converted to a log value providing a stereoacuity range from 1.6 (log 40 arc sec) to 3.3 (log 2000 arc sec). A score of 4 was assigned to nil stereoacuity when the Worth 4 Dot test outcome indicated simultaneous perception or second-degree fusion. A score of five was assigned to nil stereoacuity when the Worth 4 Dot test outcome indicated suppression (Table 1).
Table 1.
Composite binocular function score calculation
| Stereoacuity test outcome | BF score |
|---|---|
| Randot stereoacuity test | |
| 40 arc sec | 1.6 |
| 60 arc sec | 1.8 |
| 100 arc sec | 2.0 |
| 200 arc sec | 2.3 |
| 400 arc sec | 2.6 |
| 800 arc sec | 2.9 |
| Randot butterfly test | |
| 2000 arc sec | 3.3 |
| Worth 4 dot | |
| Simultaneous perception or second degree fusion (reports four or five dots) | 4.0 |
| Suppression (reports two red or three green dots) | 5.0 |
Random dot stereogram threshold stereoacuity measure
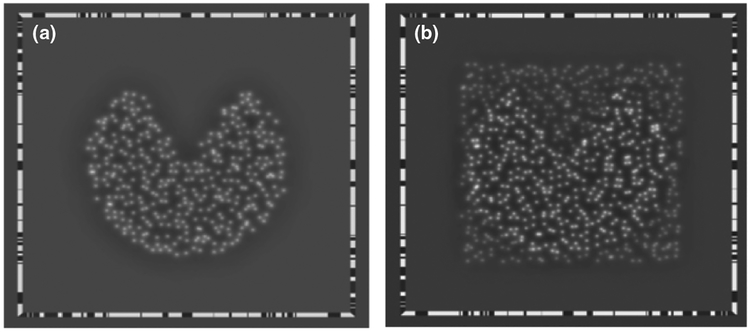
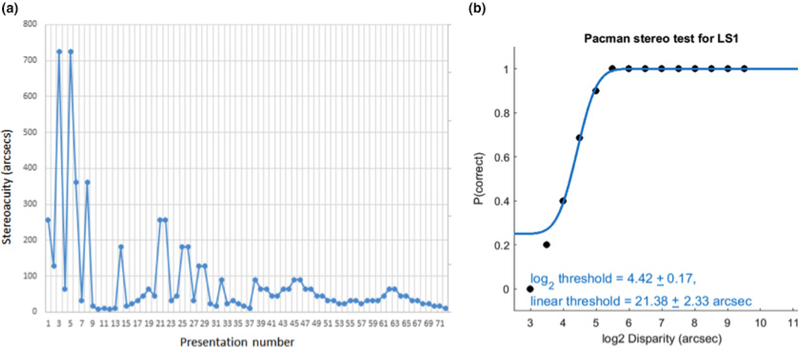
A McGill Vision Research modified random dot stereogram (RDS) (www.mcgill.ca/mvr/) was used to measure threshold stereoacuity in the adult participants. Stimuli were displayed on a 3-D monitor and viewed through synchronised shutter glasses. The stimuli were random dots (average luminance 48 cd/m2) against a uniform grey background (luminance 34 cd/m2), which were offset to create crossed disparity so when observed with the shutter glasses gave the percept of a floating circle with a missing sector (‘Pac-Man’ shape). At the 90 cm viewing distance the stimulus subtended a visual angle of 9 degrees. Figure 1a displays the initial presentation that familiarised the participant with the task, Figure 1b presents a supra-threshold presentation where the stimulus is perceived as floating in front of the background. A single stimulus was presented at a time and participants reported the perceived position of the missing sector by four alternative forced choice without feedback. A staircase method was employed to determine stereoacuity threshold (arc sec). The logarithmic stereoacuity value at 50% correct was used to extrapolate the linear stereoacuity threshold reported in seconds of arc.13 Figure 2 provides an example staircase and frequency of seeing curve.
Figure 1.
(a) Demonstration stimulus to familiarise the participant with the task. (b) The stereogram percept was a circle with a missing sector that appeared to float above the background.
Figure 2.
Example of data from four alternative forced-choice (4AFC) stereoacuity task plotted to demonstrate the staircase and frequency of seeing curve from which the stereoacuity threshold was derived.
Contrast balance index
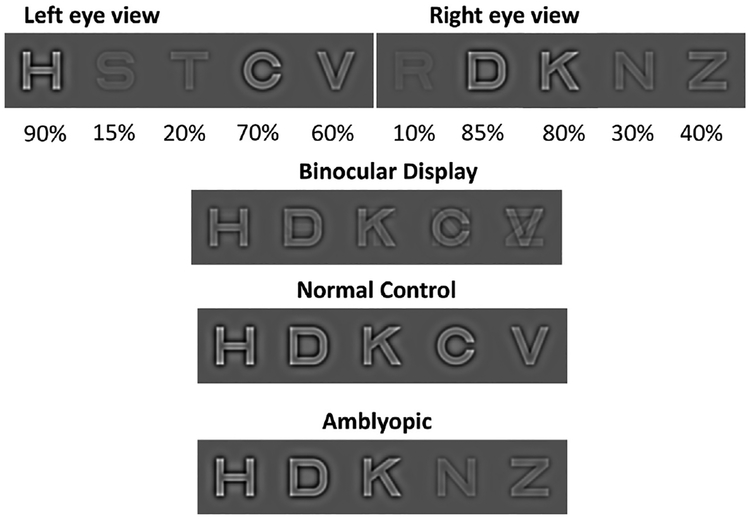
Contrast balance index (CBI) provides a quantitative measure of depth of suppression. The test determines the contrast ratio between dichoptically presented letters at which the likelihood that the observer will correctly report the left or right eye letter is equal.14–16 Sloan letters chosen from the EDTRS letter set were presented on a dichoptic display (five letters per line) equivalent to 1.2 logMAR at 90 cm viewing distance. For children aged 6 years, letters from the HOTV subset were used. At each position, the identity of the letter and its contrast on each eye’s chart differed, with the sum of the contrast of two overlapping letters always totalling 100%, as shown in Figure 3. Participants reported the salient letters seen (most prominent letter in each of the five positions) through a series of presentations, determining the contrast threshold of the left eye. Contrast threshold for the right eye was then determined by subtracting the left eye contrast threshold from one (R = 1–L). Contrast ratio was calculated as the non-dominant eye threshold divided by the fellow eye threshold. For adults, participants observed the stimuli whilst wearing NVIDIA 3D Vision® 2 Model P1431 shutter glasses, which were synchronised with the 3-D monitor via a NVIDIA infrared emitter Model P854 (www.nvidia.com). The shutter glasses allowed letters that occupied the same position on the screen to be presented separately to each eye. For children, the same protocol was used with the exception that they viewed the dichoptic stimuli on a passive 3-D display (LG D2343P- BN; 1920 × 1080 pixel), while wearing circularly polarised glasses to present separate images to each eye.
Figure 3.
Schematic diagram of the dichoptic letter position and contrast presented via dichoptic shutter or polarised glasses. The top image is an example of letter presentations to each eye. The second image shows perceived letters when the highest contrast letter at a given position is dominant. The third image shows perceived letters for normal binocular vision with dichoptic presentation. The final image shows perceived letters for an observer with an amblyopic left eye where the left eye letters are salient at 90% contrast, however letters of 70% and 60% were not salient over those lower contrast letters presented to the dominant right eye. Reproduced with permission from Birch et al. (2016)16
Analysis
Spearman’s rank correlation co-efficient (ρ) was calculated to evaluate the association between the ordinal BF score and RDS (log threshold stereoacuity) measured in the adult group, and between BF score and CBI in both groups. Pearson’s chi-square analyses were used to identify significant differences between the percentages of interpretable responses for the various measures of binocular perception using IBM SPSS statistics software (www.ibm.com/analytics/spss-statistics-software).
Results
A clinical measure of stereoacuity with the RPST and/or the Randot Butterfly tests was possible in 10 of 20 (50%) adult participants and in 47 of the 77 (61%) child participants; the remaining participants completed the test, however, did not correctly identify any shapes at the highest disparity presented (nil stereo acuity). The presence of suppression or simultaneous perception (flat fusion or diplopia) was determined using the Worth 4 Dot response at 33 cm in all participants (100% of both child and adult participants). Depth of suppression by CBI was determined in all participants (100% of both child and adult participants). The threshold stereoacuity using computer generated RDS (tested only in the adult group) was determined in 13 of 20 (65%) adult participants. Inclusion of the Worth 4 Dot results as an extension of the log stereoacuity measure provided a ranking of binocular perception in all participants, demonstrating a significantly higher testability response in both groups (adults n = 20; 50% vs 100%; children n = 77; 61% vs 100%; p < 0.001). While the proportion of adults who were able to pass at least one level of stereoacuity testing was higher with the RDS than RPST (n = 20; 65% vs 50%; p = 0.34), it was less than that for the assigned BF score (n = 20; 65% vs 100%; p = 0.006). There was no difference in testability between BF score and CBI (100% for both tests for both participant groups).
Mean and standard deviation and range of outcome scores for participants in both study groups are shown in Table 2.
Table 2.
Mean (S.D.) and range of binocular test outcome scores
| Study group | Binocular test | Proportion measurable | Mean (S.D.) | Range |
|---|---|---|---|---|
| Adult | ||||
| n = 20 | log Stereoacuity (RPST) (arcsec) | 50% | 2.37 (0.43) | 1.78–2.90 |
| age 24.8 ± 7.2 | BF score | 100% | 3.38 (1.14) | 1.78–5.00 |
| [21–63] years | log Contrast Balance Index | 100% | 0.78 (0.45) | 0.11–1.59 |
| Threshold RDS (arcsec) | 65% | 643 (976) | 40–3141 | |
| log RDS | 65% | 2.33 (0.66) | 1.60–3.50 | |
| Child | ||||
| n = 77 | log Stereoacuity (RPST/Butterfly) | 61% | 2.25 (0.43) | 1.60–3.30 |
| age 8.3 ± 1.7 | BF score | 100% | 3.02 (1.07) | 1.60–5.00 |
| [6.1–12.7] years | log Contrast Balance Index | 100% | 0.56 (0.55) | −0.25–2.00 |
RDS, Threshold Random Dot Stereogram; RPST, Randot Preschool Stereoacuity Test.
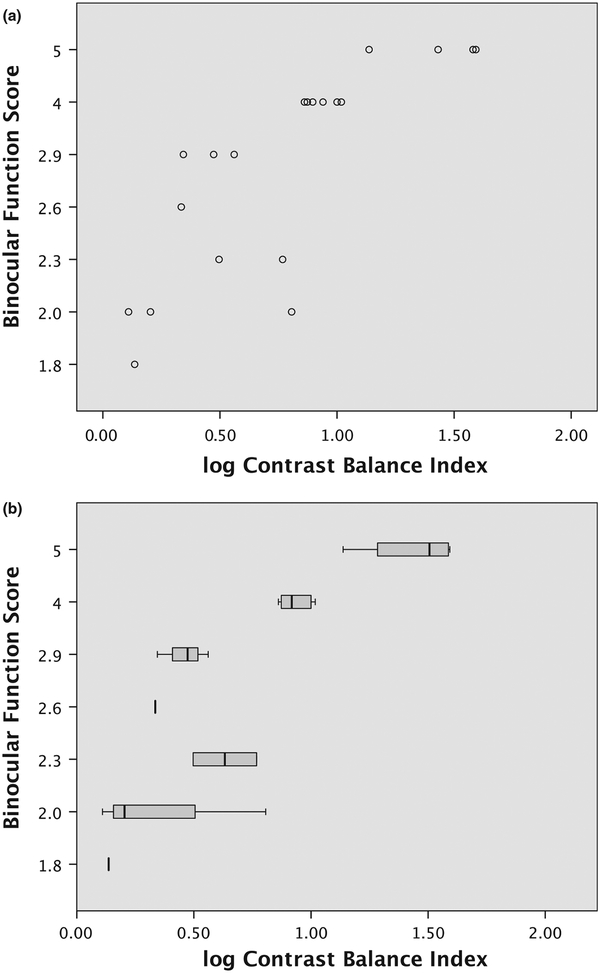
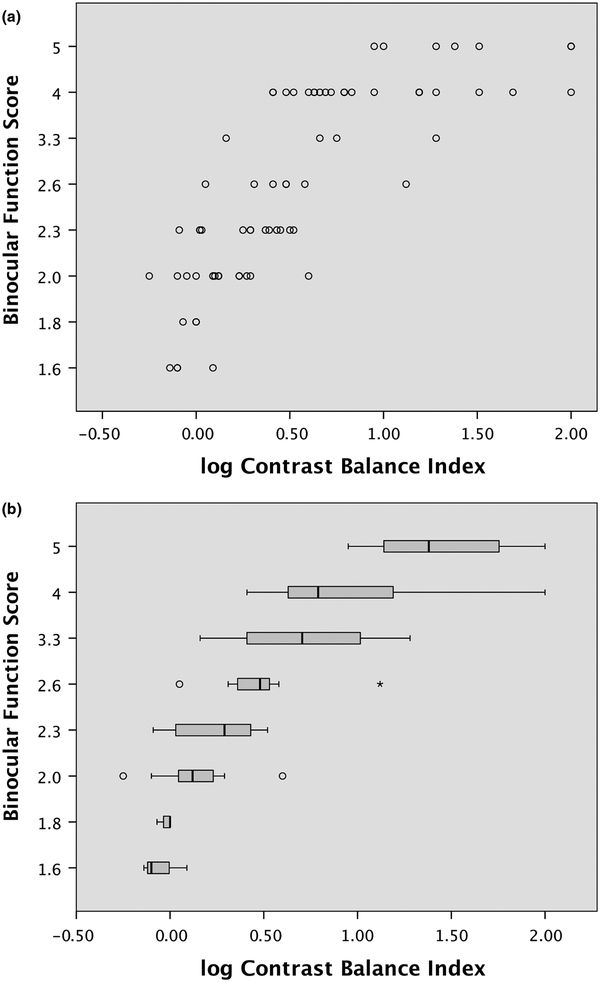
The BF Score was highly correlated with depth of suppression (log CBI) in both study groups (in adult study ρ = 0.90; in child study ρ = 0.86). Figure 4 shows (a) scatter plot and (b) box plot of BF score as a function of log CBI for adults. Figure 5 shows (a) scatter plot and (b) box plot of BF score as a function of log CBI for children.
Figure 4.
Association between the binocular function (BF) score and contrast balance index in the adult participants (n = 20). (a) individual data (b) medians and interquartile ranges.
Figure 5.
The association between the composite binocular function (BF) score and contrast balance index in the child participants (n = 77). (a) individual data (b) medians and interquartile ranges.
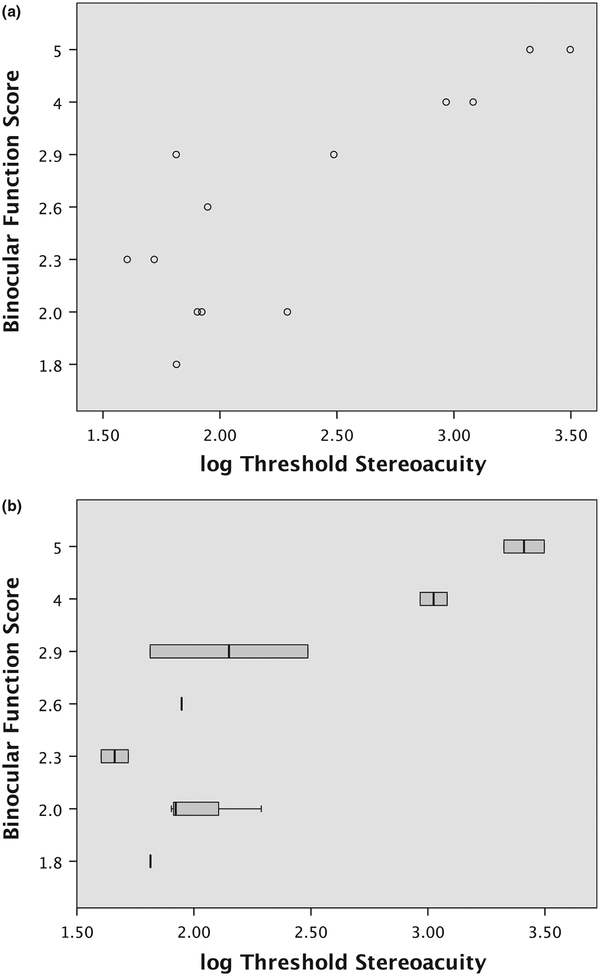
The derived BF score was highly correlated with the RDS measure determined in 13 adult subjects (ρ = 0.71; p < 0.001). Figure 6 shows (a) scatter plot and (b) box plot of BF score as function of log RDS.
Figure 6.
The association between the composite binocular function (BF) score and random dot stereoacuity in the adult participants (n = 13). (a) individual data (b) medians and interquartile ranges.
Discussion
Two binocular vision measures that are commonly employed to describe binocular function are the presence or absence of suppression and the threshold binocular disparity that results in the ability to perceive depth information (stereoacuity). In this technical note we describe a convenient scale that captures these two aspects of binocular function in the clinic and that is suitable for statistical analysis as an outcome measure in clinical trials. The proposed Binocular Function (BF) score can be derived from common clinical tests and enables ranking of participants with nil stereoacuity for more complete analysis of binocular outcomes. The BF score assigns values to represent the presence or absence of inter-ocular suppression as an extension of the log stereoacuity scale and is highly correlated with more sophisticated laboratory-based binocular function tests. While more complex laboratory based tests such as contrast balance index or dichoptic motion coherence tests17 provide a measure of severity of binocular suppression, they are not suitable for multi-site clinical trials and can be complex tasks for children to complete.
The composite BF score is an ordinal grading based on responses to two determinants of binocular perception and is not a continuous variable. A feature of the BF score is the discriminate assignment of four and five for those participants who had nil stereoacuity. The decision to assign a whole number rank that was deliberately outside the range of possible clinical stereoacuity measures was so that there was clear differentiation between those patients who have some measure of stereoacuity and those who do not. Further, the BF score in its current form discriminates between those who suppress at 33 cm on the Worth 4 Dot test in standard room illumination and those who do not.
The composite BF score has been successfully used in recent amblyopia treatment trials for analysis of treatment effects.8,9 The scale is ordinal, rather than continuous, therefore, outcomes are analysed with non-parametric statistics. We have shown that the composite score highly correlates with both a measure of inter-ocular suppression and with a threshold measure of stereoacuity that tests coarse levels of binocular disparity detection beyond the range of common clinical tests.
To derive the BF score we employed the RPST and the Worth 4 Dot test at 33 cm, which have established validity and testability in children.18,19 Other stereoacuity tests that provide an outcome stereopsis measure in sec of arc could also be used. Similarly, tests of suppression such as polarised 3 dot20 or Bagolini striated lenses21 might provide a suppression measure that could be incorporated into the scale, although the methods of dissociation and how that impacts on patient’s responses need to be considered. Clinically, suppression can be described by the size of the suppression zone and by the testing conditions that will counter suppression. We used the Worth 4 Dot at 33 cm in standard room illumination to determine the BF score for those with nil stereoacuity. This decision was to ensure consistency with the near viewing distance of the clinical stereoacuity tests. However, some patients will report suppression on a distance Worth 4 Dot test whose elements subtend a smaller visual angle (1.25 deg at 6 m), and not on the near test (6 deg at 33 cm) due to the size of their central suppression zone. Worth 4 Dot test results can also vary with lighting conditions that alter the relative visibility of the red and green illuminated stimulus, or a filter or Sbisa bar can be introduced to lower the relative brightness of targets viewed by the dominant eye to grade the depth of suppression. The broad steps of the current scale provide scope for future refinement, whereby those who have nil stereoacuity could be further ranked by the size or depth characteristics of their suppression.
The composite BF score was shown to highly correlate with a psychophysical determination of stereoacuity that can be determined across a range of stereopsis beyond that of clinical stereo tests. Stereoacuity outcomes determined with standard clinical polarised or anaglyphic tests are not normally distributed within samples, but rather, there is a floor and ceiling effect because many subjects have stereopsis equal to or better than the highest stereoacuity level commonly tested (40 arc sec) and many cannot pass the test at any level. Combining the clinical stereoacuity measure with the outcome of the Worth 4 Dot suppression test extends the ordinal score for those with severely degraded binocular vision. RDS outcome, the threshold measure of stereoacuity that provides continuous data, showed lower (better) disparity detection threshold than the book based RPST that provides a measure of stereoacuity in discrete steps up to 2.9 log arcsec. In those participants with stereoacuity within the range of RPST, the difference between RPST and RDS is 1.0 log unit or less (<10 arc sec on linear scale). The participants who were assigned a BF score of four or five based on their Worth 4 Dot response had stereoacuity thresholds outside the range of clinical stereoacuity tests. These arbitrary scores are deliberately chosen to be beyond measureable stereoacuity thresholds to clearly rank nil stereoacuity as poorer binocular function than those with stereopsis that is within the range of clinical stereo tests. This, combined with the ordinal grading scale nature of the BF score, underlies the trend for greater discrepancy at the poorer stereoacuity measures that are beyond the clinical Randot tests, where scores of four and five have been assigned within the BF scale.
While we have demonstrated strong correlation between the BF score and both a CBI measure of suppression and the RDS threshold measure of stereoacuity, the measurement techniques are not equivalent, with the BF score being a ranked ordinal scale limited to non-parametric statistical analysis. The use of validated psychophysical measurements that can quantify very coarse stereo thresholds or inter-ocular suppression are optimum as outcome measures for clinical trials. However, in the absence of such measures, the BF score determined using commonly available clinical tests can rank stereoacuity and can discriminate between those with simultaneous perception and suppression on an ordinal scale.
Younger children continue to be the focus of amblyopia treatment trials.2,22 Our composite binocular function score is based on clinical measures that have been validated for use in children18,19 and should prove suitable for evaluating binocular perception in paediatric studies. We were able to successfully determine BF score in children aged 6–12 years, and suggest that the Preschool Worth 4-Shape Test19 could replace the Worth 4 Dot test in children aged less than 4 years who may be enrolled in clinical trials.
Conclusion
We have described and evaluated a simple composite score that captures a broad range of binocular perception. The composite BF score allows a ranked descriptor of binocular visual perception for participants with nil stereoacuity, and is easily achievable in children. The BF score is a convenient and valid measure of binocularity that can be used to extend the stereoacuity scale in cohorts for whom nil stereoacuity is common. Assigning a value to represent the presence or absence of suppression as an extension of the stereoacuity scale enables inclusion of all participants in the analysis of binocular function. The ordinal scale has high agreement with laboratory-based dichoptic tests that can provide a threshold measure of stereoacuity across a broader range of disparity than can be assessed by standard clinical stereoacuity tests and with dichoptic contrast-rebalancing tests for measurement of severity of suppression. Unlike the laboratory-based tests, the binocular function score is limited to an ordinal scale, but its ease of use in clinical research settings is an advantage.
Disclosures
This research received no specific grant from any funding agency in the public, commercial, or not-for-profit sectors. Eileen Birch would like to acknowledge National Eye Institute grant EY022313. The authors report no conflicts of interest and have no proprietary interest in any of the materials mentioned in this article.
References
- 1.Levi DM & Carkeet A. Amblyopia: a consequence of abnormal visual development In: Early Visual Development Normal and Abnormal, Simons K, ed. Oxford University Press: New York, 1993; pp. 391–408. [Google Scholar]
- 2.Birch EE. Amblyopia and binocular vision. Prog Retin Eye Res 2013; 33:67–84. [DOI] [PMC free article] [PubMed] [Google Scholar]
- 3.Levi DM, Knill DC & Bavelier D. Stereopsis and amblyopia: a mini-review. Vision Res 2015; 114: 17–30. [DOI] [PMC free article] [PubMed] [Google Scholar]
- 4.Webber AL, Wood JM & Thompson B. Fine motor skills of children with amblyopia improve following binocular treatment. Invest Ophthalmol Vis Sci 2016; 57: 4713–4720. [DOI] [PubMed] [Google Scholar]
- 5.Birch EE, Li SL, Jost RM, et al. Binocular iPad treatment for amblyopia in preschool children. J AAPOS 2015; 19: 6–11. [DOI] [PMC free article] [PubMed] [Google Scholar]
- 6.Kelly KR, Jost RM, Dao L, Beauchamp CL, Leffler JN & Birch EE. Binocular iPad game vs patching for treatment of amblyopia in children: a randomized clinical trial. JAMA Ophthalmol 2016; 134: 1402–1408. [DOI] [PMC free article] [PubMed] [Google Scholar]
- 7.Holmes JM, Manh VM, Lazar EL, et al. Effect of a binocular iPad game vs part-time patching in children aged 5 to 12 years with amblyopia: a randomized clinical trial. JAMA Ophthalmol 2016; 134: 1391–1400. [DOI] [PMC free article] [PubMed] [Google Scholar]
- 8.Gao TY, Guo CX, Babu RJ, et al. Effectiveness of a binocular video game vs placebo video game for improving visual functions in older children, teenagers, and adults with amblyopia: a randomized clinical trial. JAMA Ophthalmol 2018; 136: 172–181. [DOI] [PMC free article] [PubMed] [Google Scholar]
- 9.Gao TY, Anstice N, Babu RJ, et al. Optical treatment of amblyopia in older children and adults is essential prior to enrolment in a clinical trial. Ophthalmic Physiol Opt 2018; 38: 129–143. [DOI] [PubMed] [Google Scholar]
- 10.Hess RF, Babu RJ, Clavagnier S, Black J, Bobier W & Thompson B. The iPod binocular home-based treatment for amblyopia in adults: efficacy and compliance. Clin Exp Optom 2014; 97: 389–398. [DOI] [PubMed] [Google Scholar]
- 11.Birch EE, Williams C & Hunter J, Lapa MC, ALSPAC. Random Dot Stereoacuity of preschool children. J Pediatr Ophthalmol Strabismus 1997;34:217–222. [DOI] [PubMed] [Google Scholar]
- 12.Von Noorden G Atlas of strabismus In: Atlas of Strabismus, Klein E, ed. Mosby: St Louis, Missouri, 1983; pp. 70–71. [Google Scholar]
- 13.Hess RF, Ding R, Clavagnier S, et al. A robust and reliable test to measure stereopsis in the clinic. Invest Ophthalmol Vis Sci 2016; 57: 798–804. [DOI] [PubMed] [Google Scholar]
- 14.Kwon M, Wiecek E, Dakin SC & Bex PJ. Spatial-frequency dependent binocular imbalance in amblyopia. Sci Rep 2015; 5: 17181. [DOI] [PMC free article] [PubMed] [Google Scholar]
- 15.Kwon M, Lu ZL, Miller A, Kazlas M, Hunter DG & Bex PJ. Assessing binocular interaction in amblyopia and its clinical feasibility. PLoS ONE 2014; 9: e100156. [DOI] [PMC free article] [PubMed] [Google Scholar]
- 16.Birch EE, Morale SE, Jost RM, et al. Assessing suppression in amblyopic children with a dichoptic eye chart. Invest Ophthalmol Vis Sci 2016; 57: 5649–5654. [DOI] [PMC free article] [PubMed] [Google Scholar]
- 17.Li J, Lam CS, Yu M, et al. Quantifying sensory eye dominance in the normal visual system: a new technique and insights into variation across traditional tests. Invest Ophthalmol Vis Sci 2010; 51: 6875–6881. [DOI] [PubMed] [Google Scholar]
- 18.Birch E, Williams C, Drover J, et al. Randot preschool stereoacuity test: normative data and validity. J AAPOS 2008; 12: 23–26. [DOI] [PMC free article] [PubMed] [Google Scholar]
- 19.Morale SE, Jeffrey BG, Fawcett SL, et al. Preschool worth 4- shape test: testability, reliability, and validity. J AAPOS 2002; 6: 247–251. [DOI] [PubMed] [Google Scholar]
- 20.Arthur BW & Keech RV. The polarized three-dot test. J Pediatr Ophthalmol Strabismus 1987; 24: 305–308. [DOI] [PubMed] [Google Scholar]
- 21.Von Noorden G Binocular Vision and Ocular Motility; Theory and Mangement of Strabismus, 4th edn. Mosby: St. Louis, 1990. [Google Scholar]
- 22.Holmes JM, Lazar EL, Melia BM, et al. Effect of age on response to amblyopia treatment in children. Arch Ophthalmol 2011; 129: 1451–1457. [DOI] [PMC free article] [PubMed] [Google Scholar]


