Museum records can document long-term changes in phenology, species interactions, and trait evolution (1). However, these data have spatial and temporal biases in sampling which may limit their use for tracking abundance (2). Often, museum records are the only historical data available, and in PNAS, Boyle et al. (3) make long-term abundance estimates for the eastern population of the North American monarch butterfly (Danaus plexippus) and its milkweed host plant (Asclepias spp.) using 1,191 and 31,510 records, respectively, from 1900 to 2016. They conclude that monarch and milkweed abundance started to decline in the mid-20th century, before the adoption of herbicide-resistant crops that are often blamed for losses of monarch host plants (4). Using the same data, I argue that the monarch trend is sensitive to the method of standardization and appears less robust than the milkweed trend.
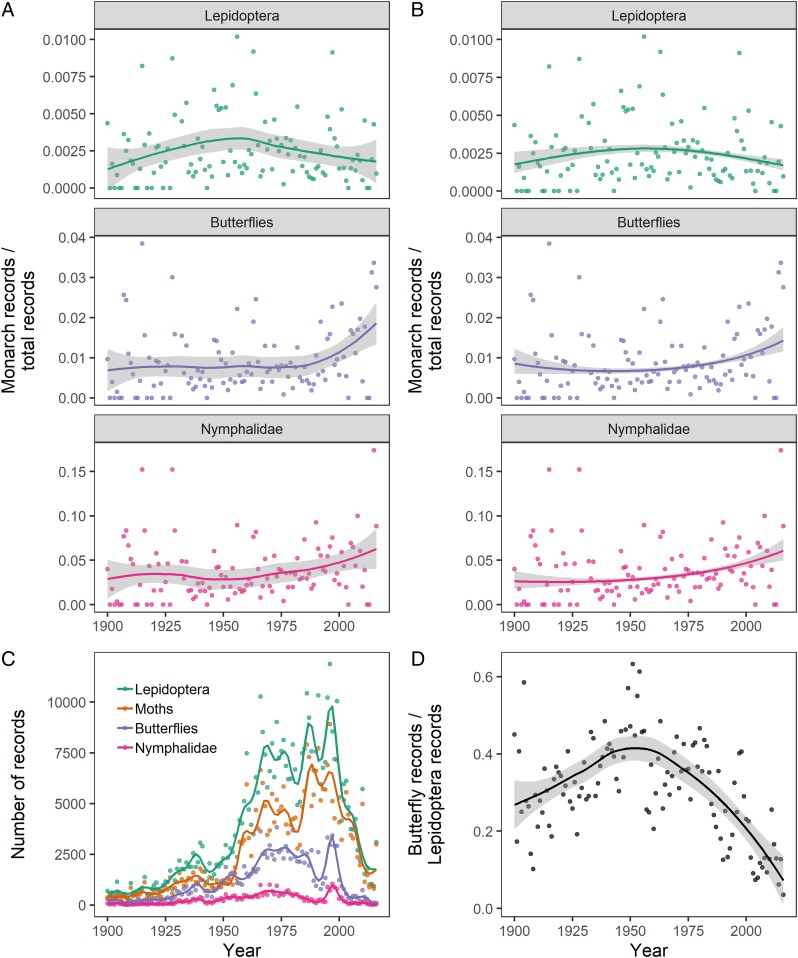
Boyle et al. (3) recognize that museum records must be standardized by collection effort to estimate an index of annual relative abundance (2, 5). They divided the number of monarch records by the number of Lepidoptera records in each year. Their abundance index peaks mid-20th century before a long-term decline (reproduced in Fig. 1 A, Top). However, this trend changes with the choice of taxa used to standardize monarch records. The abundance trend after dividing monarch records by butterfly (Rhopalocera) or Nymphalidae records shows no midcentury peak corresponding to the milkweed trends (Fig. 1 A, Middle and Bottom). I also show similar results from generalized linear models with linear and quadratic effects of year that account for the annual number of museum records with weights (5), a feature that the approach in ref. 3 lacks (Fig. 1B).
Fig. 1.
Trends in museum records of the eastern population of North American monarch butterfly change with the choice of standardization. All data came from ref. 8 and span the eastern United States from 1900 to 2016. (A) I reproduce figure 1A of ref. 3 with Boyle et al.’s standardization by Lepidoptera records (Top) and present 2 alternative standardizations (Rhopalocera and Nymphalidae) (Middle and Bottom). I similarly use the default LOESS smooth in the ggplot2 R package (9) for visualizing trends and 95% CIs. (B) The relative abundance of the 3 standardizations are alternatively modeled with a binomial generalized linear model, weighted by the annual number of records, predicting relative abundance with linear and quadratic year covariates. (C) Total number of records of Lepidoptera, moths, butterflies, and Nymphalidae each year with splines showing trends. (D) The proportion of butterfly records to all Lepidoptera records shows a strong temporal trend that influences the mid-20th-century peak of monarch abundance reported in ref. 3 and shown in A, Top and B, Top.
Collection effort that does not target the species of interest should be excluded when possible in these standardizations. Within the Lepidoptera, moths and butterflies would be most frequently sampled by nighttime light traps and daytime netting, respectively. One reason the monarch trend reported in ref. 3 changes when standardized by other taxa is the declining proportion of butterflies within Lepidoptera from a peak of 40% to less than 10% (Fig. 1 C and D), potentially due to increasing use of light traps around the mid-20th century (6). In reference to museum records, Boyle et al. (3) note that “the most concerning possible biases are those that change over time within a species.” My reanalysis shows that changes over time within the taxa used to standardize records also matter.
I do not think that this reanalysis presents the true monarch trend, since it contrasts with recent declines (7). Rather, I think analysis of abundance from biological records needs more data and methodological advances to approach the value of systematic monitoring (2). Boyle et al.’s (3) estimates for milkweed trends may be more robust, with 30 times the number of herbarium records compared with monarch specimens. Boyle et al. verified their method for herbarium records by correctly estimating increasing trends in 4 invasive plants over the 20th century. A similar approach with invasive insects would be a valuable test to verify whether museum records can estimate long-term trends in highly variable insect populations.
Footnotes
The author declares no conflict of interest.
References
- 1.Meineke E. K., Davies T. J., Daru B. H., Davis C. C., Biological collections for understanding biodiversity in the Anthropocene. Philos. Trans. R. Soc. Lond. B Biol. Sci. 374, 20170386 (2018). [DOI] [PMC free article] [PubMed] [Google Scholar]
- 2.Isaac N. J. B., Pocock M. J. O., Bias and information in biological records. Biol. J. Linn. Soc. Lond. 115, 522–531 (2015). [Google Scholar]
- 3.Boyle J. H., Dalgleish H. J., Puzey J. R., Monarch butterfly and milkweed declines substantially predate the use of genetically modified crops. Proc. Natl. Acad. Sci. U.S.A. 116, 3006–3011 (2019). [DOI] [PMC free article] [PubMed] [Google Scholar]
- 4.Pleasants J. M., Oberhauser K. S., Milkweed loss in agricultural fields because of herbicide use: Effect on the monarch butterfly population. Insect Conserv. Divers. 6, 135–144 (2013). [Google Scholar]
- 5.Bartomeus I., et al. , Historical changes in northeastern US bee pollinators related to shared ecological traits. Proc. Natl. Acad. Sci. U.S.A. 110, 4656–4660 (2013). [DOI] [PMC free article] [PubMed] [Google Scholar]
- 6.Southwood T. R. E., Ecological Methods: With Particular Reference to the Study of Insect Populations (Chapman and Hall, New York, 1978). [Google Scholar]
- 7.Vidal O., Rendón-Salinas E., Dynamics and trends of overwintering colonies of the monarch butterfly in Mexico. Biol. Conserv. 180, 165–175 (2014). [Google Scholar]
- 8.Boyle J., Dalgleish H., Puzey J., Data from “Monarch butterfly and milkweed declines substantially predate the use of genetically modified crops.” Dryad Digital Repository https://datadryad.org/resource/doi:10.5061/dryad.sk37gd2. Accessed 23 February 2019. [DOI] [PMC free article] [PubMed]
- 9.Wickham H., ggplot2: Elegant Graphics for Data Analysis (Springer-Verlag New York, 2016).


