Opportunistic data provide a tantalizing opportunity to examine patterns in biodiversity over large spatiotemporal scales (1). Recent methodological advancements hold promise for utilizing such data to estimate trends while also highlighting the difficulty in accurately assessing biases (2–5). The idea is to determine the total number of collections of similar species within a reasonably comparable time and place to correct for variations in sampling effort. Using specimen data collected opportunistically, Boyle et al. (6) show a midcentury increase in monarch abundance followed by a decrease starting in the 1960s. However, their analysis used an inappropriate correction with respect to 3 dimensions of effort: taxonomy, place, and time. When these data are restandardized to account for biases in the collection process (Fig. 1), there is no midcentury peak in abundance (Fig. 2).
Fig. 1.
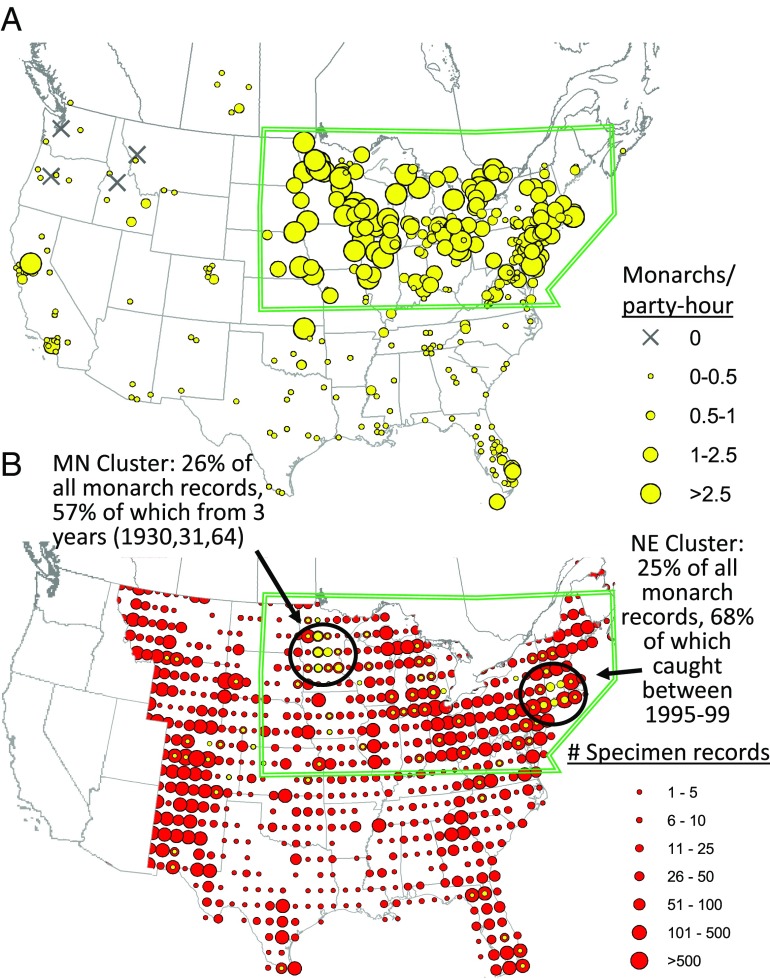
Within the United States and Canada, monarchs are most abundant in their main summer range (east of −100°W, between 38°N and 50°N; outlined in green) during peak breeding (June 15 to August 14). (A) This distribution of monarchs is mapped using an average abundance index from the North American Butterfly Association’s nationwide count program (counts are standardized by party-hour). Only sites that have at least 10 y of surveys conducted during peak summer breeding were included. (B) The number of museum records is shown using a 1° grid throughout the analysis range used by Boyle et al. (6). The total number of specimens collected from 1900 to 2016 is indicated by circle size (yellow for monarchs, red for all butterflies). Half of all monarch records were collected in 2 spatially restricted clusters (black circles), primarily from a restricted set of years, indicated in the figure.
Fig. 2.
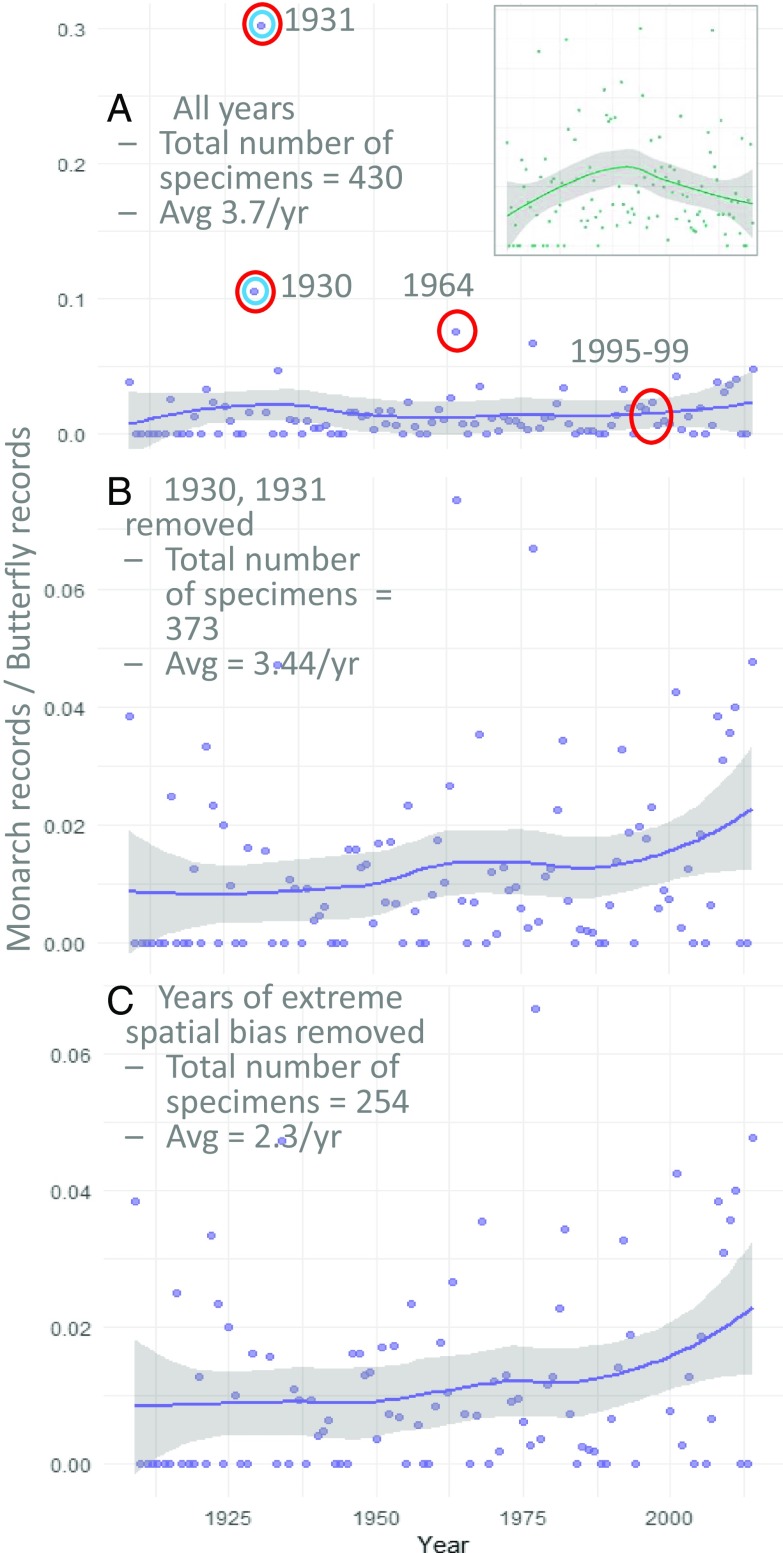
A yearly monarch abundance index was calculated using a subset (see text) of the data and R script provided by Boyle et al. (6). The original, reported pattern is shown in A, Inset (reprinted from ref. 7). We restricted our analyses to primary monarch breeding grounds (green outline in Fig. 1) during the peak breeding season (June 15 to August 14). We present results when all years (1900 to 2016) were included (A) and when 2 outlier years (identified with blue circles in A) were excluded (B) as was done in Boyle et al. (6). We also present results when all outlier years (identified with red circles in A) were excluded (C). The total number of monarchs included in each analysis and the mean number per year is shown in A–C. The median number of monarch specimens collected per year in all panels is 1.
In PNAS, Wepprich (7) demonstrates that the pattern presented by Boyle et al. (6) could be explained by a spike in moth museum records in the 1950s. Moth records should generally not be used to correct for butterfly species analyses because the collection process for most moths (light trapping at night) is substantially different than for butterflies (net captures during the day). Here, we additionally address the issue of spatiotemporal bias in the collection process. One way to reduce this bias is to restrict analysis to the core range and time of year when the species is most evenly distributed and consistently abundant. Records falling outside core range do not add significant information but risk collection biases, which can lead to spurious patterns. The eastern population of the migratory monarch reaches their highest abundance and most consistent distribution during the summer breeding season (Fig. 1A; data shown are from standardized North American Butterfly Association summer surveys [available in Dryad; doi:10.5061/dryad.2548jb4]). Constraining abundance estimates to their core spatial and temporal extent has been shown to best correlate to overwinter colony sizes (8–10).
Using the same dataset as Boyle et al. (6), we excluded moths (available in Dryad; doi:10.5061/dryad.2548jb4) and then examined patterns in monarch collection locations compared with all other butterflies (Fig. 1B). Even after confining the analysis to species' core range (green boundary in Fig. 1), we found overwhelming spatial and temporal bias in the specimen data. Half of all summer monarch records (51%) were accumulated in 2 restricted clusters in Minnesota and New England, with most specimens collected during a very limited number of years (Fig. 1B). We find no mid-20th–century peak in abundance when using the corrected data (Fig. 2). Note that with appropriate correction, the average number of observations per year is only 2.3 monarchs, with a median of 1 (Fig. 2C).
The spurious pattern presented in Boyle et al. (6) represents a cautionary tale in the use of opportunistic data to track population trends. Because of limited data availability and overwhelming spatiotemporal collection biases (Figs. 1B and 2), using digitized museum records to track monarch butterfly populations over the last century is currently not possible. We strongly support continued efforts to digitize butterfly specimens which may eventually provide the proper basis to explore long-term monarch population trends.
Footnotes
The authors declare no conflict of interest.
Data deposition: Data reported in this paper have been deposited in the Dryad Digital Repository database, datadryad.org/ (doi: 10.5061/dryad.2548jb4).
References
- 1.Soroye P., Ahmed N., Kerr J. T., Opportunistic citizen science data transform understanding of species distributions, phenology, and diversity gradients for global change research. Glob. Change Biol. 24, 5281–5291 (2018). [DOI] [PubMed] [Google Scholar]
- 2.Bartomeus I., et al. , Historical changes in northeastern US bee pollinators related to shared ecological traits. Proc. Natl. Acad. Sci. U.S.A. 110, 4656–4660 (2013). [DOI] [PMC free article] [PubMed] [Google Scholar]
- 3.Kramer-Schadt S., et al. , The importance of correcting for sampling bias in MaxEnt species distribution models. Divers. Distrib. 19, 1366–1379 (2013). [Google Scholar]
- 4.Dorazio R. M., Accounting for imperfect detection and survey bias in statistical analysis of presence‐only data. Glob. Ecol. Biogeogr. 12, 1472–1484 (2014). [Google Scholar]
- 5.Horns J. J., Adler F. R., Şekercioğlu Ç. H., Using opportunistic citizen science data to estimate avian population trends. Biol. Conserv. 221, 151–159 (2018). [Google Scholar]
- 6.Boyle J. H., Dalgleish H. J., Puzey J. R., Monarch butterfly and milkweed declines substantially predate the use of genetically modified crops. Proc. Natl. Acad. Sci. U.S.A. 116, 3006–3011 (2019). [DOI] [PMC free article] [PubMed] [Google Scholar]
- 7.Wepprich T., Monarch butterfly trends are sensitive to unexamined changes in museum collections over time. Proc. Natl. Acad. Sci. U.S.A. 116, 13742–13744 (2019). [DOI] [PMC free article] [PubMed] [Google Scholar]
- 8.Ries L., Rendon E., Taron D., The disconnect between summer and winter monarch trends for the eastern migratory population: Possible links to differing drivers. Ann. Entomol. Soc. Am. 108, 691–699 (2015). [Google Scholar]
- 9.Inamine H., Ellner S. P., Springer J. P., Agrawal A. A., Linking the continental migratory cycle of the monarch butterfly to understand its population decline. Oikos 125, 1081–1091 (2016). [Google Scholar]
- 10.Saunders S. P., et al. , Multiscale seasonal factors drive the size of winter monarch colonies. Proc. Natl. Acad. Sci. U.S.A. 116, 8609–8614 (2019). [DOI] [PMC free article] [PubMed] [Google Scholar]


