

Abstract
Prostate inflammation (PI) is closely related to the development and progression of chronic prostatic diseases: benign prostatic hyperplasia and prostate cancer. Toll-like receptor (TLR) 2 has been reported to be associated with inflammatory diseases, such as infections, autoimmune diseases, and cancers. Meanwhile, TLR10, which can form heterodimers with TLR2, has been considered an orphan receptor without an exact function. The present study therefore aims to examine the effects of TLR2 and TLR10 on PI. Prostate samples and clinical data were obtained from the patients diagnosed with benign prostatic hyperplasia. The inflammatory cell model was established by adding lipopolysaccharide to RWPE-1 cells. Prostate tissues/cells were examined by histological, molecular, and biochemical approaches. Both TLR2 and TLR10 were found to be expressed in prostate tissues and RWPE-1 cells. mRNA/protein expression levels of TLR2 and TLR10 were both positively correlated with prostate tissue inflammatory grades. Lipopolysaccharide-stimulated RWPE-1 cells expressed higher levels of TLR2, TLR10, high mobility group box 1 (HMGB1), phospho-nuclear factor kappa-light-chain-enhancer of activated B-cells P65 (phospho-NF-κB P65), interleukin (IL)-6, and IL-8 than control cells. Moreover, HMGB1, phospho-NF-κB P65, IL-6, and IL-8 were downregulated after TLR2 knockdown and upregulated after TLR10 knockdown in RWPE-1 cells. TLR2 stimulation can activate the inflammatory signaling cascade in prostate epithelial cells. Conversely, TLR10 exhibited suppressive effects on inflammation. With antagonistic functions, both TLR2 and TLR10 were involved in PI. TLR10 could be a novel target in modulating inflammatory signal transduction of prostate epithelial cells.
Keywords: benign prostatic hyperplasia, inflammation, Toll-like receptor 2 (TLR2), TLR10
INTRODUCTION
Toll-like receptors (TLRs), a group of pattern-recognition receptors essential in innate and adaptive immunity, can activate the inflammatory signaling pathways after being stimulated by ligands (such as pathogens and their metabolites) and induce the occurrence and persistence of inflammation.1 Accordingly, bacterial infections, urine reflux, dietary factors, hormones, and autoimmune responses have been considered to be pro-inflammatory factors in the prostate.2 Persistent inflammatory responses can lead to tissue damage and subsequent chronic tissue healing. Moreover, TLR overexpression could make prostate cell an antigen-presenting cell that can activate resident lymphocytes. Consequently, the inflammatory cascade, together with excessive growth factors, induces the development and progression of chronic prostatic diseases, such as benign prostatic hyperplasia (BPH) and prostate cancer (PCa).2,3
Most of the TLRs’ conserved function is to regulate the antimicrobial activity of epithelial cells, the first line of defense against microorganisms. The widely accepted hypothesis is that nonsterile sites (i.e., mouth, colon, or vagina) would require a response system different from that of sterile sites (bladder, kidney, prostate, and testis).4 Nonsterile sites might have less efficiently reactive epithelial cells than sterile sites where low levels of deleterious microorganisms could be rapidly detected and eliminated.3 Therefore, several researchers have conducted studies regarding regulatory function of TLRs on the prostatic epithelial/stromal cells, revealing their protective role during acute infections and, conversely, their negative role in favoring hyperplasia and/or cancer onset during chronic infections.3
Among TLRs, TLR2 has been found to be closely related to tissue damage, necrosis, and tumor cells. It has been regarded as an “alarm protein” involved in the regulation of microbial infection.5 The increase of TLR2 in the prostate epithelial cells was found after pathogen stimulation.6,7 Activation of TLR2 led to conduction of inflammatory signals (mitogen-activated protein kinases-p38/c-Jun N-terminal kinases/extracellular signal-regulated kinases [MAPKs-p38/JNK/ERK], nuclear factor kappa-light-chain-enhancer of activated B-cells [NF-κB], and Janus kinase 2/signal transducer and activator of transcription 3 [JAK2/STAT3]) and release of inflammatory cytokines (interleukin [IL]-1α, IL-1β, IL-6, IL-8, and IL-12α) and chemokines (chemokine [C-C motif] ligand [CCL] 20, CCL22, and IL-8).6,8,9 Moreover, TLR2 activation has been shown to promote cell proliferation and epithelial–mesenchymal transition.6 They were important factors in the pathogenesis of BPH. For PCa, both TLR2 and TLR10 were found be expressed in PCa cells (LNCaP, DU145, and PC3).9 Beyond cell proliferation, TLR2 activation could significantly upregulate the adhesion molecules (intercellular adhesion molecule 1 [ICAM-1] and vascular endothelial growth factor [VEGF]), which are involved in tumor progression and immune system evasion.8
TLR10, which forms heterodimers with TLR2, has been considered an orphan receptor given that its ligands and exact function have still been unknown.10 Current studies are controversial about whether activation of TLR10 results in promoting or inhibiting inflammatory signal transduction, and no study has explored the role of TLR10 in prostate inflammation. Moreover, our preexperiment found that TLR10 was expressed highly in human prostate epithelium that suggested an important role of TLR10 in the prostate epithelial cells. The present study therefore aimed to evaluate the effects of TLR2, especially TLR10 on prostate inflammation.
MATERIALS AND METHODS
Data and prostate tissue collection
After obtaining approval from the Ethics Committee, clinical data and prostate tissues were collected from 100 patients diagnosed with BPH who were scheduled for transurethral resection of the prostate with plasma kinetic energy from March to September 2015 at West China Hospital, Chengdu, China. During each surgery, two prostate tissue samples (without urothelium) were collected immediately after excision. After washing with sterile saline, one prostate chip was shredded, collected in a sterile tube, and stored in liquid nitrogen, whereas the other was formalin-fixed (Sigma-Aldrich Co., Ltd., St. Louis, MO, USA) and then paraffin-blocked (Leica Biosystems Inc., Buffalo Grove, IL, USA) for subsequent immunohistochemistry (IHC) and hematoxylin and eosin (H and E) staining. Specimens confirming cancer/dysplasia were excluded.
Inflammatory grades and protein expression intensities identification of prostate tissues
Prostatic inflammatory infiltrates were graded based on a histopathological classification system (Supplementary Table 1) using H and E staining.11 After being baked, deparaffinized, and rehydrated, prostate tissue sections were stained in hematoxylin (Proteintech Group Inc., Wuhan, China) and eosin-phloxine solution (Servicebio Co., Ltd., Wuhan, China). Then, sections were dehydrated and mounted with neutral glue (Solarbio Co., Ltd., Beijing, China).
Supplementary Table 1.
The proposed classification of prostatic inflammatory infiltrates1
| Feature | Details |
|---|---|
| Anatomical location | Histological pattern |
| Glandular | Inflammatory infiltrates lie within duct/gland epithelium and/or lumens |
| Periglandular | Inflammatory infiltrates lie within stroma, are centered around ducts/glands, and approach ducts/glands to within 50 µm |
| Stromal | Inflammatory cells lie within prostatic stroma but not centered on prostatic glands/ducts and lie ³50 µm from them |
| Extent | Tissue area involved by inflammatory cell infiltrate |
| Focal | <10% |
| Multifocal | 10%–50% |
| Diffuse | >50% |
| Grade | Morphological description (typical inflammatory cell density, cells mm−2) |
| 1/mild | Individual inflammatory cells, most of which are separated by distinct intervening spaces (<100) |
| 2/moderate | Confluent sheets of inflammatory cells with no tissue destruction or lymphoid nodule/follicle formation (100–500) |
| 3/severe | Confluent sheets of inflammatory cells with tissue destruction or nodule/follicle formation (>500) |
REFERENCE
1 Nickel JC, True LD, Krieger JN, Berger RE, Boag AH, et al. Consensus development of a histopathological classification system for chronic prostatic inflammation. BJU Int 2001; 87: 797–805.
The protein expression intensities were identified using IHC staining. After being deparaffinized, rehydrated, antigen retrieved, and blocked, prostate tissue sections were stained with primary antibodies: TLR2 (1:400; NB100-56720, Novus Biologicals Inc., Littleton, CO, USA), TLR10 (1:500; PA5-20054, Thermo Fisher Scientific Co., Ltd., Waltham, MA, USA), high mobility group box 1 (HMGB1; 1:2000; ab18256, Abcam Inc., Cambridge, MA, USA), and biotinylated secondary antibody: AffiniPure Goat anti-Rabbit IgG (Jackson ImmunoResearch Inc., West Grove, PA, USA). Then, sections were dehydrated and mounted with neutral glue. The mean depth of the brown color (three levels) under the microscope (Olympus, Tokyo, Japan) in four random quadrants was regarded as the intensity of relevant protein expression.
RWPE-1 cell culture, RNA interference, and lipopolysaccharides (LPS) stimulation
RWPE-1 cells were purchased from the American Type Culture Collection (ATCC, Manassas, VA, USA), incubated in the atmosphere of 95% air and 5% CO2 at 37°C, and cultured in Keratinocyte-SFM medium with bovine pituitary extract and human recombinant epidermal growth factor (Thermo Fisher Scientific Co., Ltd.).
Three different TLR2 and TLR10 small-interfering RNAs (siRNAs) were purchased from Ribobio Technologies Co., Ltd. (Guangzhou, China). The sequences of selected siRNAs were as follows: siTLR2 – ACTATCCACTGGTGAAACA and siTLR10 – CTAGGTCAATGCACACAAA. Healthy RWPE-1 cells were plated onto 12-well plates at a density of 1 × 10⁵ per well and cultured for 18 h until approximately 60% confluent. Thereafter, Lipofectamine 3000 (Thermo Fisher Scientific Co., Ltd.) and siRNAs were used for transfection (22 h) to obtain four types of cells: TLR2-knockdown cells (sT2), TLR10-knockdown cells (sT10), TLR2 and TLR10-knockdown cells (sT2/10), and negative control cells (NC) using nonrelated siRNAs provided by the manufacturer.
Cells were planted on 6-well plates (2 × 10⁵ per well) or 12-well plates (1 × 10⁵ per well) and cultured for 24 h until approximately 80% confluent. Thereafter, 2.5 μg ml−1 of LPS from Escherichia coli (E. coli) O55:B5 (Sigma-Aldrich Co., Ltd.) was added for 10-h stimulation.
TLR2 and TLR10 expression sites identification
Immunofluorescent (IF) staining was used to identify the sites of TLR2 and TLR10 expression in prostate tissues/cells. After being fixed, blocked, and permeabilizated (when needed), prostate tissue/cell sections were stained with primary antibodies: TLR2 (1:400 for tissue sections, NB100-56720, Novus Biologicals Inc.; 1:400 for cell sections, MA5-16200, Thermo Fisher Scientific Co., Ltd.) and TLR10 (1:500 for tissue sections and 1:1000 for cell sections; PA5-20054, Thermo Fisher Scientific Co., Ltd.). Next, sections were stained with fluorescent secondary antibodies: Alexa Fluor® 488 Donkey anti-Rabbit IgG (H + L) antibody (CA21206S, Thermo Fisher Scientific Co., Ltd.), Alexa Fluor® 594 Donkey anti-Mouse IgG (H + L) antibody (CA21203S, Thermo Fisher Scientific Co., Ltd.), and 4′6-diamidino-2-phenylindole (DAPI, Sigma-Aldrich Co., Ltd.). Then, sections were mounted with antifade mounting medium (Abcam Inc.).
Prostate tissues/cells RNAs expression testing
Prostate tissues (21 cases) with different inflammatory grades and RWPE-1 cells (on 12-well plates) with or without LPS stimulation were collected for quantitative real-time polymerase chain reaction (qRT-PCR). RNAs of tissues/cells were extracted with TRIzol (Thermo Fisher Scientific Co., Ltd.); cDNAs were synthesized using iScript cDNA Synthesis Kit (Bio-Rad, Hercules, CA, USA); after reverse transcription and dilution, primers were applied to PCR reactions. Primers used for qRT-PCR are listed in Supplementary Table 2.
Supplementary Table 2.
Primer sequences used for quantitative real-time polymerase chain reaction
| Gene | Primer sequences (5’ – 3’) | Length (bp) | |
|---|---|---|---|
| Forward | Reverse | ||
| TLR2 | GATGCCTACTGGGTGGAGAA | CGCAGCTCTCAGATTTACCC | 100 |
| TLR10 | TCTCCACTTTGATCTGCCCT | TGCGTGGAATCGGACATTTC | 115 |
| HMGB1 | AGAGCGGAGAGAGTGAGGAG | GATCTCCTTTGCCCATGTTT | 163 |
| IL-6 | CAAATTCGGTACATCCTCGAC | CTACGTTATTGGTGGGGACTG | 342 |
| IL-8 | ATGACTTCCAAGCTGGCCGTG | CTCTTCAAAAACTTCTCCCGACTCTTAAGTATT | 302 |
| PCNA | GACACATACCGCTGCGATCG | TCACCACAGCATCTCCAATAT | 307 |
qRT-PCR: quantitative real-time polymerase chain reaction; TLR: Toll-like receptor; HMGB1: high mobility group box 1; IL: interleukin; PCNA: proliferating cell nuclear antigen
Prostate tissues/cells proteins expression testing
Prostate tissues (8 cases) with different inflammatory grades and RWPE-1 cells (on 6-well plates) with or without LPS stimulation were collected for western blot testing. RIPA lyste solution was used to prepare cell/tissue lysates; protein concentration was measured with BCA Protein Assay Kit (Beyotime Biotechnology Co., Ltd., Haimen, China); after membrane transferring and blocking, primary antibodies were incubated: TLR2 (1:1000; 12276, Cell Signaling Technology Inc., Danvers, MA, USA), TLR10 (1:250; MAB6619, R&D Systems Inc., Minneapolis, MN, USA), phospho-NF-κB P65 (1:1000; 3033T, Cell Signaling Technology Inc.), and NF-κB P65 (1:1000; 8242T, Cell Signaling Technology Inc.); then, correspondent secondary antibodies were incubated and gels were detected with chemiluminescence.
Supernatants were collected for enzyme-linked immunosorbent assay (ELISA) testing. ELISA kits comprised human HMGB1 (bsk00390, BIOSS Co., Ltd., Beijing, China), human IL-6 (EHC007.96, NeoBioscience Technology Co., Ltd., Shenzhen, China), and human IL-8 (EHC008.96, NeoBioscience Technology Co., Ltd.). Manipulations were conducted following the instructions strictly.
Details regarding the test methods used herein were provided in the Supplementary Methods (56.4KB, pdf) .
Statistical analyses
All data were presented as mean ± standard deviation (s.d.) and analyzed using paired t-tests. Correlations among data were analyzed using Spearman's correlation analysis. The software used were SPSS version 22.0 (SPSS Inc., Chicago, IL, USA) and GraphPad Prism version 7.0 (GraphPad Software Inc., La Jolla, CA, USA). P < 0.05 was considered statistically significant.
RESULTS
TLR2 and TLR10 expression in prostate tissues and RWPE-1 cells
Prostate tissues without inflammation were used for IF staining (Figure 1). Both TLR2 and TLR10 were found to be expressed in human prostate tissue. Higher TLR2 expression was observed in prostate glandular epithelium than in stroma (according to fluorescence intensity). TLR10 was mostly expressed in glandular epithelium and slightly expressed in stroma. Moreover, IF staining revealed TLR2 and TLR10 co-expression on plasma membrane and in cytosol of RWPE-1 cells (Figure 2). Results regarding TLR2 and TLR10 expression in the prostate epithelial cells had been confirmed in both human prostate tissue and commercialized normal human prostate epithelial cell line.
Figure 1.
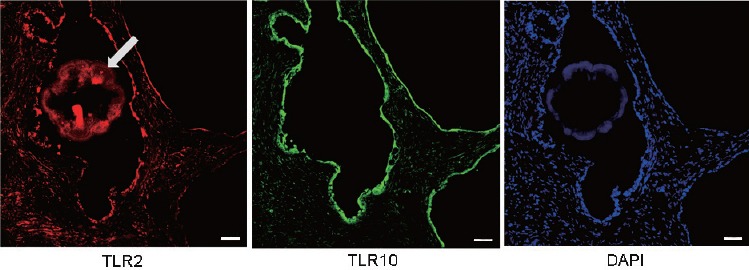
IF staining: the expression of TLR2 and TLR10 in prostate tissue. TLR2 and TLR10 were both found to be expressed in human prostate tissue. Higher TLR2 and TLR10 expressions were observed in prostate glandular epithelium than in stroma, especially TLR10. Scale bars = 50 mm. IF: immunofluorescence; TLR: Toll-like receptor; DAPI: 4’,6-diamidino-2-phenylindole. Arrow: an amyloid body in prostatic acinus cavity.
Figure 2.
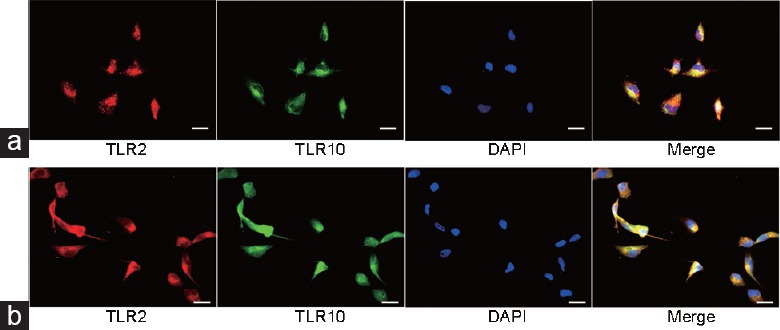
IF staining: the expression of TLR2 and TLR10 in RWPE-1 cells. (a) TLR2 and TLR10 were found to be co-expressed in granular form on plasma membrane of RWPE-1 cells (no Triton™ X-100 used: keep integrity of plasma membrane). (b) TLR2 and TLR10 were found to be co-expressed in cytosol of RWPE-1 cells (permeabilization with Triton™ X-100: plasma membrane was ruptured). Scale bars = 20 mm. IF: immunofluorescence; TLR: Toll-like receptor; DAPI: 4’,6-diamidino-2-phenylindole.
Correlation between TLR2/10 expression intensities and prostate tissue/cell inflammatory grades
Of 100 prostate samples, 10 had been excluded due to confirmation of cancer/dysplasia (five tissues) or low quality (five tissues). Baseline characteristics of the 90 patients enrolled were presented as mean ± s.d. Age: 68.41 ± 8.14 years; disease course: 4.29 ± 4.20 years; IPSS score: 24.22 ± 7.24; prostate volume: 63.74 ± 24.98 cm3; serum prostate-specific antigen (PSA) level: 5.66 ± 6.66 ng ml−1.
Under a phase contrast microscope, H and E-stained prostate tissues were classified into four inflammatory grades: null (3 cases), mild (57 cases), moderate (22 cases), and severe (8 cases) (Supplementary Figure 1 (125.9KB, tif) ). Details regarding the correlations between patients’ clinical features and prostate tissue inflammatory grades are presented in Supplementary Table 3, 4 and Supplementary Figure 2 (79.3KB, tif) , 3 (115.5KB, tif) .
Supplementary Table 3.
The correlation between prostate inflammatory grades and clinical features
| Inflammation (n) | A | B | C | D | E | F | G |
H 0,1,2 |
I No, yes |
J No, yes |
|---|---|---|---|---|---|---|---|---|---|---|
| Null (3) | 65.67±4.04 | 0.67±0.29 | 42.33±6.03 | - | 24.67±4.16 | - | 2.25±0.96 | 3,0,0 | 3,0 | 3,0 |
| Mile (57) | 68.09±8.30 | 4.15±4.49 | 57.94±21.50 | 0.63±1.08 | 23.95±6.72 | 331.5±1197 | 4.34±4.74 | 48,8,1 | 25,32 | 49,8 |
| Moderate (22) | 68.64±9.14 | 4.78±3.99 | 70.69±24.89 | 0.49±1.01 | 23.96±8.35 | 289.1±950.7 | 5.96±6.66 | 17,2,3 | 8,14 | 20,2 |
| Severe (8) | 71.13±4.73 | 5.31±2.94 | 94.04±26.29 | 1.51±1.51 | 26.75±9.10 | 1260±2435 | 14.57±11.09 | 5,2,1 | 4,4 | 5,3 |
| Ra | 0.103 | 0.221 | 0.379 | 0.121 | 0.127 | 0.023 | 0.298 | 0.183 | 0.097 | 0.095 |
| P | 0.333 | 0.036 | <0.001 | 0.255 | 0.233 | 0.830 | 0.006 | 0.084 | 0.365 | 0.371 |
aSpearman’s correlation coefficient. A: age (years); B: course of benign prostatic hyperplasia (years); C: prostate volume (cm3); D: length of intravesical prostatic protrusion (cm); E: IPSS score; F: WBC in urine (ul−1); G: PSA (ng ml−1); H: urinary retention (n); I: trabecular changes of bladder; J: bladder calculi or bladder diverticulum or hydrops of upper urinary tract; PSA: prostate-specific antigen; WBC: white blood cells; IPSS: International Prostate Symptom Score
Supplementary Table 4.
The correlation between clinical features
| A | A | |||||||||
| B | 0.039 | B | ||||||||
| C | 0.147 | 0.216* | C | |||||||
| D | −0.004 | 0.185 | 0.167 | D | ||||||
| E | 0.043 | 0.024 | 0.326** | 0.522*** | E | |||||
| F | −0.007 | −0.028 | −0.122 | −0.134 | −0.189 | F | ||||
| G | 0.134 | 0.021 | 0.073 | 0.104 | −0.111 | 0.056 | G | |||
| H | −0.008 | 0.087 | 0.155 | 0.224* | 0.253* | 0.078 | −0.021 | H | ||
| I | −0.033 | 0.013 | 0.006 | 0.023 | 0.064 | 0.084 | −0.104 | 0.097 | I | |
| J | 0.074 | 0.170 | 0.287** | 0.379*** | 0.194 | −0.049 | −0.009 | 0.395*** | 0.177 | J |
The values in the table are spearman correlation coefficients (R); *0.01<P<0.05; **0.001<P<0.01; ***P<0.001. A: age (years); B: course of benign prostatic hyperplasia (years); C: prostate volume (cm3); D: length of intravesical prostatic protrusion (cm); E: IPSS score; F: WBC in urine (ul−1); G: PSA (ng ml−1); H: urinary retention (n); I: trabecular changes of bladder; J: bladder calculi or bladder diverticulum or hydrops of upper urinary tract; PSA: prostate-specific antigen; WBC: white blood cells; IPSS: International Prostate Symptom Score
All included tissues (90 cases) underwent IHC staining. TLR2, TLR10, and HMGB1 were all found to be expressed in prostate epithelial and stromal cells (Figure 3). The expression intensities of TLR2 (Spearman's correlation coefficient [R] = 0.533; P < 0.001), TLR10 (R = 0.601; P < 0.001), and HMGB1 (R = 0.595; P < 0.001) were all positively correlated with prostate tissue inflammatory grades (Figure 3 and Table 1). A similar trend was found during both qRT-PCR (21 cases) and western blot testing (8 cases) (Figure 4). In addition, IL-6 and IL-8 mRNA expression and phospho-NF-κB P65 and P65 protein expression were all positively correlated with the severity of prostate tissue inflammatory grades (Figure 4).
Figure 3.
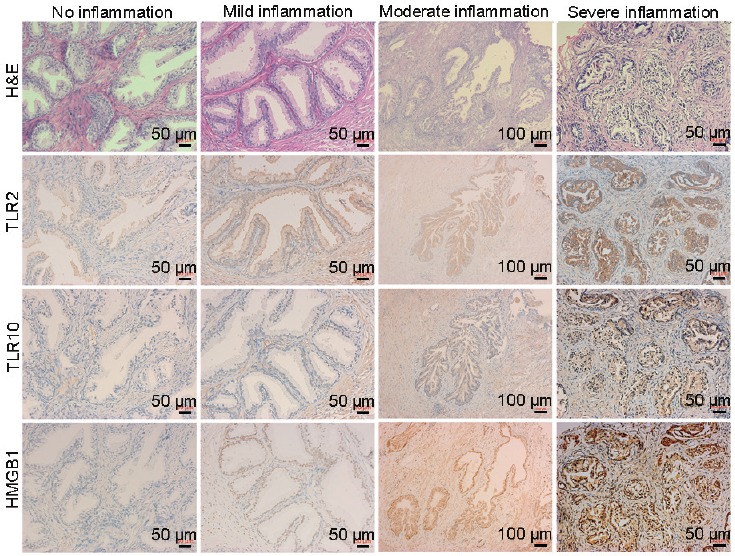
H and E and IHC staining: the expression of TLR2, TLR10, and HMGB1 in prostate tissues with different inflammatory grades. The expression levels of TLR2, TLR10, and HMGB1 were all positively correlated with prostate tissue inflammatory grades. Higher TLR2, TLR10, and HMGB1 expressions were observed in epithelium than in stroma. H and E: hematoxylin and eosin; IHC: immunohistochemistry; TLR: Toll-like receptor; HMGB1: high mobility group box 1.
Table 1.
Correlations of Toll-like receptor 2, Toll-like receptor 10, and high mobility group box 1 with prostate tissue inflammatory grades
| Proteins | Expression intensity | Inflammation of prostate tissues (n) | Correlation | ||||
|---|---|---|---|---|---|---|---|
| Null | Mild | Moderate | Severe | Ra | P | ||
| TLR2 | Light | 3 | 33 | 5 | 0 | ||
| Medium | 0 | 24 | 15 | 3 | 0.533 | <0.001 | |
| Heavy | 0 | 0 | 2 | 5 | |||
| TLR10 | Light | 3 | 39 | 6 | 0 | ||
| Medium | 0 | 18 | 12 | 1 | 0.601 | <0.001 | |
| Heavy | 0 | 0 | 4 | 7 | |||
| HMGB1 | Light | 3 | 35 | 4 | 0 | ||
| Medium | 0 | 22 | 13 | 3 | 0.595 | <0.001 | |
| Heavy | 0 | 0 | 5 | 5 | |||
aSpearman’s correlation coefficient. TLR: Toll-like receptor; HMGB1: high mobility group box 1
Figure 4.
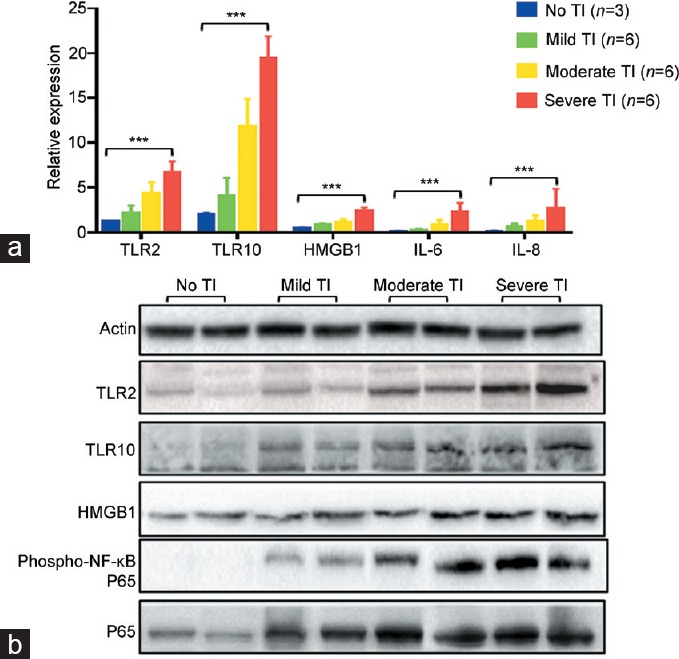
The correlations of mRNA/protein expressions with different inflammatory grades of tissues. (a) In qRT-PCR test, the mRNA expressions of TLR2 (R = 0.929, P < 0.001), TLR10 (R = 0.950, P < 0.001), HMGB1 (R = 0.932, P < 0.001), IL-6 (R = 0.889, P < 0.001), and IL-8 (R = 0.819, P < 0.001) were all positively correlated with prostate tissue inflammatory grades. ***P < 0.001. (b) In western blot test, the protein expressions of TLR2, TLR10, HMGB1, phospho-NF-κB P65, and P65 were all positively correlated with prostate tissue inflammatory grades. qRT-PCR: quantitative real-time polymerase chain reaction; TLR: Toll-like receptor; HMGB1: high mobility group box 1; IL: interleukin; phospho-NF-κB P65: phospho-nuclear factor kappa-light-chain-enhancer of activated B-cells P65; R: Spearman's correlation coefficient; TI: tissue inflammation.
RWPE-1 cells were stimulated for 10 h using 2.5 μg ml−1 of LPS. Compared to the blank group, the LPS group was found to have a higher mRNA expression of TLR2 (P = 0.003), TLR10 (P = 0.036), HMGB1 (P < 0.001), IL-6 (P = 0.001), and IL-8 (P = 0.002) (Figure 5a). Meanwhile, no significant difference in the expression of proliferating cell nuclear antigen (PCNA) mRNA had been observed (P = 0.085). After western blot analysis (Figure 5b), the LPS group was found to have a higher expression of TLR2, TLR10, and phospho-NF-κB P65 compared to the blank group. However, no difference in the expression of P65 had been found between LPS group and blank group. After detecting cytokines in the supernatants using ELISA (Figure 5c), we found that concentrations of HMGB1 (P = 0.006), IL-6 (P < 0.001), and IL-8 (P = 0.001) were higher in the LPS group than in the blank group.
Figure 5.
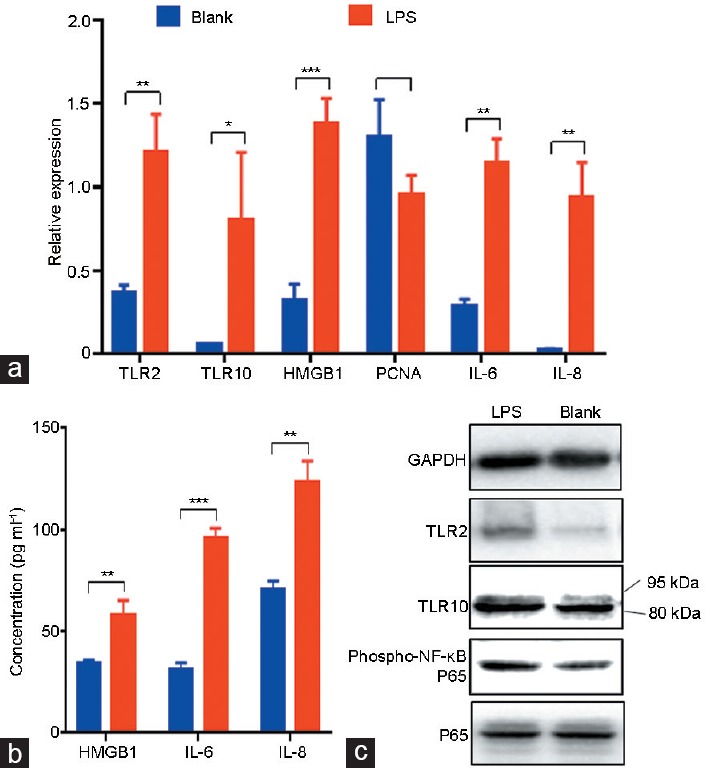
The expressions of TLR2, TLR10, HMGB1, PCNA, phospho-NF-κB P65, P65, IL-6, and IL-8 of RWPE-1 cells with/without inflammation. RWPE-1 cells were divided into two groups (LPS group and blank group) with three duplicate wells for each group. LPS (2.5 μg ml−1) was added to the LPS group for 10-h stimulation. (a) In qRT-PCR test, the mRNA expressions of RWPE-1 cells were (LPS group vs blank group): TLR2 (1.21 ± 0.23 vs 0.36 ± 0.05, P = 0.003), TLR10 (0.80 ± 0.41 vs 0.06 ± 0.01, P = 0.036), HMGB1 (1.38 ± 0.16 vs 0.32 ± 0.10, P < 0.001), PCNA (0.96 ± 0.12 vs 1.29 ± 0.23, P = 0.085), IL-6 (1.15 ± 0.14 vs 0.29 ± 0.04, P = 0.001), and IL-8 (0.94 ± 0.21 vs 0.02 ± 0.01, P = 0.002). (b) In western blot test, higher expression of TLR2, TLR10, and phospho-NF-κB P65 were found in LPS group than in blank group. *P < 0.05; **P < 0.01; ***P < 0.001. (c) In ELISA test, the concentration of cytokines in supernatant was (LPS group vs blank group): HMGB1 (57.62 ± 7.60 pg ml−1 vs 33.71 ± 1.93 pg ml−1, P = 0.006), IL-6 (95.93 ± 4.80 pg ml−1 vs 31.27 ± 2.91 pg ml−1, P < 0.001), and IL-8 (123.10 ± 10.41 pg ml−1 vs 70.08 ± 4.56 pg ml−1, P = 0.001). The results are shown as the mean ± standard deviation. qRT-PCR: quantitative real-time polymerase chain reaction; ELISA: enzyme-linked immunosorbent assay; TLR: Toll-like receptor; HMGB1: high mobility group box 1; PCNA: proliferating cell nuclear antigen; IL: interleukin; phospho-NF-κB P65: phospho-nuclear factor kappa-light-chain-enhancer of activated B-cells P65; LPS: lipopolysaccharides.
Antagonistic functions of TLR2 and TLR10 in the inflammation process
After validating three different types of TLR2 or TLR10 siRNAs, one of each siRNA type was selected (Supplementary Figure 4 (79.5KB, tif) and 5 (87.5KB, tif) ). Subsequently, three types of RWPE-1 cell groups (sT2, sT10, and sT2/10) were established along with the NC group (Supplementary Figure 6 (157.5KB, tif) ). Both two siRNAs achieved acceptable silencing efficiency according to qRT-PCR and western blot testing (Supplementary Figure 6 (157.5KB, tif) ).
After LPS stimulation, qRT-PCR detection revealed that compared to the NC group, the sT2 group had lower TLR2 (P = 0.001), TLR10 (P = 0.023), IL-6 (P < 0.001), and IL-8 (P < 0.001) mRNA expression; the sT10 group had lower TLR10 (P = 0.001) but higher TLR2 (P = 0.032), HMGB1 (P = 0.035), IL-6 (P < 0.001), and IL-8 (P = 0.018) mRNA expression; and the sT2/10 group had lower TLR2 (P = 0.005) and TLR10 (P = 0.001) but higher IL-6 (P = 0.008) and IL-8 (P = 0.007) mRNA expression. Meanwhile, no significant difference in PCNA mRNA had been observed among all groups (all P > 0.05) (Figure 6a).
Figure 6.
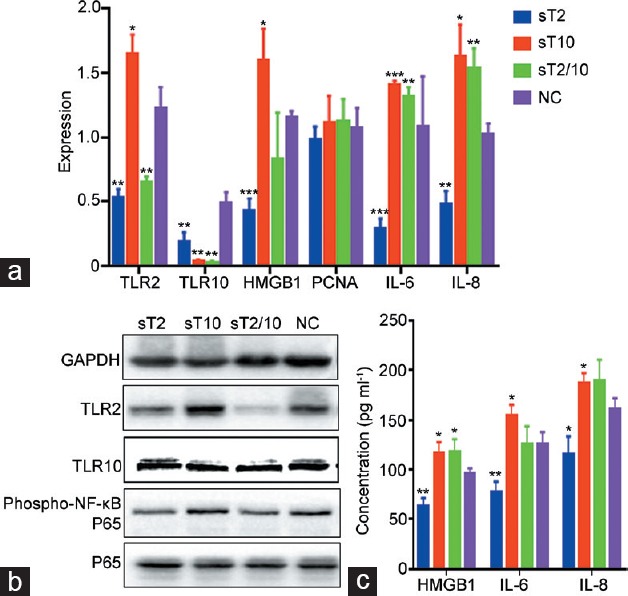
The expressions of TLR2, TLR10, HMGB1, PCNA, phospho-NF-κB P65, P65, IL-6, and IL-8 of RWPE-1 cells after RNA interference and LPS stimulation. RWPE-1 cells were divided into four groups according to different RNA interference methods: sT2 group (TLR2-knockdown), sT10 group (TLR10-knockdown), sT2/10 group (TLR2- and TLR10-knockdown), and NC group (negative control cells using nonrelated siRNA). Each siRNAs achieved acceptable efficacy. LPS (2.5 μg ml−1) was added to each group (with three duplicate wells) for 10-h stimulation. Compared with NC group: (a) in qRT-PCR test, the sT2 group had lower HMGB1, IL-6, and IL-8 mRNA expression; the sT10 group had higher HMGB1, IL-6, and IL-8 mRNA expression; the sT2/10 group had higher IL-6 and IL-8 mRNA expression; no significant difference in PCNA mRNA had been observed among all groups; (b) in western blot test, the sT2 group had lower expression of phospho-NF-κB P65; the sT10 group had no difference expression of phospho-NF-κB P65; the sT2/10 group had lower expression of phospho-NF-κB P65; no difference in P65 expression had been observed among all groups; (c) in ELISA test, the sT2 group had lower supernatant concentrations of HMGB1, IL-6, and IL-8; the sT10 group had higher supernatant concentrations of HMGB1, IL-6, and IL-8; the sT2/10 group had higher supernatant concentration of HMGB1 but no significant differences in concentrations of IL-6 and IL-8. *P < 0.05; **P < 0.01; ***P < 0.001. qRT-PCR: quantitative real-time polymerase chain reaction; ELISA: enzyme-linked immunosorbent assay; TLR: Toll-like receptor; HMGB1: high mobility group box 1; PCNA: proliferating cell nuclear antigen; IL: interleukin; phospho-NF-κB P65: phospho-nuclear factor kappa-light-chain-enhancer of activated B-cells P65; LPS: lipopolysaccharides.
Western blot testing showed that compared to the NC group, the sT2 group had lower expression of TLR2 and phospho-NF-κB P65 with no difference in the expression of TLR10 and P65; the sT10 group had lower expression of TLR10, mild higher expression of TLR2, but no difference expression of phospho-NF-κB P65 and P65; and the sT2/10 group had lower expression of TLR2, TLR10, and phospho-NF-κB P65 but no difference in the expression of P65 (Figure 6b).
ELISA testing revealed that compared to the NC group, the sT2 group had lower supernatant concentrations of HMGB1 (P = 0.006), IL-6 (P = 0.006), and IL-8 (P = 0.020); the sT10 group showed higher supernatant concentrations of HMGB1 (P = 0.040), IL-6 (P = 0.040), and IL-8 (P = 0.037); and the sT2/10 group had higher supernatant concentration of HMGB1 (P = 0.043) but no significant differences in concentrations of IL-6 (P = 0.925) and IL-8 (P = 0.862) (Figure 6c).
DISCUSSION
TLRs are an important class of pattern-recognition receptors that are essential for an organism's immunity. They can be stimulated by different pathogens or their metabolites to recruit specific adapter proteins, activate a series of signal cascades, and induce cell proliferation and specific immune responses, such as inflammation.1,3
All TLRs have been reported to be expressed by human BPH stromal cells.12 Moreover, although some studies confirmed the expression of TLR2 in human prostate epithelial cell line,7,13 no study reported on the expression of TLR10 in prostate epithelial cells. Through IF, IHC, western blot, and qRT-PCR, the present study found that prostate tissues expressed TLR2 and TLR10 in both epithelial and stromal cells and that TLR2 and TLR10 were co-expressed on plasma membrane and in cytosol of prostate epithelial cells (RWPE-1). In addition, TLR10 expressed in the RWPE-1 cells consisted predominantly of its isoform type (approximately 80 kDa during western blot testing, Figure 4b, 5b, and 6b).
Through multiple detection methods, we confirmed that the expression of both TLR2 and TLR10 was positively correlated with inflammation of either prostate tissues or RWPE-1 cells. This finding is consistent with the results from other new studies on various kinds of tissues. In the research of Nagashima et al.,14 microarray analysis of gastric biopsy specimens from Helicobacter pylori (H. pylori)-positive and uninfected subjects showed that TLR2, TLR4, and TLR6–10 were upregulated >2-fold in infected subjects. They then used H. pylori to infect NCI-87 gastric epithelial cells for 24 h and found increases in TLR1, TLR2, TLR6, and TLR10 mRNA levels. Similarly, Peng et al.15 found that TLR2, TLR3, and TLR9 expression and activation were elevated in peripheral blood mononuclear cells (PBMCs) of patients with autoimmune thyroid disease. As far as the current studies and our findings are concerned, the expression of all TLRs should undoubtedly increase with inflammatory grades. Moreover, several clinical features of patients included in the present study, such as duration of BPH (R = 0.221; P = 0.036), prostate volume (R = 0.379; P < 0.001), and serum PSA values (R = 0.298; P = 0.006), were found to be positively correlated with prostate tissue inflammatory grades (Supplementary Table 3 and Supplementary Figure 2 (79.3KB, tif) ). These findings suggest important roles of TLRs in the incidence of prostatic inflammatory-related diseases.
It is well accepted that TLR2 activation could initiate inflammatory signaling pathways. For prostate cells, Kim et al.8 utilized lipoteichoic acid to stimulate RWPE-1 cells. Besides TLR2 and MAPK-p38/NF-κB activation, they also found the expression of cytokines (IL-1α, IL-1β, IL-6, and IL-12α) and chemokines (CCL20, CCL22, and IL-8); Sellami et al.7 found that PC-3 cells elicited a pro-inflammatory response 24 h after being infected with Chlamydia trachomatis as evidenced by NF-κB activation, TLR2 and TLR4 upregulation, and increased expression of inflammation-related genes (VEGF, ICAM-1, IL-6, IL-8, IL-1β, tumor necrosis factor-α[TNF-α], CCL5, CCL2, and inducible nitric oxide synthase). Similarly, we found that RWPE-1 cells expressed higher levels of TLR2, TLR10, HMGB1, phospho-NF-κB P65, IL-6, and IL-8 mRNAs and/or proteins with than without LPS stimulation and lower levels of the same RNAs and/or proteins with than without TLR2 knockdown using the corresponding siRNA (Figure 6a and 6b). However, HMGB1, IL-6, and IL-8 secretions were significantly higher in TLR10-knockdown cells than in control cells (Figure 6c). Our findings reconfirmed the pro-inflammatory effects of TLR2 and revealed the inhibitory properties of TLR10 in the prostate epithelial cells.
In the preceding years, TLR10 had been regarded as the only pattern-recognition receptor without known ligand specificity and biological function.10 However, recently published studies tended to consider TLR10 as an anti-inflammatory pattern-recognition receptor.10,16,17,18,19 Accordingly, Oosting et al.10 had conducted a systematic study to determine, for the first time, whether TLR10 had anti-inflammatory functions. In their study, pam3CSK4 (TLR2-specific artificial ligand) was used to stimulate PBMCs and the increased secretions of IL-6, IL-8, TNF-α, and IL-1β were detected accordingly. After adding a specific antibody to antagonize TLR10, a further increase in the secretion of the aforementioned cytokines was observed. However, this phenomenon did not appear in PBMCs stimulated by the TLR4 ligand. They subsequently found that TLR10 overexpression inhibited TLR2-mediated signaling in HEK293 cells and silenced RNA of TLR10 resulted in enhanced cytokine production. After in vivo challenging with pam3CSK4, human TLR10 transgenic mice showed less inflammation compared to wild-type mice. Thus, they confirmed that TLR10 acts primarily as an inhibitory receptor for TLR2 ligands. More recently, Tapping's team published a series of studies revealing the anti-inflammatory function of TLR10 from multiple aspects.16,17,18,19 Their earlier study found that TLR10, alone or in cooperation with TLR2, failed to activate typical TLR-induced signaling.16 However, in their recent studies, they constructed a monocytic cell line and a transgenic mouse model stably transfected with TLR10.17,18,19 Using a functional TLR10 monoclonal antibody, they reported that TLR10 had a broad suppressive activity, which can affect both MyD88 and TRIF inducing interferon (IFN)-β mediated signaling pathways.19 Meanwhile, they found that antibody-mediated engagement of TLR10 in primary human B-cells suppressed B-cell proliferation, cytokine production, and signal transduction. When challenged with either T-independent or -dependent antigen, TLR10 transgenic mice exhibited diminished antibody responses.17 Moreover, TLR10-differentiated dendritic cells exhibited a decreased capacity to activate T-cells as measured by IL-2 and IFN-γ production.18 These studies revealed the inhibitory effect of TLR10 on inflammation of immune and nonimmune cells.
The present research is the first study to reveal the anti-inflammatory function of TLR10 in RWPE-1 cells, highlighting the importance of TLR10 in the prostate inflammatory process. Although both TLR2 and TLR10 were positive correlated with inflammation of tissues/cells, they showed antagonistic functions. For this contradiction, we inferred that TLR10, as an auxiliary receptor, might promote TLR2 to recognize pathogens. Unlike stromal cells, epithelial cells of acinus are the first line to contact with substances in the acinar cavity directly, such as prostatic secretions (containing proteolytic enzymes, prostatic acid phosphatase, beta-microseminoprotein, PSA, and zinc), amyloid bodies, and foreign pathogens. Epithelial cells could work as antigen-presenting cells that can activate resident lymphocytes. TLR10 expressed in the epithelial cells could act as an inhibitor to avoid TLR2 being activated by normal prostatic secretions but maintain favorable susceptivity to pathogens. Moreover, phylogenetic analysis reveals that TLR10 can form heterodimer with TLR2 to participate in the process of pathogens recognition.16 Besides, upregulation of TLR10 with increased inflammation could avoid excessive inflammatory response and promote pathogens recognition probably, that is, conducive to the immune regulation. The association between single-nucleotide polymorphisms in TLR10 and the incidence of PCa20 or inflammatory disease10 could be a corroborative evidence of this inference. If so, TLR10 knockdown might result in more susceptibility of TLR2 to nonpathogenic antigens, such as inflammatory cytokines.
Although the inhibitory properties of TLR10 we found were consistent with those of Oosting et al.10 and Hess et al.17,18 and Jiang et al.,19 caution should be kept when referencing such results due to the existence of equally important studies with opposing findings. Nagashima et al.14 reported that, among the other TLR2 subfamily heterodimers, the TLR2/TLR10 heterodimer best mediated NF-κB activation following exposure to heat-killed H. pylori or H. pylori LPS. Regan et al.21 performed an RNA interference screen of TLRs 1–10 in the HT-29 cell line and found that the most significant reduction in chemokine output occurred following TLR10 silencing. This effect was also observed in the macrophage cell line THP-1 wherein chemokines CCL20, CCL1, and IL-8 were reduced following TLR10 knockdown. Lee et al.22 found that influenza virus infection increased TLR10 expression of human macrophages and monocytes, leading to cytokine induction, including pro-inflammatory cytokines and interferons. Short hairpin RNA-mediated silencing of TLR10 in THP-1 cells resulted in decreased IL-8, IL-6, and IFN-β mRNA expression and IL-8 excretion. Therefore, further studies are needed to confirm the function of TLR10 and the signal pathways involved.
CONCLUSIONS
Our findings indicate that both TLR2 and TLR10 are involved in the prostate tissue/epithelial cell inflammatory process. TLR2 stimulation in prostate epithelial cells resulted in the activation of the inflammatory signaling cascade. Moreover, TLR10 exhibited a suppressive effect on prostate epithelial cell inflammation. Besides TLR2, TLR10 could be a novel target in modulating inflammatory signal transduction of prostate epithelial cells.
AUTHOR CONTRIBUTIONS
QW and TL conceived of the study and participated in its design and funds collection. YF and LY participated in its design and coordination. PT and SQ collected patients’ data and prostate tissues. YD and DG carried out the prostate tissues testing. YF, LY, and ZT carried out the cells testing. YF and LY participated in data interpretation, statistical analysis and helped to draft the manuscript. All authors read and approved the final manuscript.
COMPETING INTERESTS
All authors declare no competing interests.
Supplementary Methods
H and E staining: prostate tissues with different inflammatory grades.
The correlation between prostate inflammatory grades and clinical features. The clinical features of patients which were positively correlated with prostate tissue inflammatory grades were: course of benign prostatic hyperplasia (R = 0.221, P = 0.036), prostate volume (R = 0.379, P < 0.001) and serum PSA values (R = 0.298, P = 0.006). A: age (years); B: course of benign prostatic hyperplasia (years); C: prostate volume (cm3); D: length of intravesical prostatic protrusion (cm); E: IPSS score; F: WBC in urine (ul−1); G: PSA (ng ml−1); H: urinary retention (N); I: trabecular changes of bladder; J: bladder calculi or bladder diverticulum or hydrops of upper urinary tract; R: Spearman's correlation coefficient.
The correlation between clinical features. A: age (years); B: course of benign prostatic hyperplasia (years); C: prostate volume (cm3); D: length of intravesical prostatic protrusion (cm); E: IPSS score; F: WBC in urine (ul−1); G: PSA (ng ml−1); H: urinary retention (N); I: trabecular changes of bladder; J: bladder calculi or bladder diverticulum or hydrops of upper urinary tract. (Blue line: two clinical features connected by blue line have no statistical correlation, P > 0.05; Rad line: two clinical features connected by rad line have statistical correlation, P ≤ 0.05).
IF staining: Transfection of RWPE-1 cells. The transfection efficiency was more than 90%. IF: immunofluorescence; Red: fluorescent probe.
qRT-PCR: The mRNA expressions of TLR2 and TLR10 after different siRNAs interference. When TLR2 or TLR10 mRNA expression levels of RWPE-1 cells interfered by nonrelated siRNA were set to 1, the TLR2 mRNA expressions of RWPE-1 cells interfered by siTLR2-1, siTLR2-2 and siTLR2-3 were 1.20 ± 0.36, 0.52 ± 0.04 and 1.05 ± 0.28, respectively; the TLR10 mRNA expressions of RWPE-1 cells interfered by siTLR10-1, siTLR10-2 and siTLR10-3 were 0.21 ± 0.16, 0.01 ± 0.01 and 0.03 ± 0.15, respectively. Therefore, siTLR2-2 and siTLR10-2 were selected for the following procedures. The results are shown as the mean ± s.d. qRT-PCR: quantitative real-time polymerase chain reaction; TLR: Toll-like receptor; s.d.: standard deviation. (siRNA sequence: siTLR2-1, GATTGATGCTTCAGATCTA; siTLR2-2, ACTATCCACTGGTGAAACA; siTLR2-3, TTGATTGGCCAGCAAATTA; siTLR10-1, GCAACGAAATCTTAGTTTA; siTLR10-2, CTAGGTCAATGCACACAAA; siTLR10-3, CGGTGTACCTGTGAATTAA).
The TLR2 and TLR10 expressions after siTLR2-2, siTLR10-2 and nonrelated siRNA interference. Four kinds of RWPE-1 cell groups were establish: sT2: RWPE-1 cells interfered by siTLR2-2; sT10: RWPE-1 cells interfered by siTLR10-2; sT2/10: RWPE-1 cells interfered by siTLR2-2 and siTLR10-2; NC: RWPE-1 cells interfered by nonrelated siRNA. (a) In qRT-PCR test, the TLR2 mRNA expressions of sT2, sT10 and sT2/10 groups versus NC group were: 0.09 ± 0.02, 0.19 ± 0.03 and 0.10 ± 0.01 versus 0.18 ± 0.02; the TLR10 mRNA expressions of sT2, sT10 and sT2/10 groups versus NC group were: 0.04 ± 0.02, 0.01 ± 0.001 and 0.01 ± 0.003 versus 0.04 ± 0.02. (b) In Western blot test, sT2 and sT2/10 group expressed less TLR2 than NC group obviously; sT10 and sT2/10 group expressed less TLR10 (at 95kDa) than NC group obviously. The results are shown as the mean ± s.d. qRT-PCR: quantitative real-time polymerase chain reaction; TLR: Toll-like receptor; s.d.: standard deviation.
ACKNOWLEDGMENTS
This study was funded by the National Key Research and Development Program of China (Grant No. SQ2017YFSF090096), National Natural Science Foundation of China (Grant No. 81370855, 81770756 and 81300627), Foundation of Science and Technology Department of Sichuan Province (Grant No. 2013SZ0006, 2015SZ0230, 2018JY0089 and 2017HH0063), 1.3.5 Project for Disciplines of Excellence, West China Hospital, Sichuan University (Grant No. ZY2016104), Youth Researcher Funding of Sichuan University (Grant No. 2017SCU11042 and 2017SCU04A17), and Research Funding of Sichuan Health and Family Planning Commission (Grant No. 17PJ159, 18PJ434 and 18PJ453). The funders had no role in study design, data collection and analysis, decision to publish, or preparation of the manuscript.
Supplementary Information is linked to the online version of the paper on the Asian Journal of Andrology website.
REFERENCES
- 1.Könner AC, Bruning JC. Toll-like receptors: linking inflammation to metabolism. Trends Endocrinol Metab. 2011;22:16–23. doi: 10.1016/j.tem.2010.08.007. [DOI] [PubMed] [Google Scholar]
- 2.De Nunzio C, Kramer G, Marberger M, Montironi R, Nelson W, et al. The controversial relationship between benign prostatic hyperplasia and prostate cancer: the role of inflammation. Eur Urol. 2011;60:106–17. doi: 10.1016/j.eururo.2011.03.055. [DOI] [PubMed] [Google Scholar]
- 3.Gambara G, De Cesaris P, De Nunzio C, Ziparo E, Tubaro A, et al. Toll-like receptors in prostate infection and cancer between bench and bedside. J Cell Mol Med. 2013;17:713–22. doi: 10.1111/jcmm.12055. [DOI] [PMC free article] [PubMed] [Google Scholar]
- 4.Sutcliffe S, Platz EA. Inflammation and prostate cancer: a focus on infections. Curr Urol Rep. 2008;9:243–9. doi: 10.1007/s11934-008-0042-z. [DOI] [PubMed] [Google Scholar]
- 5.Oliveira-Nascimento L, Massari P, Wetzler LM. The role of TLR2 in infection and immunity. Front Immunol. 2012;3:79. doi: 10.3389/fimmu.2012.00079. [DOI] [PMC free article] [PubMed] [Google Scholar]
- 6.Han IH, Kim JH, Kim SS, Ahn MH, Ryu JS. Signalling pathways associated with IL-6 production and epithelial-mesenchymal transition induction in prostate epithelial cells stimulated with Trichomonas vaginalis. Parasite Immunol. 2016;38:678–87. doi: 10.1111/pim.12357. [DOI] [PubMed] [Google Scholar]
- 7.Sellami H, Said-Sadier N, Znazen A, Gdoura R, Ojcius DM, et al. Chlamydia trachomatis infection increases the expression of inflammatory tumorigenic cytokines and chemokines as well as components of the Toll-like receptor and NF-kappaB pathways in human prostate epithelial cells. Mol Cell Probes. 2014;28:147–54. doi: 10.1016/j.mcp.2014.01.006. [DOI] [PubMed] [Google Scholar]
- 8.Kim JH, Kim KH, Kim HJ, Lee J, Myung SC. Expression of beta-defensin 131 promotes an innate immune response in human prostate epithelial cells. PLoS One. 2015;10:e0144776. doi: 10.1371/journal.pone.0144776. [DOI] [PMC free article] [PubMed] [Google Scholar]
- 9.Rezania S, Amirmozaffari N, Rashidi N, Mirzadegan E, Zarei S, et al. The same and not the same: heterogeneous functional activation of prostate tumor cells by TLR ligation. Cancer Cell Int. 2014;14:54. doi: 10.1186/1475-2867-14-54. [DOI] [PMC free article] [PubMed] [Google Scholar]
- 10.Oosting M, Cheng SC, Bolscher JM, Vestering-Stenger R, Plantinga TS, et al. Human TLR10 is an anti-inflammatory pattern-recognition receptor. Proc Natl Acad Sci U S A. 2014;111:E4478–84. doi: 10.1073/pnas.1410293111. [DOI] [PMC free article] [PubMed] [Google Scholar]
- 11.Nickel JC, True LD, Krieger JN, Berger RE, Boag AH, et al. Consensus development of a histopathological classification system for chronic prostatic inflammation. BJU Int. 2001;87:797–805. doi: 10.1046/j.1464-410x.2001.02193.x. [DOI] [PubMed] [Google Scholar]
- 12.Penna G, Fibbi B, Amuchastegui S, Cossetti C, Aquilano F, et al. Human benign prostatic hyperplasia stromal cells as inducers and targets of chronic immuno-mediated inflammation. J Immunol. 2009;182:4056–64. doi: 10.4049/jimmunol.0801875. [DOI] [PubMed] [Google Scholar]
- 13.Mackern-Oberti JP, Motrich RD, Breser ML, Sanchez LR, Cuffini C, et al. Chlamydia trachomatis infection of the male genital tract: an update. J Reprod Immunol. 2013;100:37–53. doi: 10.1016/j.jri.2013.05.002. [DOI] [PubMed] [Google Scholar]
- 14.Nagashima H, Iwatani S, Cruz M, Jimenez Abreu JA, Uchida T, et al. Toll-like receptor 10 in Helicobacter pylori infection. J Infect Dis. 2015;212:1666–76. doi: 10.1093/infdis/jiv270. [DOI] [PMC free article] [PubMed] [Google Scholar]
- 15.Peng S, Li C, Wang X, Liu X, Han C, et al. Increased Toll-like receptors activity and TLR ligands in patients with autoimmune thyroid diseases. Front Immunol. 2016;7:578. doi: 10.3389/fimmu.2016.00578. [DOI] [PMC free article] [PubMed] [Google Scholar]
- 16.Guan Y, Ranoa DR, Jiang S, Mutha SK, Li X, et al. Human TLRs 10 and 1 share common mechanisms of innate immune sensing but not signaling. J Immunol. 2010;184:5094–103. doi: 10.4049/jimmunol.0901888. [DOI] [PubMed] [Google Scholar]
- 17.Hess NJ, Jiang S, Li X, Guan Y, Tapping RI. TLR10 is a B cell intrinsic suppressor of adaptive immune responses. J Immunol. 2017;198:699–707. doi: 10.4049/jimmunol.1601335. [DOI] [PMC free article] [PubMed] [Google Scholar]
- 18.Hess NJ, Felicelli C, Grage J, Tapping RI. TLR10 suppresses the activation and differentiation of monocytes with effects on DC-mediated adaptive immune responses. J Leukoc Biol. 2017;101:1245–52. doi: 10.1189/jlb.3A1116-492R. [DOI] [PMC free article] [PubMed] [Google Scholar]
- 19.Jiang S, Li X, Hess NJ, Guan Y, Tapping RI. TLR10 is a negative regulator of both MyD88-dependent and -independent TLR signaling. J Immunol. 2016;196:3834–41. doi: 10.4049/jimmunol.1502599. [DOI] [PMC free article] [PubMed] [Google Scholar]
- 20.Stevens VL, Hsing AW, Talbot JT, Zheng SL, Sun J, et al. Genetic variation in the Toll-like receptor gene cluster (TLR10-TLR1-TLR6) and prostate cancer risk. Int J Cancer. 2008;123:2644–50. doi: 10.1002/ijc.23826. [DOI] [PubMed] [Google Scholar]
- 21.Regan T, Nally K, Carmody R, Houston A, Shanahan F, et al. Identification of TLR10 as a key mediator of the inflammatory response to Listeria monocytogenes in intestinal epithelial cells and macrophages. J Immunol. 2013;191:6084–92. doi: 10.4049/jimmunol.1203245. [DOI] [PubMed] [Google Scholar]
- 22.Lee SM, Kok KH, Jaume M, Cheung TK, Yip TF, et al. Toll-like receptor 10 is involved in induction of innate immune responses to influenza virus infection. Proc Natl Acad Sci U S A. 2014;111:3793–8. doi: 10.1073/pnas.1324266111. [DOI] [PMC free article] [PubMed] [Google Scholar]
Associated Data
This section collects any data citations, data availability statements, or supplementary materials included in this article.
Supplementary Materials
Supplementary Methods
H and E staining: prostate tissues with different inflammatory grades.
The correlation between prostate inflammatory grades and clinical features. The clinical features of patients which were positively correlated with prostate tissue inflammatory grades were: course of benign prostatic hyperplasia (R = 0.221, P = 0.036), prostate volume (R = 0.379, P < 0.001) and serum PSA values (R = 0.298, P = 0.006). A: age (years); B: course of benign prostatic hyperplasia (years); C: prostate volume (cm3); D: length of intravesical prostatic protrusion (cm); E: IPSS score; F: WBC in urine (ul−1); G: PSA (ng ml−1); H: urinary retention (N); I: trabecular changes of bladder; J: bladder calculi or bladder diverticulum or hydrops of upper urinary tract; R: Spearman's correlation coefficient.
The correlation between clinical features. A: age (years); B: course of benign prostatic hyperplasia (years); C: prostate volume (cm3); D: length of intravesical prostatic protrusion (cm); E: IPSS score; F: WBC in urine (ul−1); G: PSA (ng ml−1); H: urinary retention (N); I: trabecular changes of bladder; J: bladder calculi or bladder diverticulum or hydrops of upper urinary tract. (Blue line: two clinical features connected by blue line have no statistical correlation, P > 0.05; Rad line: two clinical features connected by rad line have statistical correlation, P ≤ 0.05).
IF staining: Transfection of RWPE-1 cells. The transfection efficiency was more than 90%. IF: immunofluorescence; Red: fluorescent probe.
qRT-PCR: The mRNA expressions of TLR2 and TLR10 after different siRNAs interference. When TLR2 or TLR10 mRNA expression levels of RWPE-1 cells interfered by nonrelated siRNA were set to 1, the TLR2 mRNA expressions of RWPE-1 cells interfered by siTLR2-1, siTLR2-2 and siTLR2-3 were 1.20 ± 0.36, 0.52 ± 0.04 and 1.05 ± 0.28, respectively; the TLR10 mRNA expressions of RWPE-1 cells interfered by siTLR10-1, siTLR10-2 and siTLR10-3 were 0.21 ± 0.16, 0.01 ± 0.01 and 0.03 ± 0.15, respectively. Therefore, siTLR2-2 and siTLR10-2 were selected for the following procedures. The results are shown as the mean ± s.d. qRT-PCR: quantitative real-time polymerase chain reaction; TLR: Toll-like receptor; s.d.: standard deviation. (siRNA sequence: siTLR2-1, GATTGATGCTTCAGATCTA; siTLR2-2, ACTATCCACTGGTGAAACA; siTLR2-3, TTGATTGGCCAGCAAATTA; siTLR10-1, GCAACGAAATCTTAGTTTA; siTLR10-2, CTAGGTCAATGCACACAAA; siTLR10-3, CGGTGTACCTGTGAATTAA).
The TLR2 and TLR10 expressions after siTLR2-2, siTLR10-2 and nonrelated siRNA interference. Four kinds of RWPE-1 cell groups were establish: sT2: RWPE-1 cells interfered by siTLR2-2; sT10: RWPE-1 cells interfered by siTLR10-2; sT2/10: RWPE-1 cells interfered by siTLR2-2 and siTLR10-2; NC: RWPE-1 cells interfered by nonrelated siRNA. (a) In qRT-PCR test, the TLR2 mRNA expressions of sT2, sT10 and sT2/10 groups versus NC group were: 0.09 ± 0.02, 0.19 ± 0.03 and 0.10 ± 0.01 versus 0.18 ± 0.02; the TLR10 mRNA expressions of sT2, sT10 and sT2/10 groups versus NC group were: 0.04 ± 0.02, 0.01 ± 0.001 and 0.01 ± 0.003 versus 0.04 ± 0.02. (b) In Western blot test, sT2 and sT2/10 group expressed less TLR2 than NC group obviously; sT10 and sT2/10 group expressed less TLR10 (at 95kDa) than NC group obviously. The results are shown as the mean ± s.d. qRT-PCR: quantitative real-time polymerase chain reaction; TLR: Toll-like receptor; s.d.: standard deviation.