

SUMMARY
Dysregulation of chromatin methylation is associated with defects in cellular differentiation as well as a variety of cancers. How cells regulate the opposing activities of histone methyltransferase and demethylase enzymes to set the methylation status of the epigenome for proper control of gene expression and metabolism remains poorly understood. Here, we show that loss of methylation of the major phosphatase PP2A in response to methionine starvation activates the demethylation of histones through hyperphosphorylation of specific demethylase enzymes. In parallel, this regulatory mechanism enables cells to preserve SAM by increasing SAH to limit SAM consumption by methyltransferase enzymes. Mutants lacking the PP2A methyltransferase or the effector H3K36 demethylase Rph1 exhibit elevated SAM levels and are dependent on cysteine due to reduced capacity to sink the methyl groups of SAM. Therefore, PP2A directs the methylation status of histones by regulating the phosphorylation status of histone demethylase enzymes in response to SAM levels.
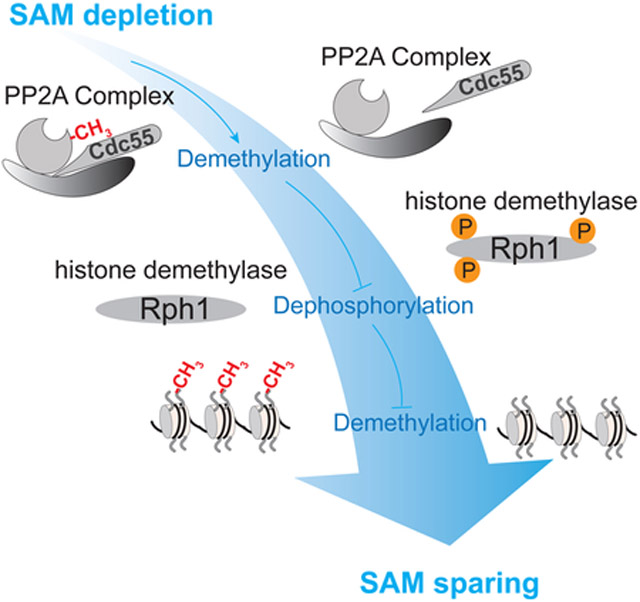
Graphical Abstract
eTOC blurb
Ye et al. demonstrate that demethylation of PP2A in response to methionine starvation activates histone demethylation by increasing phosphorylation and chromatin binding of demethylase enzymes, which prepares the histones for remethylation that fuels cysteine synthesis. This regulatory mechanism also enables cells to preserve SAM by increasing SAH to limit SAM consumption by methyltransferases.
INTRODUCTION
The methylation of histones has been implicated in the regulation of gene expression (Berger, 2007; Jenuwein and Allis, 2001). Methylation of H3K9 and H3K27 are repressive marks often found in heterochromatic regions (Rice and Allis, 2001; Zhang and Reinberg, 2001). However, the functional roles of other methylated sites on histones in transcription have been less clear and even debated. For example, the methylation of H3K4 and H3K36 that are often associated with transcriptional activation or elongation can also be associated with transcriptional repression (Bernstein et al., 2006; Dai et al., 2018; Furuhashi et al., 2010; Greer and Shi, 2012; Rechtsteiner et al., 2010; Shi et al., 2006; Wagner and Carpenter, 2012). It remains difficult to predict transcriptional activity of specific gene loci based on the occupancy profiles of their methylation marks.
Surprisingly, we discovered that bulk methylation of histones acts as a major methyl group sink, through which the histones absorb methyl groups from SAM, thereby enabling its conversion to cysteine through a process called transsulfuration (Ye et al., 2017; Ye and Tu, 2018). Consistent with this idea, loss of particular methylation marks often has little effect on gene transcription (Dai et al., 2018; Howe et al., 2016; Nguyen and Zhang, 2011; Wagner and Carpenter, 2012; Ye et al., 2017). In contrast, cysteine supplementation can significantly boost the growth of such mutants lacking histone methylation (Ye et al., 2017). Thus, under methionine and SAM-replete conditions, such a metabolic function for bulk histone methylation could supersede a role in transcriptional regulation (Ye and Tu, 2018).
Just as intracellular SAM amounts can influence histone methylation rates (Dobosy et al., 2008; Mentch et al., 2015; Shiraki et al., 2014; Tang et al., 2017; Ye et al., 2017), amounts of cofactors required for the removal of these marks can influence rates of demethylation. In particular, cellular levels of α-ketoglutarate (α-KG) promote oxidative demethylation of methylated-lysine residues within histones and 5-methylcytosine (5mC) bases within DNA (Carey et al., 2015; Klose and Zhang, 2007; Kohli and Zhang, 2013; Xiao et al., 2012), which is required for the maintenance of pluripotency (Carey et al., 2015). Moreover, erroneous production of 2-hydroxyglutarate (2HG) stimulated by point mutations in IDH1 and IDH2 can competitively inhibit α-KG-dependent demethylation reactions (Chowdhury et al., 2011; Lu et al., 2012; Xu et al., 2011). While opposing methylation and demethylation reactions are influenced by their obligate substrates or cofactors, it remains unclear whether and how SAM-driven histone methylation might be coordinated with regulation of the demethylation process.
Here, we report an unexpected role for the methylation of a major protein phosphatase in the regulation of histone demethylation. Specifically, loss of PP2A methylation in response to methionine starvation causes hyperphosphorylation of H3K36 demethylases, which promotes histone demethylation via enhanced recruitment to chromatin. Blocking demethylation of H3K36 leads to elevated SAM levels and reduced transsulfuration. This regulatory mechanism also enables cells to preserve SAM by increasing SAH to limit SAM consumption by methyltransferase enzymes. Therefore, sinking methyl groups onto histones is not merely passive but also subject to regulation by histone-modifying enzymes. Our findings illustrate a mechanism through which the methyl sink function of histones is regulated by a SAM-responsive phosphatase.
RESULTS
Methylation of PP2A regulates histone methylation and SAM homeostasis
We previously established a methionine starvation regimen by switching prototrophic yeast cells growing in lactate-based rich medium (rich) to lactate-based minimal medium (min) (Sutter et al., 2013). Cells collected before and 0.5, 2, and 4 hours after the switch were monitored for intracellular amounts of SAM (Ye et al., 2017), amounts of methylated histones (Ye et al., 2017) (Figures 1A and S1A), and amounts of unmethylated PP2A (Figure 1A). A rapid decrease in cellular SAM following switch to minimal medium coincided with an abrupt increase in unmethylated PP2A amounts (Figures 1A-B). Amounts of H3K36me3 also gradually decreased over this period (Figures 1A-B). Amounts of SAM, H3K36me3 and methylated-PP2A returned to pre-switch levels following prolonged time in minimal medium. This sequential demethylation of PP2A and histones in response to SAM depletion suggests that these processes might be coupled as part of an unexplored regulatory mechanism.
Figure 1. Methylation of PP2A regulates histone methylation and SAM homeostasis.

(A) Western blots assaying unmethylated amounts of PP2A and methylation of histones on H3K4, H3K36, and H3K79 in WT, cho2Δ, ppm1Δ, and cho2Δppm1Δ strains. Western blots for histone methylation in WT and cho2Δ strains were previously shown in (Ye et al., 2017).
(B) Schematic depicting the trend in intracellular levels of SAM, H3K36me3, and unmethylated PP2A following switch from rich to minimal medium (akin to methionine starvation). The trend lines were plotted using previous (SAM and H3K36me3) and current (unmethylated PP2A) data collected at 0 (before), 0.5, 2, and 4 h after the switch from rich to minimal medium.
(C) The amounts of H3K36me3 in ppm1Δ, cho2Δ, and cho2Δppm1Δ cells relative to WT. Each open circle represents an independent experiment assaying cells harvested within 1 h after the switch to minimal medium. Error bars indicate the standard error of the mean (SEM). *p < 0.05
(D) The amounts of H3K4me3, H3K36me3, and H3K79me3 in ppm1Δ cells relative to WT. Each open circle represents an independent experiment assaying cells harvested within 1 h after the switch to minimal medium. Error bars indicate the standard error of the mean (SEM). **p < 0.01, n.s., not significant.
(E) The conversion of SAM to SAH enabled by methylation also fuels cysteine synthesis through transsulfuration.
(F) Relative abundance of SAM and SAH in WT and ppm1Δ cells 1 h after the switch. Data are represented as mean ± SD (n=3). **p < 0.01.
(G) Schematic depicting 15N tracer experiments to assess transsulfuration activity using LC-MS/MS.
(H) Total spectral counts of labeled (M+2) cystathionine detected in equivalent OD units of WT and ppm1Δ cells at indicated times.
To test whether the methylation status of PP2A can influence rates of histone demethylation, we deleted the PP2A methyltransferase PPM1 in wild type (WT) and cho2Δ mutant cells that lack phospholipid methylation and surveyed methylated histone amounts. We previously showed that cho2Δ cells contain hypermethylated histones due to the accumulation of SAM resulting from loss of phospholipid methylation (Ye et al., 2017). Interestingly, ppm1Δ cells that completely lack PP2A methylation exhibited decreased amounts of tri-methylated H3K36 (H3K36me3) in WT and even in the cho2Δ mutant (Figures 1A and 1C). H3K4me3 amounts were also reduced in ppm1Δ cells, although to a lesser extent (Figure 1A). Quantification of replicative experiments revealed that the amounts of H3K4me3 and H3K36me3 were decreased significantly by ~30% and ~60% in PP2A methylation-deficient cells (Figure 1D). Comparing WT with ppm1Δ cells revealed that PP2A was predominately methylated in rich media (~90%, Figures 1A-B). Therefore, this dynamic demethylation of PP2A most likely acts as a feedback mechanism to restrict SAM consumption by controlling methylation status of histones when cellular SAM is limiting.
Because reducing histone methylation by deletion of the H3K36 methyltransferase Set2 (Ye et al., 2017) or the H3K36A mutation leads to substantial increases in cellular SAM amounts (Figure S1B) and growth dependency on cysteine (Figure S1C), we hypothesized that reduced histone methylation in ppm1Δ cells would spare significant amounts of SAM and concomitantly decrease transsulfuration flux for cysteine synthesis (Figure 1E). Using targeted liquid chromatography-tandem mass spectrometry (LC-MS/MS), we found that cellular SAM amounts were indeed increased more than 2-fold in ppm1Δ cells (Figure 1F) and further increased in ppm1Δcho2Δ cells (Figure S1D). Interestingly, we found that this methionine starvation regimen induced a greater reduction in cystathionine levels in ppm1Δ cells (Figure S1D), suggesting a reduction in methylation-based flux for generating cystathionine. We further estimated flux of this pathway by using 15N-labeled ammonium to trace newly synthesized sulfur metabolites (Figure 1G). We used cystathionine levels as an indicator of transsulfuration pathway activity because the steady state levels of cysteine were very low in cells grown in lactate media. Consistent with increased SAM amounts in ppm1Δ cells, newly synthesized (M+2) levels of cystathionine were much lower than those in WT (Figure 1H), suggesting that loss of PP2A methylation reduced transsulfuration through reduced conversion of SAM to SAH from histone methylation.
Increases in SAH contribute to decreased levels of histone methylation
Interestingly, the coproduct of the transmethylation reaction, SAH, was elevated by ~4-fold in ppm1Δ cells (Figure 1F). As SAH is a competitive inhibitor of SAM-dependent methyltransferases, we then investigated whether the increase in SAH levels in ppm1Δ cells might function to inhibit methylation of histones. We deleted the SAH hydrolase SAH1 to increase cellular SAH levels. In addition to expected increases in cellular SAH amounts (Figure 2A), we found that sah1Δ mutants also exhibited very similar metabolic changes in cellular SAM and cystathionine as those in ppm1Δ mutants (Figure 2A), but such changes were much more pronounced in sah1Δ. Consistent with inhibitory effects of SAH on methyltransferases, SAH accumulation in sah1Δ cells led to decreased amounts of tri-methylated histones (including H3K4me3, H3K36me3, and H3K79me3) even in cells cultured in methionine-replete rich medium (Figure 2B). After the switch to minimal medium, levels of H3K4me3 and H3K36me3 in sah1Δ continued to decrease without the partial restoration seen in WT (Figure 2B). Interestingly, H3K79me3 levels remained low and unaltered (Figure 2B), which could be explained by the lack of a histone demethylase to remove methyl groups from this site (Klose and Zhang, 2007). These findings demonstrate that SAH can inhibit methylation of histones. Therefore, cells may exploit the resulting accumulation of SAH due to loss of PP2A methylation as a mechanism to limit SAM consumption from methylation of histones.
Figure 2. Accumulation of SAH contributes to reduced histone methylation in ppm1Δ cells.

(A) Relative cellular abundances of methionine, SAM, SAH, and cystathionine in WT and sah1Δ cells under indicated conditions. Rich indicates before the switch, and min and min+met indicate 1 h after the switch to minimal media −/+ 1 mM methionine.
(B) Top: Western blots assaying unmethylated amounts of PP2A and tri-methylation of histones on H3K4, H3K36, and H3K79 in WT and sah1Δ cells. Bottom: quantification of relative amounts of respective methyl marks from two independent experiments.
Intriguingly, the methylation of PP2A remained relatively low in sah1Δ cells (Figure 2B), suggesting methylation of PP2A itself is responsive to SAH levels. However, SAH levels increased gradually and continuously 4 hours after the switch for methionine starvation (Ye et al., 2017), during which demethylated PP2A was remethylated (Figures 1A-B). Thus, SAH accumulation is more likely a consequence, but not a cause, for the loss of PP2A methylation. This increase in SAH and the concomitant decrease in production of a downstream metabolite cystathionine suggest that hydrolysis of SAH might be defective. Indeed, the SAH increase in ppm1Δ cells was mitigated in cho2Δ cells that lack phospholipid methylation and therefore produce less SAH (Figure S1D). Moreover, we found that adenosine and AMP levels were also increased in ppm1Δ cells (Figure S1E). The increase in adenosine might also contribute to inhibition of SAH hydrolysis as a product of this reaction (Kloor and Osswald, 2004).
Loss of PP2A methylation increases the turnover of H3K36me3
The methylation status of histones is determined by opposing methylation and demethylation reactions. Even though SAH-mediated inhibition of histone methyltransferases contributes to decreases in histone methylation, ppm1Δ cells did not exhibit uniform reduction in the amounts of methylation amongst different sites (H3K4, H3K36, and H3K79) (Figure 1D), suggesting that there might be additional modes of regulation for histone demethylation. To investigate rates of histone demethylation in vivo, we utilized the auxin-induced degradation (AID) system (Nishimura et al., 2009) to deplete individual histone methyltransferase enzymes (Figure 3A). Such rapid and inducible degradation of histone methyltransferases eliminates SAH-inhibited histone methyltransferases, allowing demethylases to erase methylation marks.
Figure 3. Loss of PP2A methylation promotes H3K36me3 turnover.

(A) Diagram illustrating utilization of the AID (auxin-induced degradation) system to assess rates of histone demethylation. HMT: histone methyltransferase; HDM: histone demethylase.
(B) Western blots assaying the levels of H3K36me3 in WT and ppm1Δ strains engineered with an AID system to rapidly degrade H3K36 methyltransferase Set2. Cells were grown in rich medium to log phase, and 200 μM auxin was added to induce Set2-AID*-HA degradation.
(C) Quantification of the half-lives for H3K36me3 in WT and ppm1Δ cells (n = 6 for WT, n = 4 for ppmlΔ).
We first appended an AID*-HA tag (see Experimental Procedures) to the C-termini of SET1, SET2, and DOT1 at their endogenous chromosomal loci. The tagged versions of these histone methyltransferases were almost completely degraded within 15 min after addition of auxin (indole-3-acetic acid, IAA) (Figure S2A). Following depletion of the H3K36 methyltransferase protein (SET2-AID*-HA), we observed a gradual decrease in H3K36me3 amounts (Figures S2A and 3B), and the rate of decrease was much faster in ppm1Δ mutants (Figure 3B). Using this method, we estimated the half-lives of H3K36me3 to be ~63 min in WT cells and ~16 min in ppm1Δ cells. The doubling times after auxin addition were 2.4 h and 2.8 h in WT and ppm1Δ (Figure S2B), which were substantially longer than their respective half-lives of H3K36me3. These calculations indicate that this H3K36me3 mark is actively being demethylated and remethylated within a cell division cycle, and the demethylation rate was significantly increased in the absence of PP2A methylation.
However, C-terminal tagging of SET1 and DOT1 with AID*-HA unexpectedly abolished their methyltransferase activity, as indicated by the loss of H3K4me3 and H3K79me3 in the corresponding strains, even in the absence of auxin addition (Figure S2A). We then constructed the N-terminal HA-AID* tagged versions of SET1 and DOT1. The HA-AID*-DOT1 protein was quickly depleted within 15 min, whereas H3K79me3 levels were only mildly reduced after auxin was added (Figure S2C). The estimated half-lives of H3K79me3 were ~152 min in WT and ~137 min in ppm1Δ cells (Figure S2D), which were close to their doubling times. Consistent with no known demethylase for this methylation mark (Klose and Zhang, 2007), the reduction of H3K79me3 after auxin addition was probably due to dilution from cell division. Unfortunately, we observed that the inducible degradation of HA-AID*-SET1 was too slow (Figure S2C) and H3K4me3 levels were significantly compromised in this strain (Figure S2C). Therefore, we did not further estimate the rates of H3K4me3 turnover.
Rph1-dependent regulation of H3K36me3 levels in the PP2A methyltransferase mutant ppm1Δ
The demethylation of histones catalyzed by Jumonji-domain containing demethylation enzymes can be regulated by α-KG, which is a required cofactor, and succinate, which is a reaction product and competitive inhibitor (Carey et al., 2015; Xiao et al., 2012). We examined levels of both metabolites in order to determine if such metabolic changes might accelerate demethylation of H3K36me3 in ppm1Δ cells. In both WT and ppm1Δ cells, α-KG was increased while succinate decreased after the switch (Figure S3A). These changes were consistent with the decreases in methylated histone amounts. However, ppm1Δ cells displayed only marginal differences compared to WT in terms of levels of α-KG and succinate (Figure S3A). We supplemented dimethyl-α-ketoglutarate (DMKG) to boost intracellular α-KG levels. DMKG supplementation increased cellular α-KG amounts by ~2-fold in WT cells within 0.5 hour (Figure S3C). However, DMKG only slightly increased α-KG amounts in ppm1Δ cells and appeared to be more readily shunted to glutamine synthesis (Figure S3C). Consistent with the changes in α-KG levels, supplementation of DMKG only affected H3K36me3 amounts in WT cells and could not promote demethylation of H3K36 to the extent observed in ppm1Δ cells (Figure S3B), suggesting that there might exist other mechanisms for activating H3K36 demethylation.
To determine the basis of enhanced rates of H3K36 demethylation in ppm1Δ cells lacking methylated-PP2A, we examined gene expression profiles of histone methylation modifying enzymes from RNA-seq data determined previously (Ye et al., 2017). We observed that three genes encoding histone demethylases (RPH1, GIS1, and JHD2) are highly responsive to the switch (Figure S3D). We then examined protein levels of Rph1 and Gis1 because both are reported as H3K36 demethylases (Klose et al., 2007; Tu et al., 2007b). Gis1 protein amounts remained constant during the switch as well as in both WT and ppm1Δ cells (Figure S3E). In contrast, Rph1 protein amounts were about 2-fold higher in ppm1Δ than in WT cells, and the levels in WT cells were increased by about 50% after switch to minimal medium for 3 h (Figure S3E). Therefore, loss of PP2A methylation can lead to increased Rph1 protein expression. To test whether Rph1 or Gis1 is responsible for the decrease in H3K36me3 in ppm1Δ cells, we deleted either RPH1 or GIS1 alone or in combination in the background of WT and ppm1Δ. Notably, rph1Δ cells exhibited increased H3K36me3 levels (Figure 4A), and deletion of RPH1 restored the levels of H3K36me3 in ppm1Δ to those in rph1Δ (Figure 4A). However, GIS1 deletion had no effect on H3K36me3 levels (Figure 4A). Therefore, these data suggest that enhanced H3K36me3 demethylation observed in ppm1Δ cells is mediated by Rph1 and not Gis1.
Figure 4. Demethylation of PP2A activates H3K36 demethylation by promoting phosphorylation of H3K36 demethylase enzymes.

(A) Top: Western blots assaying the levels of mono-, di- and tri-methylation of H3K36 in indicated cells collected 1 h after the switch to minimal medium. Below: quantification of H3K36me3 levels from two independent experiments.
(B) Protein domains of yeast histone demethylases Rph1 and Gis1 and their human orthologues. Orange regions indicate low complexity sequences. Numbers denote predicted number of phosphorylation sites within these regions.
(C) Determination of phosphorylation status of Rph1-HA in indicated strains and conditions using a tris-acetate protein gel. Phosphorylation status for these demethylases was also assessed in cho2Δ cells that accumulate SAM and in opi1Δ cells that accelerate SAM turnover.
(D) Phosphatase treatment of immunoprecipitated Rph1-HA from WT and ppm1Δ cells collected 1 h after the switch to minimal medium.
(E) Same as in (C) except Rph1-HA phosphorylated species were sized using a phos-tag gel.
(F) Phosphorylation sites identified by mass spectrometry in this study were marked in red (including S412, S429, S430, S434, and S575). Phosphorylation of S425 and S426 was identified in another study (Swaney et al., 2013) as indicated in the SGD database.
(G) Western blots assaying the levels of H3K36me3 in cells expressing indicated Rph1 protein ser to ala phosphomutants, in the background of WT or ppm1Δ strain, grown in rich medium.
(H) Quantification of H3K36me3 levels in WT cells with the Rph1 protein containing S412A or S575A mutations. Data are represented as mean ± SEM (n=7). *p < 0.05 and n.s., not significant.
Phosphorylation regulates the activity of the H3K36 demethylase Rph1
However, Rph1 protein amounts were not altered (Figure S3E) when H3K36me3 levels decreased within 1 h after the switch (Figure 1B) (Ye et al., 2017). Hence, Rph1 protein expression might not be sufficient to explain the rapid decrease in H3K36me3 levels. Because PP2A is a major protein phosphatase, we tested whether the H3K36 demethylase is phosphorylated, and if its phosphorylation states might be regulated by the methylation status of PP2A. We consulted protein phosphorylation databases and compared Rph1, Gis1, and human orthologues among the group of JHDM3/JMJD2 proteins (Figure 4B). We found multiple reported phosphorylation sites (Albuquerque et al., 2008; Swaney et al., 2013) within the low complexity regions between a JmjC (Jumonji C), JmjN (Jumonji N) domain and a domain targeting chromatin (Figure 4B). First using tris-acetate gels, we observed that the Rph1 protein became smeared and migrated slower in ppm1Δ cells and in WT cells switched to minimal medium (Figure 4C), suggesting that loss of PP2A methylation promotes Rph1 phosphorylation. We confirmed that Rph1 is a phosphoprotein because phosphatase treatment resulted in faster migrating bands during SDS-PAGE (Figure 4D). Rph1 appeared to be most phosphorylated in WT cells switched to minimal medium, as it migrated slowest under this condition (Figure 4C). Methionine addition, which boosts SAM levels, only moderately reduced Rph1 phosphorylation (Figure 4E), suggesting that not all phosphorylation sites on Rph1 observed after the shift to minimal medium are SAM-responsive and PP2A-dependent.
To further understand phosphorylation-based regulation of H3K36 demethylase activity, we performed mass spectrometry to identify phosphorylation sites on immunoprecipitated Rph1-HA proteins from WT and ppm1Δ cells grown in rich medium, and WT cells starved for methionine in minimal medium. Among five phosphorylation sites identified (Figure 4F), phosphorylation of S412 and S575 were most likely SAM-responsive because their phosphorylation was only found in the ppm1Δ mutant and in WT cells in minimal medium. We constructed various serine (S) to alanine (A) mutations to replace chromosomal RPH1, including S412A, S575A, S429/430A (2A), and S425/426/429/430/434A (5A). Among them, the S412A mutation increased H3K36me3 levels in both WT and ppm1Δ cells grown in rich medium (Figure 4G) as well as WT cells starved in minimal medium (Figure S4A). Quantification of replicative experiments revealed that the S412A mutation led to significant increases in H3K36me3 levels by about 50% in WT and 100% in ppm1Δ cells (Figures 4H and S4B). Although the 2A and 5A mutant could also increase H3K36me3 levels under certain conditions (Figures 4G and S4A), these effects might not be specifically due to lack of phosphorylation. This is because their corresponding phosphomimetic mutations (serine to aspartate) also led to increased H3K36me3 levels (the effect was more pronounced with combinatorial mutations of S412D and/or S575D, Figure S4C). Unfortunately, none of the constructed phosphomimetic mutations including S412D appeared to promote demethylase activity (Figure S4C). Therefore, phosphorylation of Rph1 on S412, promoted by demethylation of PP2A in response to SAM depletion, is required but not sufficient to activate H3K36 demethylation.
Phosphorylation of Rph1 promotes binding to chromatin
We next used the AID system to confirm the requirement of S412 phosphorylation for H3K36 demethylation. We found that the S412A mutation consistently caused ~50% increases in H3K36me3 amounts in the Set2-AID*-HA strain (Figure 5A). Interestingly, H3K36me3 amounts in both WT and S412A mutant cells were reduced at a similar rate following depletion of the H3K36 methyltransferase Set2 (Figure 5A). This finding suggests that S412 phosphorylation is dispensable for the enzymatic activity of Rph1. We then investigated whether phosphorylation affects the ability of Rph1 to interact with chromatin using ChIP-seq. We observed that Rph1 became more strongly or weakly associated with different genomic regions (Figure 5B-D) after the switch to minimal media. Furthermore, analysis of the ChIP-Seq data revealed that the Rph1 protein in ppm1Δ cells exhibited an overall increase in chromatin binding (Figures 5B-D). In stark contrast, loss of S412 phosphorylation in the S412 mutant cells led to a substantial reduction in chromatin binding of Rph1-HA (Figures 5B-D). Because phosphorylation of Rph1 on S412 is SAM-responsive and PP2A-dependent (Figure 4F), these data suggest that S412 is a critical phosphorylation site that promotes binding of the demethylase to chromatin in response to SAM availability.
Figure 5. SAM-responsive, PP2A-dependent phosphorylation of Rph1 promotes the binding of the Rph1 histone demethylase to chromatin.

(A) The turnover of H3K36me3 amounts was assayed by Western blots using the AID system (left) and quantified (right). WT and S412A Rph1-HA were engineered to replace endogenous Rph1 at the chromosomal locus in the Set2 AID strain background. Cells were grown in rich medium to log phase, and 200 μM auxin was added to induce Set2-AID*-HA degradation.
(B) Heat map depicting the enrichment of Rph1-HA chromatin binding regions in WT, ppm1Δ, and S412A mutant cells in rich media and in WT cells switched to minimal medium.
(C) Genome browser view of Rph1-HA binding peaks within the chromosome X region of 520,000-650,000 bp.
(D) Kernel density estimation of relative Rph1-HA chromatin binding among indicated samples. Of note, ppm1Δ (red) is positively-skewed (log2(fold change) > 0), and the S412 mutant (blue) is negatively-skewed (log2(fold change) < 0).
(E) Relative abundance of SAM in WT and rph1Δ cells 1 h after the switch. Data are represented as mean ± SEM (n=5). **p < 0.01.
(F) Total spectral counts of labeled (M+2) cystathionine detected in equivalent OD units of WT and rph1Δ cells at indicated times. Data are represented as mean ± SD (n=4).
(G) Representative growth curves of indicated strains in rich media with or without 1 mM cysteine (cys) supplementation. Note that the growth defect of the met17Δcho2Δrph1Δ strain was rescued by cysteine. Data are representative of three independent experiments.
Activation of histone demethylation prepares the histones for remethylation that fuels transsulfuration
Demethylation of PP2A led to reduced amounts of methylated histones (Figure 1C), which not only preserved SAM but could also open more methylatable sites on histones. To assess whether histone demethylation alters the capacity of histones to sink the methyl groups of SAM, we examined cellular SAM in the rph1Δ mutant containing highly tri-methylated H3K36. Cellular SAM was more than 2-fold higher in rph1Δ compared to WT (Figure 5E), suggesting that the histones consume less SAM when H3K36 is highly methylated. Because SAM consumption fuels cysteine synthesis through transsulfuration (Figure 1E), we tested if defective demethylation of H3K36 in rph1Δ cells may recapitulate a similar reduction in transsulfuration flux observed in ppm1Δ cells (as shown in Figure 1H). Interestingly, levels of newly synthesized cystathionine (M+2) were decreased in rph1Δ relative to those in WT cells after the switch to minimal media with 15N-labeled ammonium (Figure 5F). We tested if defective demethylation of H3K36 might also cause growth dependency on cysteine similar to the set2Δ mutant lacking the H3K36 methyltransferase. We blocked the sulfate assimilation pathway and the major phospholipid methylation pathway by deletion of MET17 and CHO2 because both serve as major sources for cysteine synthesis. Interestingly, we found that the growth rate of rph1Δmet17Δcho2Δ cells was decreased compared to met17Δcho2Δ cells, but was rescued by supplementation of cysteine in the media (Figure 5G). The growth rate of set2Δmet17Δcho2Δ cells was even more compromised (Figure 5G), likely due to the complete lack of access to H3K36 sites. Overall, these phenotypes of elevated SAM and reduced transsulfuration flux in the histone demethylation mutant rph1Δ highlight an important metabolic function enabled by de novo H3K36 methylation.
H3K36 methylation is regulated by pp2ACdc55
The methylation of PP2A is required for the assembly of regulatory B subunits into the holoenzyme (Wei et al., 2001; Wu et al., 2000). We sought to identify which B subunit confers substrate specificity that is required for regulation of H3K36 demethylation. Immunoprecipitation experiments showed that the interaction between PP2A catalytic C-subunit Pph21 and regulatory B subunits Rts1 and Cdc55 was abolished in ppm1Δ cells, as HA-Pph21 was not able to pull down either Rts1-flag or Cdc55-flag in the absence of PP2A methylation (Figure 6A). While this finding is consistent with previous studies (Wei et al., 2001; Wu et al., 2000), an in vivo study suggests that Rts1 and Cdc55 have different sensitivities to loss of PP2A methylation for holoenzyme formation (Gentry et al., 2005).
Figure 6. H3K36 methylation is regulated by PP2A-Cdc55.

(A) Immunoprecipitation experiment to assess interaction between HA-Pph21 (PP2A C subunit) and Rts1-flag or Cdc55-flag (B subunits) in WT and ppm1Δ cells. Cells were grown in rich medium to log phase and harvested.
(B) Relative abundance of SAM and SAH in WT, ppm1Δ, rts1Δ, and cdc55Δ cells 1 h after the switch. Data are represented as mean ± SD (n=3).
(C) Western blots assaying unmethylated amounts of PP2A and methylation of histones on H3K4, H3K36, and H3K79 in indicated strains. Cells were collected 1 h after switch to minimal medium, with or without 1 mM methionine. Note reduced levels of H3K36me3 in cdc55Δ and cho2Δcdc55Δ strains.
(D) Determination of phosphorylation of Rph1-HA in indicated strains using phos-tag SDS-PAGE gels.
We then utilized a genetic approach to determine which B subunit is required for regulation of H3K36 methylation. We examined SAM, SAH, and H3K36me3 amounts as well as phosphorylation states of Rph1 in mutants lacking either Cdc55 or Rts1. SAM levels were elevated in the cdc55Δ mutant but remained unchanged in rts1Δ mutants (Figure 6B). Cellular SAH levels in cdc55Δ cells were comparable to ppm1Δ cells, but relatively lower in rts1Δ cells (Figure 6B). Strikingly, amongst tri-methylation marks, H3K36me3 levels were the lowest in cdc55Δ and cho2Δcdc55Δ mutants. Such remarkable decreases in H3K36me3 were not seen in rts1Δ and cho2Δrts1Δ mutants (Figure 6C). Increasing cellular SAM amounts by cho2Δ or methionine addition failed to promote H3K36me3 levels in cdc55Δ cells, a phenotype also observed in ppm1Δ cells (Figure 6C). Furthermore, we observed that the Rph1 protein became most phosphorylated in cdc55Δ mutants (Figure 6D). Therefore, genetic ablation of a regulatory B subunit employed by PP2A for this regulation led to similar phenotypes as those observed in ppm1Δ cells. These results collectively indicate that the dissociation of Cdc55 from the PP2A holoenzyme associated with loss of PP2A methylation promotes the phosphorylation of H3K36 demethylases and thus the demethylation of H3K36me3.
DISCUSSION
Chromatin modification is intimately linked to metabolic state because many biochemical reactions for installing or removing marks on chromatin require intermediary metabolites as obligate substrates or cofactors (Fan et al., 2015; Huang et al., 2015; Janke et al., 2015; Lu and Thompson, 2012; Ye and Tu, 2018). Such metabolite-to-epigenome communication provides an avenue to interpret metabolic information, through which transcription and metabolism can be reprogrammed for cellular homeostasis (Schvartzman et al., 2018). However, the underlying purpose of metabolic links to specific marks remains poorly understood. For example, H3K36 methylation, which is often thought to be associated with active transcription, can also be associated with gene repression (Wagner and Carpenter, 2012). While a transcriptional function for this mark continues to be debated, methylation of histones on H3K36 is very sensitive to cellular SAM amounts (Mentch et al., 2015; Ye et al., 2017). Inhibiting H3K36 methylation leads to SAM accumulation and growth dependency on cysteine (Ye et al., 2017), revealing an unforeseen function for histone methylation in facilitating the conversion of SAM to cysteine. In fact, SAM consumption and transformation is an intrinsic and fundamental property of the biochemical methylation of histones (Ye and Tu, 2018).
Here, we demonstrate that the capacity of histones to consume SAM is regulated by the major protein phosphatase PP2A, whose activity itself is modulated by SAM-sensitive methylation of its catalytic subunit (Bryant et al., 1999; Stanevich et al., 2011; Sutter et al., 2013; Tolstykh et al., 2000). Specifically, loss of PP2A methylation leads to hyperphosphorylation of demethylation enzymes, which activates the demethylation of histones (Figure 7). Furthermore, demethylation of PP2A also increases cellular SAH levels to inhibit methyltransferase enzymes, which preserves SAM (Figure 7). This PP2A-directed mechanism regulates opposing methylation and demethylation reactions, through which SAM is spared by adjusting the “methylation capacity” of histones in response to SAM limitation.
Figure 7. Model depicting the regulation of histone demethylation by PP2A.

When SAM is abundant, PP2A is predominantly methylated. Methylated PP2A promotes dephosphorylation of histone demethylases. In response to SAM starvation, demethylated PP2A promotes disassociation of the regulatory subunit Cdc55 from the PP2A holoenzyme complex, leading to hyperphosphorylation of the histone demethylase Rph1 and increased SAH levels. The resultant phosphorylation of Rph1 promotes its association with chromatin, through which the net demethylation of H3K36 methylation is facilitated. In parallel, increased SAH amounts inhibit histone methylation to spare SAM. Consequently, the demethylation of PP2A opens more methylatable sites on histones by reducing methylated amounts of histones, which is likely to prepare histones for absorbing methyl groups when SAM is replenished. In total, this regulatory mechanism synchronizes methylation states of both PP2A and histones to SAM availability.
Histone demethylation increases the methyl sink capacity of histones, which is likely to have at least two key functions. First, an increased amount of methylatable sites allows for expansive changes to the epigenome when SAM becomes replenished. Second, hypomethylated histones facilitate the maintenance of nuclear methylation potential as well as the biosynthesis of cysteine and glutathione following SAM repletion. Therefore, the methylation status of PP2A and the histones are coordinated to promote the proper utilization or preservation of SAM in tune with methionine availability.
We previously demonstrated that methionine is a key signal of amino acid sufficiency that functions through boosting the SAM-dependent methylation of PP2A. Methylated-PP2A promotes growth and inhibits autophagy by dephosphorylating Npr2, thereby relieving the inhibition of TORC1 by the SEACIT/GATOR1 complex (Sutter et al., 2013). Here, we report a second key metabolic adaptation downstream of PP2A. In addition to autophagy, the demethylation of PP2A induced by methionine starvation signals the demethylation of histones and the concomitant preservation of SAM. Upon methionine repletion, the demethylated sites on histones can now be readily re-methylated to afford the conversion of increased amounts of SAM to cysteine. Therefore, the SAM-responsive methylation of this major protein phosphatase PP2A enables it to direct metabolic programs associated with growth or survival in tune with the availability of this key sentinel metabolite.
STAR METHODS
Detailed methods are provided in the online version of this paper and include the following:
KEY RESOURCES TABLE
KEY RESOURCES TABLE
| REAGENT or RESOURCE | SOURCE | IDENTIFIER |
|---|---|---|
| Antibodies | ||
| Mouse anti-FLAG M2 antibody | Sigma | Cat#F3165; RRID: AB_259529 |
| Mouse monoclonal anti-PP2A, C subunit | Millipore | Cat#05-545 |
| Rabbit anti-H3K4me1 | Abcam | Cat# ab8895; RRID:AB_306847 |
| Rabbit anti-H3K4me2 | Abcam | Cat# ab32356, RRID:AB_732924 |
| Rabbit anti-H3K4me3 | Millipore | Cat# 07-473, RRID:AB_1977252 |
| Rabbit anti-H3K36me1 | Abcam | Cat# ab9048, RRID:AB_306964 |
| Rabbit anti-H3K36me2 | Abcam | Cat# ab9049, RRID:AB_1280939 |
| Rabbit anti-H3K36me3 | Abcam | Cat# ab9050, RRID:AB_306966 |
| Rabbit anti-H3K79me2 | Abcam | Cat# ab3594, RRID:AB_303937 |
| Rabbit anti-H3K79me3 | Abcam | Cat# ab2621, RRID:AB_303215 |
| Rabbit anti-H3 | Millipore | Cat#06-755 |
| Rabbit anti-G6PDH | Sigma | Cat#A9521 |
| Mouse anti-HA(12CA5) | Roche | Ref#11583816001 |
| Rabbit anti-HA (C29F4) | Cell Signaling Technology | Cat# 3724S RRID: AB_10693385 |
| Bacterial and Virus Strains | ||
| Biological Samples | ||
| Chemicals, Peptides, and Recombinant Proteins | ||
| methionine | Sigma | Cat#M9625 |
| S-adenosylmethionine | Sigma | Cat#A7007 |
| cysteine | Sigma | Cat#C7352 |
| Phos-tag™ Acrylamide | Wako | Cat#304-93521 |
| Critical Commercial Assays | ||
| cOmplete EDTA-free protease inhibitor cocktail tablets | Roche | Cat#11873580001 |
| NuPAGE 4-12% polyacrylamide Bis-Tris Gels | Life Technologies | Cat#WG1403BX10 |
| NuPAGE 10% polyacrylamide Bis-Tris Gels | Life Technologies | Cat#WG1202BX10 |
| phenylmethylsulfonyl fluroride | Sigma | Cat#P7626 |
| sodium orthovanadate | MP Biomedicals | Cat#159664 |
| Pierce BCA protein assay | Thermo Fisher Scientific | Cat#23225 |
| Deposited Data | ||
| ChIP sequencing data | GEO-NCBI | GSE121635 |
| Experimental Models: Cell Lines | ||
| Experimental Models: Organisms/Strains | ||
| S. cerevisiae: Name = CEN.PK; Genotype = MATa | Van Dijken et al., 2000 | N/A |
| S. cerevisiae: Name = CEN.PK; Genotype = MATα | Van Dijken et al., 2000 | N/A |
| S. cerevisiae: Name = CEN.PK; Genotype = MATa; cho2Δ::KanMX | Ye et al., 2017 | N/A |
| S. cerevisiae: Name = CEN.PK; Genotype = MATa; ppm1Δ::KanMX | Sutter et al., 2013 | N/A |
| S. cerevisiae: Name = CEN.PK; Genotype = MATa; cho2Δ::NAT; ppm1Δ::HYG | This paper | N/A |
| S. cerevisiae: Name = CEN.PK; Genotype = MATa; sah1Δ::HYG | Ye et al., 2017 | N/A |
| S. cerevisiae: Name = CEN.PK; Genotype = MATa; HO::TIR1-V5::KanMX | This paper | N/A |
| S. cerevisiae: Name = CEN.PK; Genotype = MATa; HO::TIR1-V5::KanMX; SET1-AID*-HA::HYG | This paper | N/A |
| S. cerevisiae: Name = CEN.PK; Genotype = MATa; HO::TIR1-V5::KanMX; SET2-AID*-HA::HYG | This paper | N/A |
| S. cerevisiae: Name = CEN.PK; Genotype = MATa; HO::TIR1-V5::KanMX; DOT1-AID*-HA::HYG | This paper | N/A |
| S. cerevisiae: Name = CEN.PK; Genotype = MATa; HO::TIR1-V5::KanMX; SET2-AID*-HA::HYG; ppm1Δ::HYG | This paper | N/A |
| S. cerevisiae: Name = CEN.PK; Genotype = MATa; HO::TIR1-V5::KanMX; HYG-TEFpr-HA-AID*::SET1 | This paper | N/A |
| S. cerevisiae: Name = CEN.PK; Genotype = MATa; HO::TIR1-V5::KanMX; HYG-TEFpr-HA-AID*::SET1; ppm1Δ::NAT | This paper | N/A |
| S. cerevisiae: Name = CEN.PK; Genotype = MATa; HO::TIR1-V5::KanMX; HYG-TEFpr-HA-AID*::DOT1 | This paper | N/A |
| S. cerevisiae: Name = CEN.PK; Genotype = MATa; HO::TIR1-V5::KanMX; HYG-TEFpr-HA-AID*::DOT1; ppm1Δ::NAT | This paper | N/A |
| S. cerevisiae: Name = CEN.PK; Genotype = MATa; gis1Δ::NAT | This paper | N/A |
| S. cerevisiae: Name = CEN.PK; Genotype = MATa; rph1Δ::NAT | This paper | N/A |
| S. cerevisiae: Name = CEN.PK; Genotype = MATa; gis1Δ::HYG; rph1Δ::NAT | This paper | N/A |
| S. cerevisiae: Name = CEN.PK; Genotype = MATa; ppm1Δ::KanMX; gis1Δ::NAT | This paper | N/A |
| S. cerevisiae: Name = CEN.PK; Genotype = MATα; ppm1Δ::KanMX; rph1Δ::NAT | This paper | N/A |
| S. cerevisiae: Name = CEN.PK; Genotype = MATa; ppm1Δ::KanMX; gis1Δ::HYG; rph1Δ::NAT | This paper | N/A |
| S. cerevisiae: Name = CEN.PK; Genotype = MATa; RPH1-HA::HYG | This paper | N/A |
| S. cerevisiae: Name = CEN.PK; Genotype = MATα; ppm1Δ::KanMX; RPH1-HA::HYG | This paper | N/A |
| S. cerevisiae: Name = CEN.PK; Genotype = MATa; cho2Δ::KanMX; RPH1-HA::HYG | This paper | N/A |
| S. cerevisiae: Name = CEN.PK; Genotype = MATa; opi1Δ::KanMX; RPH1-HA::HYG | This paper | N/A |
| S. cerevisiae: Name = CEN.PK; Genotype = MATa; ppm1Δ::HYG; opi1Δ::NAT; RPH1-HA::KanMX | This paper | N/A |
| S. cerevisiae: Name = CEN.PK; Genotype = MATa; rts1Δ::KanMX; RPH1-HA::HYG | This paper | N/A |
| S. cerevisiae: Name = CEN.PK; Genotype = MATa; cdc55Δ::KanMX; RPH1-HA::HYG | This paper | N/A |
| S. cerevisiae: Name = CEN.PK; Genotype = MATa; RPH1-S412A-HA::HYG | This paper | N/A |
| S. cerevisiae: Name = CEN.PK; Genotype = MATa; RPH1-S429,430A(2A)-HA::HYG | This paper | N/A |
| S. cerevisiae: Name = CEN.PK; Genotype = MATa; RPH1-S425,426,429,430,434A(5A)-HA::HYG | This paper | N/A |
| S. cerevisiae: Name = CEN.PK; Genotype = MATa; RPH1-S575A-HA::HYG | This paper | N/A |
| S. cerevisiae: Name = CEN.PK; Genotype = MATa; RPH1-S412A-HA::HYG; ppm1Δ::KanMX | This paper | N/A |
| S. cerevisiae: Name = CEN.PK; Genotype = MATa; RPH1-S429,430A(2A)-HA::HYG; ppm1Δ::KanMX | This paper | N/A |
| S. cerevisiae: Name = CEN.PK; Genotype = MATa; RPH1-S425,426,429,430,434A(5A)-HA::HYG; ppm1Δ::KanMX | This paper | N/A |
| S. cerevisiae: Name = CEN.PK; Genotype = MATa; RPH1-S575A-HA::HYG; ppm1Δ::KanMX | This paper | N/A |
| S. cerevisiae: Name = CEN.PK; Genotype = MATa; cho2Δ::KanMX; met17Δ::HYG | Ye et al., 2017 | N/A |
| S. cerevisiae: Name = CEN.PK; Genotype = MATa; cho2Δ::KanMX; met17Δ::NAT; set2Δ::HYG | This paper | N/A |
| S. cerevisiae: Name = CEN.PK; Genotype = MATa; cho2Δ::KanMX; met17Δ::HYG; rph1Δ::NAT | This paper | N/A |
| S. cerevisiae: Name = CEN.PK; Genotype = MATa; HA-PPH21; CDC55-flag::HYG | This paper | N/A |
| S. cerevisiae: Name = CEN.PK; Genotype = MATa; HA-PPH21; CDC55-flag::HYG; ppm1Δ::NAT | This paper | N/A |
| S. cerevisiae: Name = CEN.PK; Genotype = MATa; HA-PPH21; RTS1-flag::HYG | This paper | N/A |
| S. cerevisiae: Name = CEN.PK; Genotype = MATa; HA-PPH21; RTS1-flag::HYG; ppm1Δ::NAT | This paper | N/A |
| S. cerevisiae: Name = CEN.PK; Genotype = MATa; rts1Δ::HYG | This paper | N/A |
| S. cerevisiae: Name = CEN.PK; Genotype = MATa; cdc55Δ::HYG | This paper | N/A |
| S. cerevisiae: Name = CEN.PK; Genotype = MATa; cho2Δ::KanMX; rts1Δ::HYG | This paper | N/A |
| S. cerevisiae: Name = CEN.PK; Genotype = MATa; cho2Δ::KanMX; cdc55Δ::HYG | This paper | N/A |
| S. cerevisiae: Name = CEN.PK; Genotype = MATa; RPH1-S429,430D(2D)-HA::HYG | This paper | N/A |
| S. cerevisiae: Name = CEN.PK; Genotype = MATa; RPH1-S412D-HA::HYG | This paper | N/A |
| S. cerevisiae: Name = CEN.PK; Genotype = MATa; RPH1-S575D-HA::HYG | This paper | N/A |
| S. cerevisiae: Name = CEN.PK; Genotype = MATa; RPH1-S412,575D-HA::HYG | This paper | N/A |
| S. cerevisiae: Name = CEN.PK; Genotype = MATa; RPH1-S412,429,430D-HA::HYG | This paper | N/A |
| S. cerevisiae: Name = CEN.PK; Genotype = MATa; RPH1-S429,430,575D-HA::HYG | This paper | N/A |
| S. cerevisiae: Name = CEN.PK; Genotype = MATa; RPH1-S412,429,430,575D-HA::HYG | This paper | N/A |
| S. cerevisiae: Name = CEN.PK; Genotype = MATa; HO::TIR1-V5::KanMX; SET2-AID*-HA::HYG; RPH1-HA-NAT | This paper | N/A |
| S. cerevisiae: Name = CEN.PK; Genotype = MATa; HO::TIR1-V5::KanMX; SET2-AID*-HA::HYG; RPH1-S412A-HA-HYG | This paper | N/A |
| Oligonucleotides | ||
| Recombinant DNA | ||
| Software and Algorithms | ||
| Other | ||
CONTACT FOR REAGENT AND RESOURCE SHARING
As Lead Contact, Benjamin P. Tu is responsible for all reagent and resource requests. Further information and requests for reagents may be directed to and will be fulfilled by the corresponding author, Dr. Benjamin P. Tu (benjamin.tu@utsouthwestern.edu).
EXPERIMENTAL MODEL AND SUBJECT DETAILS
Yeast strains and media
All yeast strains used in this study are listed in the Key Resources Table. All strains and genetic manipulations were verified by sequencing and phenotype. The prototrophic CEN.PK strain background was used in all experiments. Gene deletions were carried out using either tetrad dissection or standard PCR-based strategies to amplify resistance cassettes with appropriate flanking sequences, and replacing the target gene by homologous recombination (Longtine et al., 1998). Carboxy-terminal tags were similarly made with the PCR-based method PCR to amplify resistance cassettes with flanking sequences.
Media used in this study: YPL (1% yeast extract, 2% peptone and 2% lactate) and SL (0.17% yeast nitrogen base without amino acids containing 0.5% ammonium sulfate (Difco), 2% lactate).
METHOD DETAILS
Metabolite extraction and quantitation
Intracellular metabolites were extracted from using a previous established method (Tu et al., 2007a). Briefly, at each time point, equal OD units of cells were rapidly quenched to stop metabolism by addition into 4 ml quenching buffer containing 60% methanol and 10 mM Tricine, pH 7.4. 5 min after maintained at −400, cells were spun at 5,000 × g for 2 min at 0°C, washed with 1 m l of the same buffer, and then resuspended in 1 ml extraction buffer containing 75% ethanol and 0.5 mM Tricine, pH 7.4. Intracellular metabolites were extracted by incubating at 75°C for 3 min, followed by incubation at 4°C for 5 min. Samples we re spun at 20,000 × g for 1 min to pellet cell debris, and 0.9 ml of the supernatant was transferred to a new tube. After a second spin at 20,000 × g for 10 min, 0.8 ml of the supernatant was transferred to a new tube. Metabolites in the extraction buffer were dried using SpeedVac and stored at −80°C until analysis.
SAM, SAH, and other cellular metabolites were quantitated by LC-MS/MS with a triple quadrupole mass spectrometer (3200 QTRAP, ABSCIEX) using previously established methods (Tu et al., 2007a). Briefly, metabolites were separated chromatographically on a C18-based column with polar embedded groups (Synergi Fusion, 150 ‘2.0 mm 4 m, Phenomenex), using a Shimadzu Prominence LC20/SIL-20AC HPLC-autosampler coupled to the mass spectrometer. Flow rate was 0.5 ml/min using the following method: Buffer A: 99.9% H2O/0.1% formic acid, Buffer B: 99.9% methanol /0.1% formic acid. T = 0 min, 0% B; T = 4 min, 0% B; T = 11 min, 50% B; T = 13 min, 100% B; T = 15 min, 100% B, T = 16 min, 0% B; T = 20 min, stop. For those metabolites that were only detectable in negative mode, such as α-KG, we used the following buffer system: Buffer A: 99.9% H2O/10 mM tributylamine, Buffer B: 99.9% methanol. For each metabolite, a 1 mM standard solution was infused into a Applied Biosystems 3200 QTRAP triple quadrupole-linear ion trap mass spectrometer for quantitative optimization detection of daughter ions upon collision-induced fragmentation of the parent ion [multiple reaction monitoring (MRM)]. The parent ion mass was scanned for first in positive mode (usually MW + 1). For each metabolite, the optimized parameters for quantitation of the two most abundant daughter ions (i.e., two MRMs per metabolite) were selected for inclusion in further method development.
For running samples, dried extracts (typically 5 OD units) were resuspended in 140 μL 0.1% formic acid or 10 mM tributylamine for injection (typically 50 μl injection volume). Often both MRMs for a given metabolite displayed high correlation, lending confidence to the developed methods. The retention time for each MRM peak was compared to an appropriate standard. The area under each peak was then quantitated by using Analyst software, reinspected for accuracy. We normalized total spectral counts of a metabolite against cell number of OD units.
Metabolic flux analysis using 15N ammonium sulfate
15N labeled ammonium sulfate ((15NH4)2SO4) was obtained from Cambridge Isotope Laboratories, Inc. Cells logarithmically grown in rich media were spun down, washed with synthetic minimal media without ammonium sulfate, and re-suspended to minimal medium where all the ammonium sulfate (sole nitrogen source) was 15N labeled. Cells were collected at indicated times, and metabolites were extracted. 15N labeled metabolites were detected by LC-MS/MS, with the targeted parent and daughter ions specific to the 15N form of the metabolites. Total spectral counts of 15N cystathionine were presented at indicated times, and each injection of metabolite measurements represented levels of metabolites extracted from the same number of cells.
Whole yeast cell extracts preparation
Urea based protocols were used to lyse yeast cells for western blots. Cells were quenched in 10% TCA for 20 minutes, spun down, washed with acetone. Cell pellets were resuspended in urea buffer containing 50 mM Tris-Cl pH 7.5, 5 mM EDTA, 6 M urea, 1% SDS, 1 mM PMSF, 2 mM sodium orthovanadate, and 50 mM NaF, and lysed by bead beating. After collecting supernatants, protein concentration was determined using Pierce BCA protein assay, and the same amount of proteins was separated using NuPAGE bis-tris or tri-actate gels. For the phos-tag experiment, cell extracts were prepared with EDTA-free buffer.
Yeast histone western blots
Cell extracts were normalized to the same protein concentration, and the same amounts of protein from each sample were loaded and resolved on NuPAGE Bis-Tris Gels (4-12% or 10%). Detecting each histone modification was performed on a separate gel using freshly prepared antibody.
PP2A Methylation western blots
Two identical sets of cell lysates were separated in one NuPAGE Bis-Tris Gel and transferred to a PVDF membrane. After blocking, one set was blotted with the antibody detecting unmethylated PP2A, and the other set was treated with 200 mM sodium hydroxide for 15 minutes to demethylate PP2A before blotting with the same antibody. After incubation with the PP2A antibody, two blots were washed, incubated with secondary antibody for chemiluminescence detection.
Phos-tag western blots
We followed the phos-tag product manual to prepare phos-tag-based sodium dodecyl sulfate polyacrylamide gel electrophoresis (SDS-PAGE) for protein phosphorylation analysis. Briefly, 6% (w/v) acrylamide SDS-PAGE gel containing 10-50 μM phos-tag was made for the analysis of Rph1 protein phosphorylation. Cell extracts were prepared in EDTA-free urea buffer (50 mM Tris-Cl pH 7.5, 6 M urea, 1% SDS, 1 mM PMSF, 2 mM sodium orthovanadate, 50 mM NaF, and 1x protease inhibitor cocktail).
Identification of phosphorylation site by mass spectrometry
Rph1-HA tagged cells collected from rich and minimal media were lysed by bead beating in a buffer containing 50 mM HEPES-pH 7.5, 150 mM sodium chloride, 10 mM magnesium chloride, 0.2% NP-40, 2× protease inhibitor cocktail, 1 mM PMSF, 1 mM sodium vanadate, 10 μM leupeptin, 5 μM pepstatin A, and 5 mM sodium fluoride. Immunoprecipitated Rph1-HA proteins were resolved using SDS protein gels, and the gel area corresponding to Rph1-HA protein was cut off for determination of phosphorylation sites using mass spectrometry as described previously (Zhang et al., 2017).
Using the auxin-induced degradation system to study the turnover rate of methylated histones
The TIR1-V5 construct containing a kanamycin resistance cassette was inserted to the HO locus. For C-terminal gene manipulation, the AID*-HA epitope tag containing a hygromycin resistance cassette was inserted by replacing the stop codons of histone methyltransferase genes. For N-terminal gene manipulation, the pTEF-AID*-HA construct was inserted by replacing the original promoters and start codons for SET1 or DOT1. Substitution of the original promoters is necessary, as the AID*-HA N-terminal insertion repressed SET1 and DOT1 expression. 200 μM IAA was used to induce the degradation of histone methyltransferase proteins. Cell pellets were collected at times indicated before and after adding IAA.
Chromatin immunoprecipitation sequencing
ChIP was performed as described previously (Ye et al., 2017). Briefly, yeast cells were grown in YPL to OD600 = 1 before switching to SL for 1 hour. 50 units of OD600 cells were quenched in 1% formaldehyde for 15 minutes and then quenched with glycine for 10 minutes. Cell pellets were washed twice with a buffer containing 100 mM NaCl, 10 mM Tris-HCl pH 8.0, 1 mM PMSF, and 1 mM benzamide-HCl, and snap-frozen in liquid nitrogen. Frozen pellets were lysed in 0.45 mL ChIP lysis buffer (50 mM HEPES-KOH pH 7.5, 500 mM NaCl, 1 mM EDTA, 1% Triton X-100, 0.1% deoxycholate, 0.1% SDS, 1 mM PMSF, 10 mM leupeptin, 5 mM pepstatin A, and Roche protease inhibitor cocktail) and lysed by bead-beating. Lysates were split to two tubes containing 280 mL lysate each and sonicated for 16 cycles (30 sec on, 1 min off, high output) using the Bioruptor (Diagenode). The lysates were then cleared by two consecutive spins at 16,100 g for 10 minutes. For ChIP, 300 μL lysate was diluted at 1:2/3 and incubated overnight with 10 μg antibody of HA. 20 μL magnetic beads were added and incubated for an additional 1.5 hours. Beads were then washed twice with ChIP lysis buffer, once with deoxycholate buffer (10 mM Tris-HCl, 0.25 M LiCl, 0.5% deoxycholate, 1 mM EDTA), and once with TE (50 mM Tris-HCl pH 8.0, 10 mM EDTA). Elution was performed with 2 consecutive 10 min incubations with 60 mL TES buffer (50 mM Tris-HCl pH 8.0, 10 mM EDTA, and 1% SDS) at 65°C. Reverse crosslinking was performed by further overnight incubation at 65°C. An equal volume of TE containing 1.25 mg/mL proteinase K was then added and incubated for 2 hours at 37°C. DNA was then column purified using the Qiagen PCR purification kit.
For constructing sequencing libraries, we followed instructions of the KAPA Hyper Prep Kit from Kapa Biosystems, and the quality and quantity of constructed libraries were determined using Agilent D1000 ScreenTape System and Invitrogen Qubit Fluorometer. The sequencing was performed by the UTSW Next Generation Sequencing Core Facility using the Illumina NextSeq 500 System.
Plotting growth curves
Cells cultured in YPL overnight were diluted to 0.1 of A600 in fresh YPL with or without 1 mM cysteine. Cell growth was monitored by absorbance reading at 600 nm using the BioTek Synergy 2 multi-mode microplate reader.
QUANTIFICATION AND STATISTICAL ANALYSIS
ChIP-seq data analysis
ChIP-seq reads were aligned against SacCer2 genome using BowTie2 (Langmead and Salzberg, 2012) with default parameters. ChIP-seq peaks were detected using MACS peak caller (Zhang et al., 2008) with default parameters and the peaks with length > 100 bp and P value < 10e(−50) were selected. CisGenome Browser (Ji et al., 2008) was used to visualize the ChIP-seq signals. To quantitatively compare signal intensities at peaks from different samples, we adopted the approach from the R package DynaMO (Kuang et al., 2018). Briefly, we first merged the peaks from different samples using the function "reduce". Next, we used the function "countreads", a simplified version of "countmotifsegreads" to calculate reads spanning the peaks and normalize by the total number of reads. Heat map was generated using the function "heatmap.2". Density of fold change was plot using "plot(density())".
Statistical analysis
The statistical significance in related figures was assessed using the Student’s t test. p values and n in column plots from Student’s t test were specified in corresponding figure legend.
DATA AND SOFTWARE AVAILABILITY
The primary western blotting data for this paper is deposited on Mendeley data available at https://doi:10.17632/3rjx6fsdmz.1. The accession number for the ChIP-seq data in this paper is GEO: GSE121635 and can be found in the Key Resources Table.
Supplementary Material
HIGHLIGHTS.
SAM depletion leads to sequential demethylation of PP2A and histones
Demethylation of PP2A spares SAM by limiting histone methylation
PP2A-regulated phosphorylation of demethylase Rph1 promotes binding to chromatin
H3K36 methylation is regulated by PP2ACdc55
ACKNOWLEDGMENTS
The authors acknowledge funding support from the Chilton Foundation and NIH K99GM129415 to C.Y., and NIH R01GM094314, the Welch Foundation (I-1797), and a HHMI-Simons Faculty Scholar Award to B.P.T.
Footnotes
Publisher's Disclaimer: This is a PDF file of an unedited manuscript that has been accepted for publication. As a service to our customers we are providing this early version of the manuscript. The manuscript will undergo copyediting, typesetting, and review of the resulting proof before it is published in its final citable form. Please note that during the production process errors may be discovered which could affect the content, and all legal disclaimers that apply to the journal pertain.
SUPPLEMENTAL INFORMATION
Supplemental information includes four figures.
REFERENCES
- Albuquerque CP, Smolka MB, Payne SH, Bafna V, Eng J, and Zhou H (2008). A multidimensional chromatography technology for in-depth phosphoproteome analysis. Mol Cell Proteomics 7, 1389–1396. [DOI] [PMC free article] [PubMed] [Google Scholar]
- Berger SL (2007). The complex language of chromatin regulation during transcription. Nature 447, 407–412. [DOI] [PubMed] [Google Scholar]
- Bernstein BE, Mikkelsen TS, Xie X, Kamal M, Huebert DJ, Cuff J, Fry B, Meissner A, Wernig M, Plath K, et al. (2006). A bivalent chromatin structure marks key developmental genes in embryonic stem cells. Cell 125, 315–326. [DOI] [PubMed] [Google Scholar]
- Bryant JC, Westphal RS, and Wadzinski BE (1999). Methylated C-terminal leucine residue of PP2A catalytic subunit is important for binding of regulatory Balpha subunit. Biochem J 339 (Pt 2), 241–246. [PMC free article] [PubMed] [Google Scholar]
- Carey BW, Finley LW, Cross JR, Allis CD, and Thompson CB (2015). Intracellular alpha-ketoglutarate maintains the pluripotency of embryonic stem cells. Nature 518, 413–416. [DOI] [PMC free article] [PubMed] [Google Scholar]
- Chowdhury R, Yeoh KK, Tian YM, Hillringhaus L, Bagg EA, Rose NR, Leung IK, Li XS, Woon EC, Yang M, et al. (2011). The oncometabolite 2-hydroxyglutarate inhibits histone lysine demethylases. EMBO Rep 12, 463–469. [DOI] [PMC free article] [PubMed] [Google Scholar]
- Dai Z, Mentch SJ, Gao X, Nichenametla SN, and Locasale JW (2018). Methionine metabolism influences genomic architecture and gene expression through H3K4me3 peak width. Nature communications 9, 1955. [DOI] [PMC free article] [PubMed] [Google Scholar]
- Dobosy JR, Fu VX, Desotelle JA, Srinivasan R, Kenowski ML, Almassi N, Weindruch R, Svaren J, and Jarrard DF (2008). A methyl-deficient diet modifies histone methylation and alters Igf2 and H19 repression in the prostate. Prostate 68, 1187–1195. [DOI] [PubMed] [Google Scholar]
- Fan J, Krautkramer KA, Feldman JL, and Denu JM (2015). Metabolic regulation of histone post-translational modifications. ACS Chem Biol 10, 95–108. [DOI] [PMC free article] [PubMed] [Google Scholar]
- Furuhashi H, Takasaki T, Rechtsteiner A, Li T, Kimura H, Checchi PM, Strome S, and Kelly WG (2010). Trans-generational epigenetic regulation of C. elegans primordial germ cells. Epigenetics Chromatin 3, 15. [DOI] [PMC free article] [PubMed] [Google Scholar]
- Gentry MS, Li Y, Wei H, Syed FF, Patel SH, Hallberg RL, and Pallas DC (2005). A novel assay for protein phosphatase 2A (PP2A) complexes in vivo reveals differential effects of covalent modifications on different Saccharomyces cerevisiae PP2A heterotrimers. Eukaryot Cell 4, 1029–1040. [DOI] [PMC free article] [PubMed] [Google Scholar]
- Greer EL, and Shi Y (2012). Histone methylation: a dynamic mark in health, disease and inheritance. Nature reviews. Genetics 13, 343–357. [DOI] [PMC free article] [PubMed] [Google Scholar]
- Howe FS, Fischl H, Murray SC, and Mellor J (2016). Is H3K4me3 instructive for transcription activation? BioEssays. [DOI] [PubMed] [Google Scholar]
- Huang Z, Cai L, and Tu BP (2015). Dietary control of chromatin. Current opinion in cell biology 34, 69–74. [DOI] [PMC free article] [PubMed] [Google Scholar]
- Janke R, Dodson AE, and Rine J (2015). Metabolism and epigenetics. Annual review of cell and developmental biology 31, 473–496. [DOI] [PMC free article] [PubMed] [Google Scholar]
- Jenuwein T, and Allis CD (2001). Translating the histone code. Science 293, 1074–1080. [DOI] [PubMed] [Google Scholar]
- Ji H, Jiang H, Ma W, Johnson DS, Myers RM, and Wong WH (2008). An integrated software system for analyzing ChIP-chip and ChIP-seq data. Nat Biotechnol 26, 1293–1300. [DOI] [PMC free article] [PubMed] [Google Scholar]
- Kloor D, and Osswald H (2004). S-Adenosylhomocysteine hydrolase as a target for intracellular adenosine action. Trends Pharmacol Sci 25, 294–297. [DOI] [PubMed] [Google Scholar]
- Klose RJ, Gardner KE, Liang G, Erdjument-Bromage H, Tempst P, and Zhang Y (2007). Demethylation of histone H3K36 and H3K9 by Rph1: a vestige of an H3K9 methylation system in Saccharomyces cerevisiae? Mol Cell Biol 27, 3951–3961. [DOI] [PMC free article] [PubMed] [Google Scholar]
- Klose RJ, and Zhang Y (2007). Regulation of histone methylation by demethylimination and demethylation. Nature reviews. Molecular cell biology 8, 307–318. [DOI] [PubMed] [Google Scholar]
- Kohli RM, and Zhang Y (2013). TET enzymes, TDG and the dynamics of DNA demethylation. Nature 502, 472–479. [DOI] [PMC free article] [PubMed] [Google Scholar]
- Kuang Z, Ji Z, Boeke JD, and Ji H (2018). Dynamic motif occupancy (DynaMO) analysis identifies transcription factors and their binding sites driving dynamic biological processes. Nucleic acids research 46, e2. [DOI] [PMC free article] [PubMed] [Google Scholar]
- Langmead B, and Salzberg SL (2012). Fast gapped-read alignment with Bowtie 2. Nat Methods 9, 357–359. [DOI] [PMC free article] [PubMed] [Google Scholar]
- Longtine MS, McKenzie A 3rd, Demarini DJ, Shah NG, Wach A, Brachat A, Philippsen P, and Pringle JR (1998). Additional modules for versatile and economical PCR-based gene deletion and modification in Saccharomyces cerevisiae. Yeast 14, 953–961. [DOI] [PubMed] [Google Scholar]
- Lu C, and Thompson CB (2012). Metabolic regulation of epigenetics. Cell metabolism 16, 9–17. [DOI] [PMC free article] [PubMed] [Google Scholar]
- Lu C, Ward PS, Kapoor GS, Rohle D, Turcan S, Abdel-Wahab O, Edwards CR, Khanin R, Figueroa ME, Melnick A, et al. (2012). IDH mutation impairs histone demethylation and results in a block to cell differentiation. Nature 483, 474–478. [DOI] [PMC free article] [PubMed] [Google Scholar]
- Mentch SJ, Mehrmohamadi M, Huang L, Liu X, Gupta D, Mattocks D, Gomez Padilla P, Ables G, Bamman MM, Thalacker-Mercer AE, et al. (2015). Histone Methylation Dynamics and Gene Regulation Occur through the Sensing of One-Carbon Metabolism. Cell metabolism 22, 861–873. [DOI] [PMC free article] [PubMed] [Google Scholar]
- Nguyen AT, and Zhang Y (2011). The diverse functions of Dot1 and H3K79 methylation. Genes & development 25, 1345–1358. [DOI] [PMC free article] [PubMed] [Google Scholar]
- Nishimura K, Fukagawa T, Takisawa H, Kakimoto T, and Kanemaki M (2009). An auxin-based degron system for the rapid depletion of proteins in nonplant cells. Nat Methods 6, 917–922. [DOI] [PubMed] [Google Scholar]
- Rechtsteiner A, Ercan S, Takasaki T, Phippen TM, Egelhofer TA, Wang W, Kimura H, Lieb JD, and Strome S (2010). The histone H3K36 methyltransferase MES-4 acts epigenetically to transmit the memory of germline gene expression to progeny. PLoS genetics 6, e1001091. [DOI] [PMC free article] [PubMed] [Google Scholar]
- Rice JC, and Allis CD (2001). Histone methylation versus histone acetylation: new insights into epigenetic regulation. Current opinion in cell biology 13, 263–273. [DOI] [PubMed] [Google Scholar]
- Schvartzman JM, Thompson CB, and Finley LWS (2018). Metabolic regulation of chromatin modifications and gene expression. The Journal of cell biology 217, 2247–2259. [DOI] [PMC free article] [PubMed] [Google Scholar]
- Shi X, Hong T, Walter KL, Ewalt M, Michishita E, Hung T, Carney D, Pena P, Lan F, Kaadige MR, et al. (2006). ING2 PHD domain links histone H3 lysine 4 methylation to active gene repression. Nature 442, 96–99. [DOI] [PMC free article] [PubMed] [Google Scholar]
- Shiraki N, Shiraki Y, Tsuyama T, Obata F, Miura M, Nagae G, Aburatani H, Kume K, Endo F, and Kume S (2014). Methionine metabolism regulates maintenance and differentiation of human pluripotent stem cells. Cell metabolism 19, 780–794. [DOI] [PubMed] [Google Scholar]
- Stanevich V, Jiang L, Satyshur KA, Li Y, Jeffrey PD, Li Z, Menden P, Semmelhack MF, and Xing Y (2011). The structural basis for tight control of PP2A methylation and function by LCMT-1. Molecular cell 41, 331–342. [DOI] [PMC free article] [PubMed] [Google Scholar]
- Sutter BM, Wu X, Laxman S, and Tu BP (2013). Methionine inhibits autophagy and promotes growth by inducing the SAM-responsive methylation of PP2A. Cell 154, 403–415. [DOI] [PMC free article] [PubMed] [Google Scholar]
- Swaney DL, Beltrao P, Starita L, Guo A, Rush J, Fields S, Krogan NJ, and Villen J (2013). Global analysis of phosphorylation and ubiquitylation cross-talk in protein degradation. Nat Methods 10, 676–682. [DOI] [PMC free article] [PubMed] [Google Scholar]
- Tang S, Fang Y, Huang G, Xu X, Padilla-Banks E, Fan W, Xu Q, Sanderson SM, Foley JF, Dowdy S, et al. (2017). Methionine metabolism is essential for SIRT1-regulated mouse embryonic stem cell maintenance and embryonic development. The EMBO journal 36, 3175–3193. [DOI] [PMC free article] [PubMed] [Google Scholar]
- Tolstykh T, Lee J, Vafai S, and Stock JB (2000). Carboxyl methylation regulates phosphoprotein phosphatase 2A by controlling the association of regulatory B subunits. The EMBO journal 19, 5682–5691. [DOI] [PMC free article] [PubMed] [Google Scholar]
- Tu BP, Mohler RE, Liu JC, Dombek KM, Young ET, Synovec RE, and McKnight SL (2007a). Cyclic changes in metabolic state during the life of a yeast cell. Proceedings of the National Academy of Sciences of the United States of America 104, 16886–16891. [DOI] [PMC free article] [PubMed] [Google Scholar]
- Tu S, Bulloch EM, Yang L, Ren C, Huang WC, Hsu PH, Chen CH, Liao CL, Yu HM, Lo WS, et al. (2007b). Identification of histone demethylases in Saccharomyces cerevisiae. The Journal of biological chemistry 282, 14262–14271. [DOI] [PMC free article] [PubMed] [Google Scholar]
- van Dijken JP, Bauer J, Brambilla L, Duboc P, Francois JM, Gancedo C, Giuseppin ML, Heijnen JJ, Hoare M, Lange HC, et al. (2000). An interlaboratory comparison of physiological and genetic properties of four Saccharomyces cerevisiae strains. Enzyme Microb Technol 26, 706–714. [DOI] [PubMed] [Google Scholar]
- Wagner EJ, and Carpenter PB (2012). Understanding the language of Lys36 methylation at histone H3. Nature reviews. Molecular cell biology 13, 115–126. [DOI] [PMC free article] [PubMed] [Google Scholar]
- Wei H, Ashby DG, Moreno CS, Ogris E, Yeong FM, Corbett AH, and Pallas DC (2001). Carboxymethylation of the PP2A catalytic subunit in Saccharomyces cerevisiae is required for efficient interaction with the B-type subunits Cdc55p and Rts1p. The Journal of biological chemistry 276, 1570–1577. [DOI] [PMC free article] [PubMed] [Google Scholar]
- Wu J, Tolstykh T, Lee J, Boyd K, Stock JB, and Broach JR (2000). Carboxyl methylation of the phosphoprotein phosphatase 2A catalytic subunit promotes its functional association with regulatory subunits in vivo. The EMBO journal 19, 5672–5681. [DOI] [PMC free article] [PubMed] [Google Scholar]
- Xiao M, Yang H, Xu W, Ma S, Lin H, Zhu H, Liu L, Liu Y, Yang C, Xu Y, et al. (2012). Inhibition of alpha-KG-dependent histone and DNA demethylases by fumarate and succinate that are accumulated in mutations of FH and SDH tumor suppressors. Genes & development 26, 1326–1338. [DOI] [PMC free article] [PubMed] [Google Scholar]
- Xu W, Yang H, Liu Y, Yang Y, Wang P, Kim SH, Ito S, Yang C, Wang P, Xiao MT, et al. (2011). Oncometabolite 2-hydroxyglutarate is a competitive inhibitor of alpha-ketoglutarate-dependent dioxygenases. Cancer Cell 19, 17–30. [DOI] [PMC free article] [PubMed] [Google Scholar]
- Ye C, Sutter BM, Wang Y, Kuang Z, and Tu BP (2017). A Metabolic Function for Phospholipid and Histone Methylation. Molecular cell 66, 180–193 e188. [DOI] [PMC free article] [PubMed] [Google Scholar]
- Ye C, and Tu BP (2018). Sink into the Epigenome: Histones as Repositories That Influence Cellular Metabolism. Trends in endocrinology and metabolism: TEM. [DOI] [PMC free article] [PubMed] [Google Scholar]
- Zhang Y, Liu T, Meyer CA, Eeckhoute J, Johnson DS, Bernstein BE, Nusbaum C, Myers RM, Brown M, Li W, et al. (2008). Model-based analysis of ChIP-Seq (MACS). Genome Biol 9, R137. [DOI] [PMC free article] [PubMed] [Google Scholar]
- Zhang Y, and Reinberg D (2001). Transcription regulation by histone methylation: interplay between different covalent modifications of the core histone tails. Genes & development 15, 2343–2360. [DOI] [PubMed] [Google Scholar]
- Zhang Y, Zhang Y, and Yu Y (2017). Global Phosphoproteomic Analysis of Insulin/Akt/mTORC1/S6K Signaling in Rat Hepatocytes. Journal of proteome research 16, 2825–2835. [DOI] [PMC free article] [PubMed] [Google Scholar]
Associated Data
This section collects any data citations, data availability statements, or supplementary materials included in this article.
Supplementary Materials
Data Availability Statement
The primary western blotting data for this paper is deposited on Mendeley data available at https://doi:10.17632/3rjx6fsdmz.1. The accession number for the ChIP-seq data in this paper is GEO: GSE121635 and can be found in the Key Resources Table.