Summary
The ability to monitor gene expression in experimental and clinical samples is an essential element of modern molecular biology and cell biology research. However with the advent of a systems biology approach toward understanding cell and cancer biology, analysis of expression of a single gene is no longer desirable. Today, multiplex analysis, where the expression of 8–100 genes can be monitored in one sample, has become a routine aspect of gene expression analysis. In this chapter the various assays systems commercially available for multiplex analysis of both RNA and protein will be discussed.
Keywords: Cytokine, mRNA, Ribonuclease protection, Flow cytometry, RNA, Multiplex, Antibody, PCR
1. Introduction
Cytokines are critical mediators of the host immune response and are produced by multiple cell types. The diversity in cytokine expression in response to inflammation and cancer is broad, and there is a continuing need to measure multiple cytokines in cell culture supernatants, serum, and plasma. Multiplexing RNA is based on either PCR or Ribonuclease Protection analysis with the formats for detecting the products differing and dependent upon the supplier. The technology for protein analysis involves either membrane-based arrays or flow cytometry, and both these approaches are dependent upon the specificity of the antibody pairs utilized. In this chapter, different commercial approaches for analyzing multiple cytokines in single samples at the protein and RNA levels will be described. An assay system that will not be discussed is the use of microarrays since this technology is widely utilized and is not quantitative. It should be noted that readers should consider their needs, sample size and availability of sufficient quantities of cells, RNA or serum/supernatants when considering the appropriate assay for their experimental system of choice.
2. RNA Analysis
2.1. RNAse Protection Assay
The first approach to multiplexing gene expression at the RNA level involved the use of RNAse protection. The Ribonuclease Protection Assay (RPA) is a sensitive and quantitative method and relies on the fact that RNA-RNA hybrids are resistant to digestion by the RNAses A and T1. Multiprobe template kits are based on the principle of selecting regions of the target genes that cross exon boundaries with each protected fragment having a distinct size (1, 2). Crossing exon boundaries eliminates the problems of DNA contamination unless the genes of interest lack introns. This assay has been commercialized with different approaches toward defining specific gene expression. The sensitivity of the assay does not approach that of RT-PCR (Reverse Transcriptase-Polymerase Chain Reaction), but this assay is easily quantitated and far more sensitive than traditional Northern blots. The following is a description of some of the assays now commercialized and readily available to research laboratories
2.1.1. BD-Pharmingen
BD-Pharmingen offered a large number of multigene template sets for the RPA. Sets could also be customized with the key element being that the sizes of the protected riboprobes are sufficiently different as to allow separation on polyacrylamide gels. The basic steps involved in the assay are: extraction of total cellular RNA, synthesis (T7 RNA polymerase) of the antisense RNA transcripts of the target genes utilizing a multiprobe template kit and DNAse 1 digestion of the templates, overnight hybridization of the radiolabeled antisense transcripts to the target cellular RNA, digestion of the hybridized RNA with ribonucleases, precipitation and resuspension of the protected RNAs, electrophoresis of the protected RNAs on a denaturing polyacrylamide gel, and autoradiography of the dried gel to visualize the protected RNAs (Fig. 1). For a detailed protocol, see (3). The assay is optimal with 5–10 μg of total cellular RNA, but 1 μg can be used with good results. The template set contains 8–12 target genes and two control genes, often L32 (ribosomal gene) and GAPDH, so the changes in target genes, such as cytokines, can be quantitated and compared based on levels of the control genes. A typical result is seen in Fig. 2. The sensitivity of this assay is between 106 and 2 × 10⁸ target mRNA molecules.
Fig. 1.
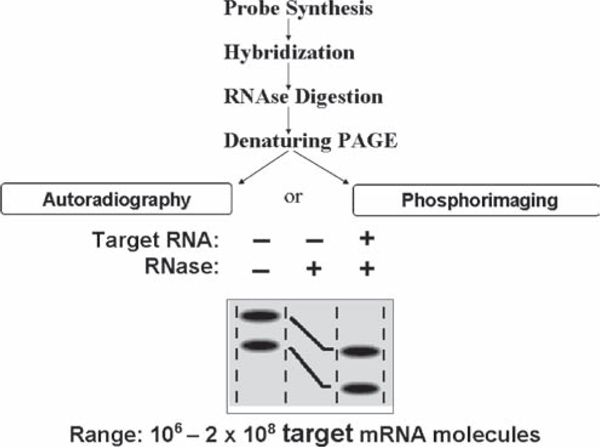
Schematic representation of the RPA assay steps (adapted from ref. 1).
Fig. 2.
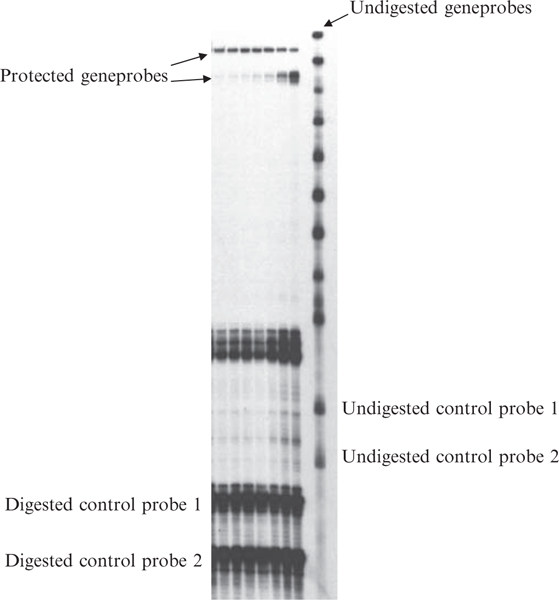
Typical result obtained utilizing the BD-Pharmingen RPA assay using probes labeled with 33P.
In this assay problems can arise at many stages including: failure to properly digest the templates after RNA synthesis, DNA contamination of the RNA, degraded RNA, incomplete RNAse digestion, product sizes too close. In addition, polymorphisms in genes may result in unexpected digestion of the RNA–RNA hybrid due to mismatched bases (4, 5). A typical result for the RPA utilizing radioactive probes appears in Fig. 2. In 2007, BD-Pharmingen no longer offered this product line.
2.1.2. High-Throughput Genomics
High-Throughput Genomics offers multiplexed assays for RNA expression (mRNA and microRNAs) based on the use of programmable arrays in a 96-well or 394-well microplate format (the ArrayPlate). This system measures up to 16 genes (including one or more housekeeper genes, as desired) in each well of a 96-well plate format, and any set of genes can be measured based on HTG’s probe design software. The company can perform analysis as a service or alternatively provide off-the-shelf arrays/custom arrays to the user (requiring the use of specific instrumentation for detection and analysis). For measuring mRNA and miRNA the assay utilizes a quantitative Nuclease Protection Assay (qNPA™) rather than PCR (6). There is no need to extract the RNA or to reverse transcribe or amplify it. Instead a lysis reagent is added to the sample, and then a hybridization protocol is performed that includes a step of nuclease digestion, which confers the quantitative stoichiometry onto the assay (Fig. 3). Hallmarks of qNPA are: (a) it is simple and permits high sample throughput (e.g., 15,000 or more samples/day using only a pipetting workstation) using standard microplate processing workstations and automation; (b) it is very precise and reproducible, with whole assay CVs (separately lysing and processing samples) averaging 10% which means changes of 1.2-fold or smaller are significant; (c) practical sensitivity is very high, permitting the use of 10,000 cells or fewer/sample (e.g., the 384-well assay typically uses 3,500 cells/sample), or permitting precise dose response measurements on genes that are at the level of 34 Ct when measured by PCR from 100 ng total RNA; (d) it can measure gene expression from virtually any sample without modifying the protocol, and this includes from formalin-fixed paraffin-embedded (FFPE) tissue, as well as from purified RNA. The ability to measure RNA from FFPE means that retrospective studies can be used to validate drug targets and biomarkers using archived clinical tissues (samples archived for 20 or more years) from patients where the outcome is known (7). The sensitivity of this assay is ~105 target mRNA molecules. A typical result is seen in Fig. 4.
Fig. 3.
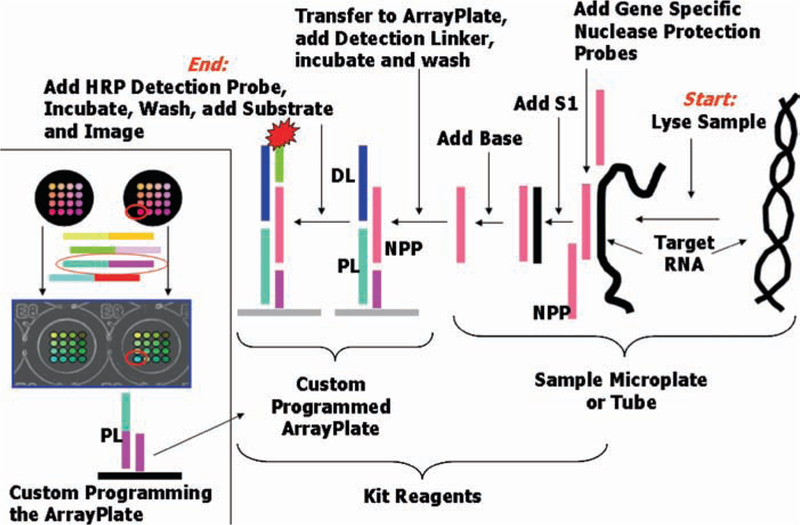
The general protocol for the high-throughput genomics RNAse protection assay.
Fig. 4.
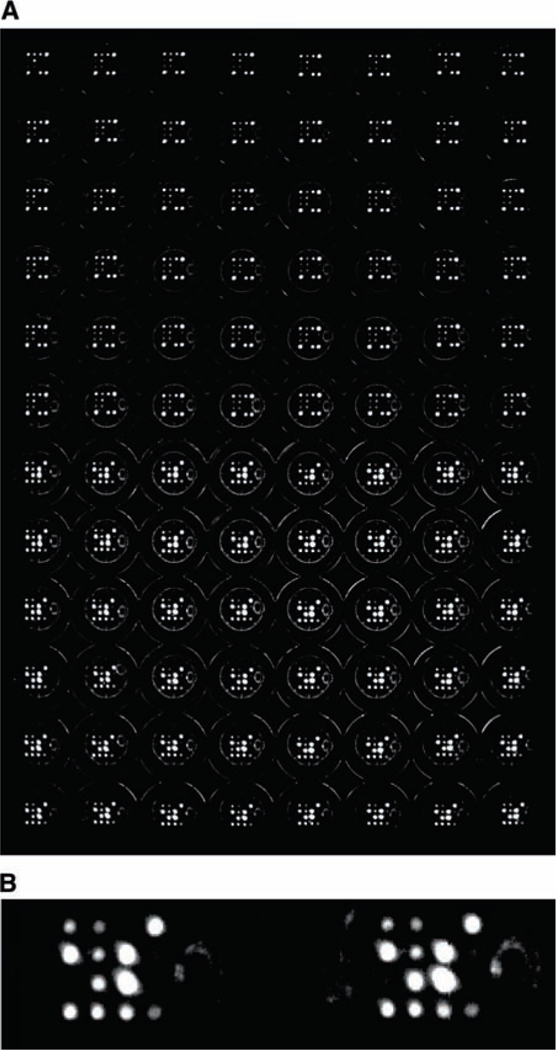
(A) A typical example of the results obtained from the HTG assay. (B) Enlargement of two wells in a typical assay.
2.1.3. Panomics
The RNA expression assay system offered from Panomics is based on Luminex technology (see later) and is designated as Quanti-Gene Plex. QuantiGene Plex 2.0 assays combine branched DNA (bDNA) signal amplification technology and xMAP® (multianalyte profiling) beads to enable simultaneous quantification of multiple RNA targets directly from cultured cell or whole blood lysates; fresh, frozen, or formalin-fixed, paraffin-embedded (FFPE) tissue homogenates; or purified RNA preparations. Branched DNA technology is a sandwich nucleic acid hybridization assay that provides a unique approach for RNA detection and quantification by amplifying the reporter signal rather than the sequence (8, 9) (Fig. 5). By measuring the RNA at the sample source, the assay avoids variations or errors inherent to extraction and amplification of target sequences. The xMAP system, developed by Luminex Corp, combines flow cytometry, fluorescent-dyed microspheres (beads), lasers, and digital signal processing to effectively allow multiplexing of up to 100 unique assays within a single sample. Automated probe design software allows for rapid and flexible design of probe sets for target genes in multiplex bDNA assay. The software algorithm automatically determines which regions of the target sequence can serve as annealing templates for capture extenders (CE), label extenders (LE), or blocking probes (BL). The potential nonspecific hybridization (NSH) events, which elevate assay background, are minimized through the computer screening of all CE–LE, CE-bDNA, CE-label probe, and LE-capture probe interactions. In general, six CEs and 10–15 LEs are designed for each target gene. The Probe set for a target gene is essentially the same for both single-plex and multiplex bDNA assay except that the portion of the CE probes hybridized with the capture probe changes according to the sequence of the capture probe. In QuantiGene Plex 1.0, each bDNA has 15 branches and each branch has three biotinylated-label probe binding sites, which gives in total 45-fold increase in signals. In QuantiGene Plex 2.0, which according to the manufacturer has a 400-fold increase in signal sensitivity, there is a preamplifier, which can be hybridized with 20 branches and each branch has 20 biotinylated-label probe binding sites (Fig. 5). In QuantiGene Plex 1.0, the sensitivity was approximately 5,000 copies of a transcript, while the company claims that the new assay is sensitive down to 1,000 copies/transcript. Both assays are linear over four logs of detection and utilize 1,000–50,000 cells/data point, depending on the abundance level of the target transcript. A typical result is seen in Fig. 6.
Fig. 5.
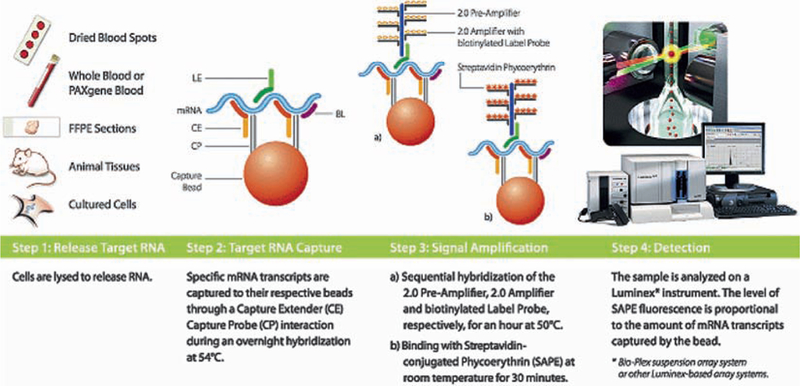
The workflow for QuantiGene Plex.
Fig. 6.
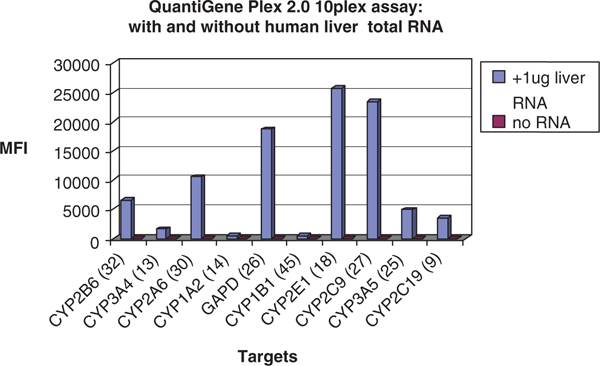
QuantiGene 2.0 10 plex assay tested with human liver total RNA.
2.2. PCR
The PCR-based assay has evolved as quantitative PCR assays (qPCR) have become more accessible to the research community. With the development of instrumentation capable of reading multiwell plates, the ability to quantitatively assay a number of genes at the same time has now become practical for the individual research laboratory.
2.2.1. SABiosciences
SABiosciences has developed a 96- and 384-well plate formatted qPCR assay that utilizes SYBR Green-based real-time PCR as the basis for the analysis. The key to the assay specificity is the design of the primers that generate single gene-specific amplicons. The basic steps of the assay are: isolation of RNA and DNAse treatment, cDNA synthesis, addition of the cDNA to the qPCR master mix, addition of the cDNA-master mix cocktail to the PCR Arrays, thermal cycling and analysis of the data. One microgram of total RNA is recommended for the assay, but the manufacturer claims that as little as 25 ng of RNA can be utilized. As with all RT-PCR systems, problem areas include incomplete or inefficient cDNA synthesis, degraded RNA, DNA contamination of the RNA, and inhibitors of the PCR reaction. However, each plate assay not only analyzes expression of 84 genes but also includes five housekeeping genes for normalization between plates and three controls for evaluation of DNA contamination and inhibitors of the RT or PCR steps (Fig. 7). A typical result is seen in Fig. 8.
Fig. 7.
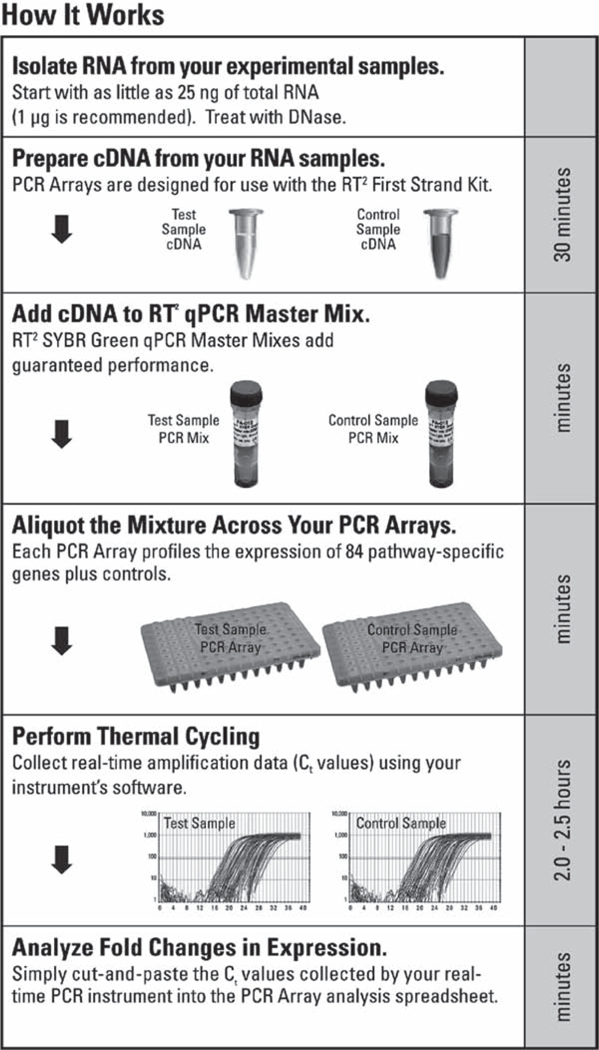
Workflow for the SABiosciences PCR multiplex array.
Fig. 8.
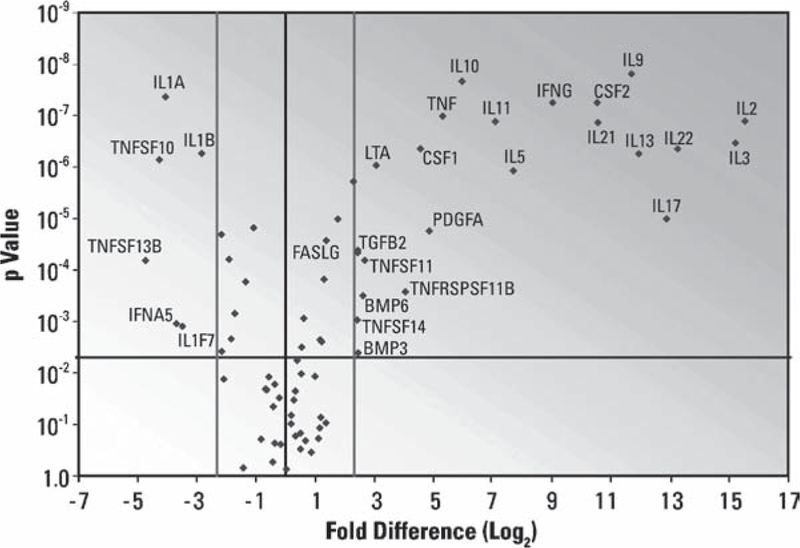
Typical Result from a SuperArray PCR Array. RNA isolated from resting PBMC or PBMC stimulated with PMA and ionomycin for 6 h were characterized on the Human Common Cytokine RT2 Profiler PCR Array. Log2 fold-changes in gene expression between stimulated and resting PBMC are plotted against t-test p-values to produce a “volcano plot.” Genes in the extreme upper left and right sections of the graph have larger, more statistically significant changes in gene expression. Thresholds: fold-change (light lines), > fivefold; statistical significance (dark line), p < 0.005.
3. Protein Analysis
There are many different formats for multiplex analysis of cytokines and other cellular proteins, and all formats depend upon anti-bodies specific for the target analyte. Many assays depend upon two antibodies, one for capture and one for detection with the detection method differing between suppliers. In addition the sensitivity and linear range of the assay differs between the targets within the multiplex assay and the platform utilized in the assay. As different suppliers may have different antibody pairs, this makes comparison between assays very difficult and has inhibited widespread clinical measurement of serum cytokine levels. Another issue with protein assays is the reagent utilized for standard curve development. Recombinant proteins produced in bacteria are not modified as the same proteins produced by eukaryotic cells, so values based on recombinant protein standard curves may not always reflect the levels actually present in serum or culture supernatants. Additional detection problems that can occur in antibody-based protein detection systems include (a) polymorphisms in the target genes that affect protein confirmation, thus changing their ability to be captured or recognized by the antibodies utilized in the assay (b) soluble receptors that may bind the analyte and mask the epitopes recognized by the capture or detection antibody or (c) binding of the analytes to the cell surface due to interactions with receptors or failure to be properly cleaved to permit release from the cell following expression.
3.1. Plate/Slide/Membrane-Based Assays
3.1.1. High-Throughput Genomics
A microplate-based multiplexed ELISA assay is also offered by HTG in its 96-well or 384-well ArrayPlate format, measuring up to 16 proteins in each well of the microplate, using an array printed in the bottom of each well. The same lysate that is used for measuring mRNA (as described earlier) can be used to measure proteins, making this a platform that can be used to measure mRNA, miRNA, and protein. An example of this is depicted in Fig. 9. The antibodies used for capture and detection are standard commercial antibodies, using biotinylated second antibody and HRP-labeled streptavidin for detection. The ArrayPlate Multiplexed ELISA is very sensitive and quantitative as the limit of quantification (LOQ) can be as low as 0.055 pg/ml (e.g., IL1-β) or 0.42 pg/ml (IL-8), values that are significantly more sensitive than standard ELISA. The ArrayPlate Multiplexed ELISA assay is available as kits and as sample testing services.
Fig. 9.
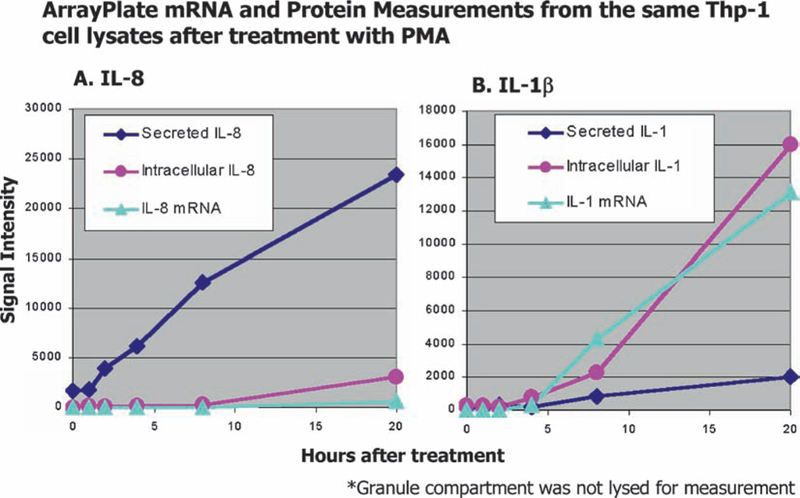
Typical data generated by the HTG Array plate. Media was assayed for secreted protein, and the cell pellets were lysed for measurement of protein and mRNA across of series of time points after treatment of Thp-1 cells (25,000/sample) with PMA to induce differentiation into monocytes. Half the sample lysate was used in an ArrayPlate programmed to measure mRNA, and half the sample used to measure protein in a separate ArrayPlate. Panel A depicts the time course of measurements of IL-8 protein secreted versus intracellular protein and message, Panel B, IL-1β.
3.1.2. MesoScale Technologies
MesoScale Diagnostics’ (MSD’s) Multi-Array® instruments use electrochemiluminescence (ECL) detection. ECL-based assays rely on a label that emits light when electrochemically oxidized at an electrode under appropriate chemical conditions. The labels used for biological detection, based on ruthenium(II)-tris-bipyridine derivatives, are stable and highly efficient. Electrochemical oxidation of Ru(bpy)32 + in the presence of tripropylamine (TPA), an ECL coreactant, leads to efficient generation of electrochemiluminescence via the high-energy electron transfer reaction between Ru(bpy)33 + and TPA radical (TPA∙) depicted in Fig. 10. Each label emits multiple photons during the excitation of ECL, thus contributing to the high sensitivity of ECL-based measurements.
Fig. 10.
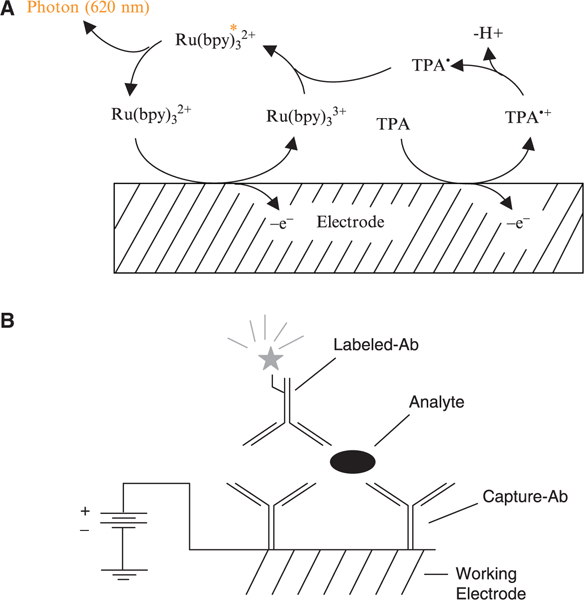
(A) Mechanism for ECL from Ru(bpy)32+in the presence of tripropylamine (TPA). (B) Illustration of a MultiArray ECL measurement showing, in the context of a sandwich immunoassay, the use of a working electrode as both a solid phase support for binding reagents and as the source of electrical energy for inducing ECL labels on the surface to emit luminescence.
MSD assays are carried out directly on the surface of single-use electrodes using the electrode surface as both a solid phase support for binding reagents and as the source of electrical energy for inducing ECL (Fig. 10). The instrumentation initiates and measures the ECL by applying a potential to the electrode surface and measuring the resultant ECL. By combining imaging-based detection of ECL and patterned arrays of binding reagents on electrode surfaces, MSD has been able to apply ECL detection to ultra high-throughput array-based multiplexed measurements while maintaining the excellent sensitivity, dynamic range, and robustness of ECL-based assays.
Specialized instrumentation (available from MSD) is required for this technology. Assays on these instruments are carried out on proprietary multiwell plates having integrated carbon-ink electrodes on the bottom of the wells. The electrodes act as both capture surfaces and energy sources for electrochemiluminescent excitation. The electrodes are formed by screen printing carbon ink on a Mylar substrate. A dielectric ink printed over the electrode defines one or more exposed regions of the working electrode or “spots.” Patterned arrays of antibodies are formed by printing submicroliter volumes of antibody solutions on these spots and allowing the antibodies to passively adsorb to the exposed carbon-ink electrode surface. Data analysis utilizes a high-throughput ECL imaging system that uses a cooled CCD camera and telecentric lens to image ECL generated in the Multi-Array plates. Sensitivity of this assay is broad from < 0.1 pg/ml for some cytokines (or roughly 100,000 protein molecules in a 20-μl sample) with a dynamic range for quantitation of 104–105. A typical result is seen in Fig. 11.
Fig. 11.
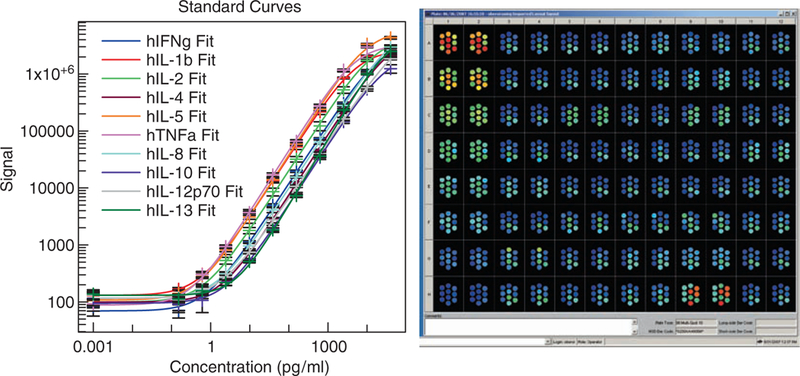
Typical results and standard curves generated with the MesoScale Discovery cytokine multiplex platform.
3.1.3. Schleicher and Schuell Bioscience (What-man)
In this assay from Whatman, the capture antibodies are placed onto nitrocellulose-coated glass slides (FAST Slide). The slide assay can detect 9–10 cytokines in each array (in triplicate) with 16 arrays/slide. This slide-based system requires very little sample (35–50 μl) and has a greater sensitivity and linear range (2.4–12,500 pg/ml depending upon the cytokine). A standard fluorescent scanner is required for data analysis. A flow diagram and typical result is shown in Fig. 12, and standard curves for cytokines utilizing this assay format are shown in Fig. 13.
Fig. 12.
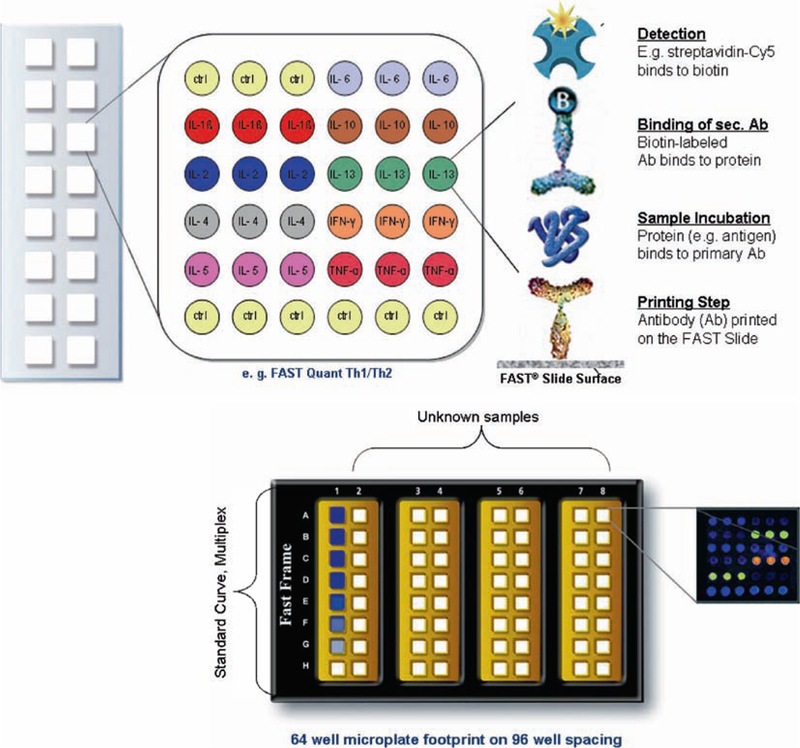
Array map and flow scheme for FASTQuant. Bottom of figure depicts four 16-pad FAST Slides in a FAST Frame and shows a typical array result.
Fig. 13.
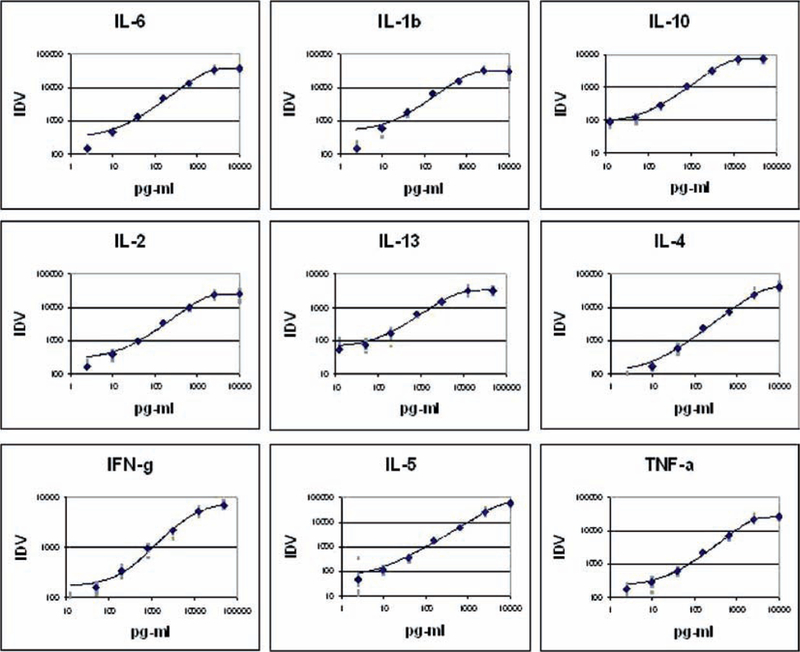
Typical simultaneous standard curves generated by FASTQuant. Standard curves for nine cytokines were generated using multiplexed standards on eight pads of a single FASTQuant slide. Data were calculated with Arrayvision-FAST software.
3.1.4. ThermoFischer
SearchLight® Chemiluminescent Protein Arrays from the Pierce division of ThermoFischer are plate-based, multiplex assays for the quantification of up to 16 different proteins per well. Arrays are created by spotting up to 16 different capture antibodies per well in each well of a 96-well plate using piezoelectric printing technology. Samples or calibrated protein standards are added to the wells of the plate, resulting in the capture of appropriate target proteins by the arrayed antibodies. Biotinylated antibodies are then added and specifically bind to the captured proteins. After the addition of streptavidin conjugated to horseradish per-oxidase (HRP), SuperSignal® ELISA Femto Chemiluminescent Substrate is added and reacts with the HRP to generate chemiluminescent signal. The entire plate is then imaged using a 16-bit CCD Imaging System to capture the chemiluminescent signal (Fig. 14). Protein concentrations in a sample are quantified by comparing the spot intensities for the unknown sample to the corresponding standard curves generated by the array software. Assay time is 2 h. A typical result for data generated in this format is shown in Fig. 15.
Fig. 14.
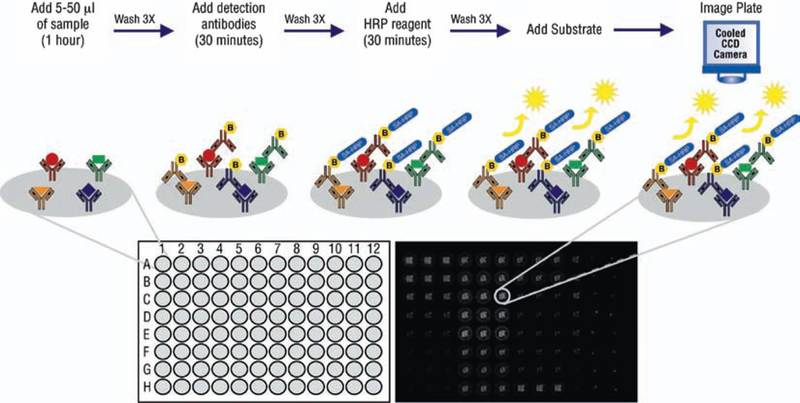
Schematic of a four-plex SearchLight® Array and image of a 16-plex SearchLight® Array. Each antibody spot captures a specific cytokine, chemokine, or other biomarker that is then detected with a biotinylated antibody cocktail followed by addition of streptavidin-horseradish peroxidase (SA-HRP) and SuperSignal® ELISA Chemiluminescent Substrate. The light produced from the HRP-catalyzed oxidation of the substrate is measured by imaging the plate with a cooled CCD camera. Standard curves are generated using a mixture of the recombinant array proteins. Protein concentrations in a sample are then quantified by comparing the intensity of the spots to the corresponding standard curve. SuperSignal® Technology is protected by U.S. patent # 6,432,662.
Fig. 15.
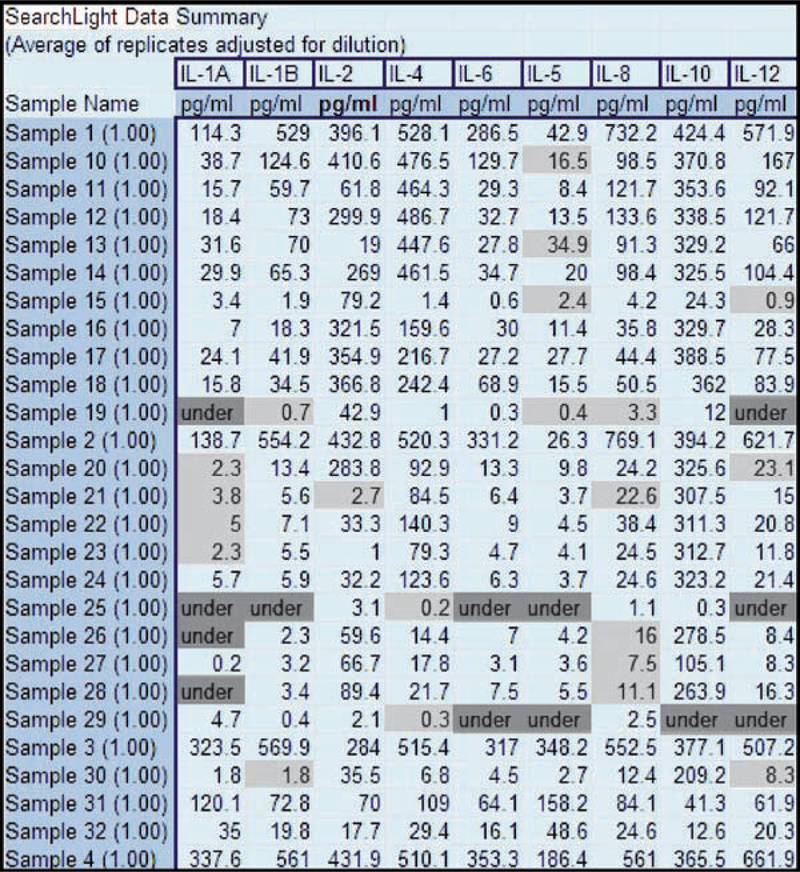
An example of a human cytokine profile generated with a custom human 9-plex SearchLight® Array in the SearchLight Sample Testing Service. Unknown samples were assayed for a custom human cytokine 9-plex. Results highlighted in dark grey represent samples with results below the lowest standard; samples highlighted in light grey represent duplicates with CV greater than 15%.
3.2. Flow Cytometry
3.2.1. Becton–Dlcklnson
The Becton Dickinson CBA (Cytometric Bead Array) Flex Set assay employs a series of particles with discrete fluorescence intensities in two different fluorescent parameters to simultaneously detect multiple soluble analytes from a single sample. The BD CBA system uses the sensitivity of amplified fluorescence detection by flow cytometry to measure soluble analytes with a particle-based immunoassay. The combined advantages of the broad dynamic range of fluorescence detection via flow cytometry, and the efficient capturing of analytes via suspended particles coated with distinct capture antibodies, enable the BD CBA system to use fewer sample dilutions to determine analyte concentration in substantially less time (compared to conventional ELISA). The specific capture beads are mixed with recombinant protein standards or test samples, then incubated with phycoerythrin (PE)-conjugated detection antibodies to form sandwich complexes. Following acquisition of sample data using the flow cytometer, the sample results are generated using FCAP (Flow Cytometry Analysis Program) Array™ software (Fig. 16). Every BD CBA kit is compatible with any flow cytometer that is equipped with a 488-nm laser and capable of detecting and distinguishing fluorescence emissions at 576 and 670 nm. The range of the assay is ~10–5,000 pg/ml with specific values varying for each protein of interest.
Fig. 16.
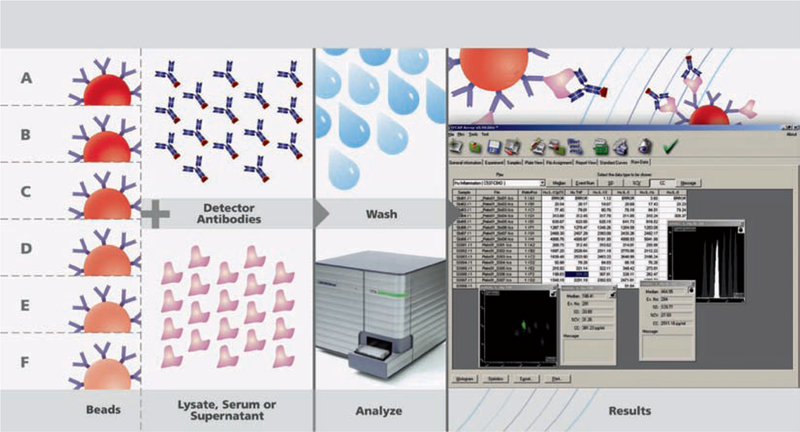
Schematic of the BD CBA protocol and analysis software.
3.2.2. Bender MedSystems
FlowCytomix, Bender MedSystems’ bead-based assays, follow the same principle as a sandwich immunoassay. Polystyrol beads display antigen-specific capture surfaces, with each bead being equivalent to an antibody-coated well in an ELISA plate. A mixture of beads coated with antibodies specific for different analytes is incubated with sample. Analytes in the sample bind to the antibodies coating the beads. A biotin-conjugated antibody mix is added, which binds to the analytes bound to the capture antibodies. Streptavidin-Phycoerythrin (PE) is added, which binds to the biotin conjugates. Flow cytometry is used to differentiate bead populations based on their size and fluorescent signature (Fig. 17).
Fig. 17.
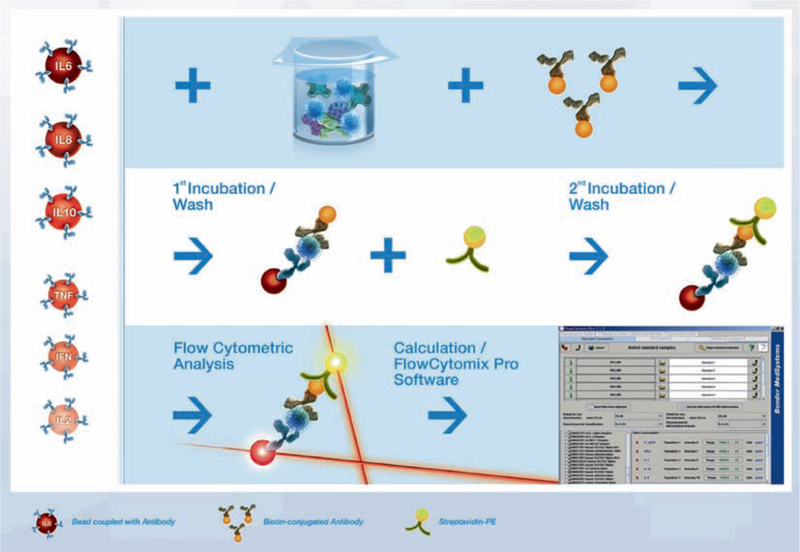
Principle of the FlowCytomix technology.
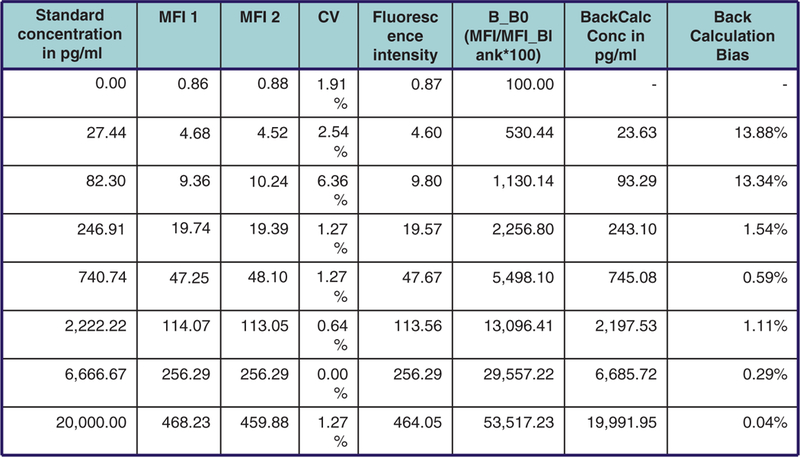
Each of two size populations (4 μm and 5 μm) has multiple subsets of beads, differentiated by varying intensities of an internal fluorescent dye. Each of the two sizes consists of bead sets, or bead populations, which are differentiated by varying intensities of an internal fluorescent dye. The dye can be excited by an Argon, He–Ne, or UV laser, emits at 690 nm (the far red spectrum), and is detected in the FL-3/FL-4 channel. The combination of the two different bead sizes and different internal dye intensities makes it possible to distinguish up to 20 bead sets in one fluorescent channel. Streptavidin-PE, which binds to the biotin conjugate, emits at 578 nm and is detected in the FL-2 channel, allowing the quantification of the analyte. The assay is compatible with most automated flow cytometers with an excitation capability of 488 nm. The assay has a dynamic range from 27 to 20,000 pg/ml depending upon the specific target. Flow-Cytomix assays are analyzed with FlowCytomix Pro software. Typical data generated for a cytokine standard curve are shown in Fig. 18A, B.
Fig. 18.
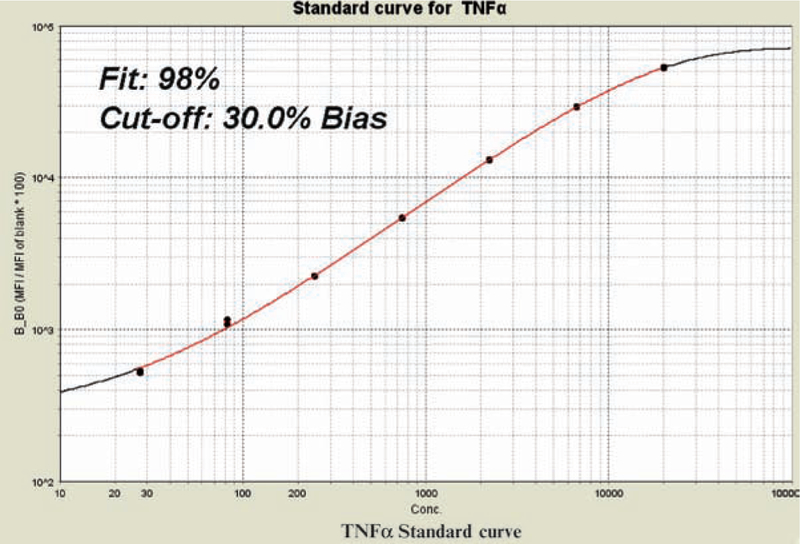
(A) FlowCytomix representative sigmoid standard curve established from duplicate determination of TNF-α. (B) The exact key data are given in a table below the standard curve graph. Standard curve and table are presented as given in FlowCytomix Pro 2.2 software pdf reports.
3.2.3. Luminex Technology
Luminex xMAP technology color-codes tiny beads, called microspheres, into 100 distinct sets. Each bead set can be coated with a reagent (e.g., anticytokine antibody) specific to a particular bioassay, allowing the capture and detection of specific analytes (e.g., cytokiners) from a sample. Within the Luminex compact analyzer, lasers excite the internal dyes that identify each microsphere particle and also any reporter dye captured during the assay (Fig. 19). Many readings are made on each bead set, further validating the results. In this way, xMAP technology allows multiplexing of up to 100 unique assays within a single sample, both rapidly and precisely. Many different companies offer cytokine multiplex assays based on this technology. These companies include Bio-Rad, BioSource (Invitrogen), Linco (Millipore), Panomics, R & D Systems, and Upstate (Millipore). Again, sensitivity for a specific target will depend upon the antibody pairs utilized. Typical data generated for cytokine standard curves with this technology are shown in Fig. 20.
Fig. 19.
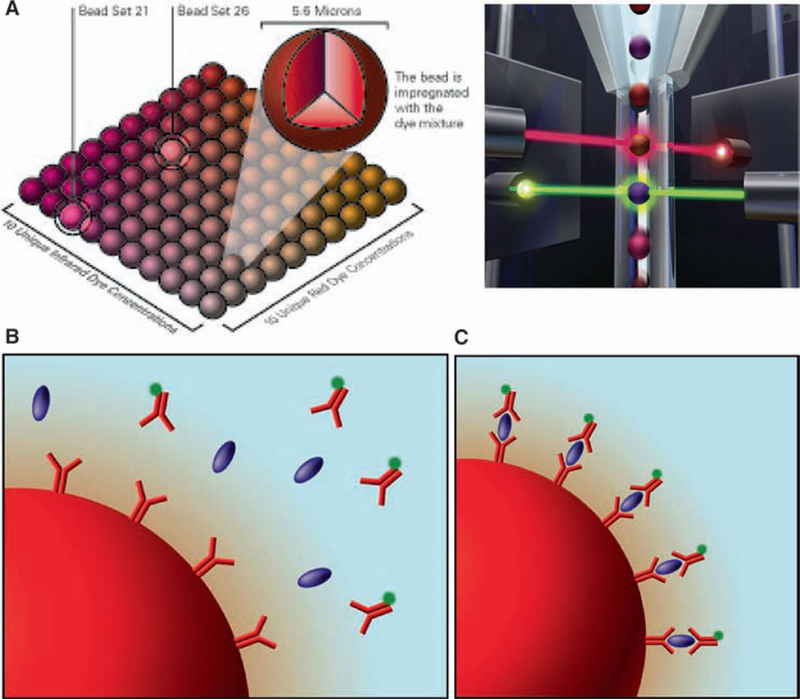
Principles of the Luminex Technology. (A) Color-coding enables each microsphere to be read individually and to be multiplexed with other microsphere sets. The lasers excite fluorescent dyes – red laser for bead classification and green laser for assay result. (B) Microspheres are easily coated with reagent that is specific to an analyte being tested (e.g., cytokine). As the microspheres are mixed with a biological sample, analytes are captured based on specific anti-body/protein recognition. (C) A fluorescent reporter tag conveys the quantitative results of each separate test.
Fig. 20.
Typical data generated utilizing Luminex technology.
4. Notes
Relevant websites: The following websites provide further information to the material covered in this chapter
BD-Pharmingen
http://www.bdbiosciences.com/external_files/pm/doc/manuals/live/web_enabled/01-81014-20-Ar.pdf
http://www.bdbiosciences.com/nvCategory.jsp?action = SELECT&form = formTree_catBean&item = 224182
http://www.bdbiosciences.com/pdfs/npas/04-7900030-18-Ar.pdf
Bender MedSystems
http://www.bendermedsystems.com/?p=47
High-Throughput Genomics
http://www.htgenomics.com/pages/scientific_technology/26.php
Panomics
http://www.panomics.com/product.phpiproduct_id=6
MesoScale Discovery
http://www.mesoscale.com/CatalogSystemWeb/WebRoot/products/assays/cytokines_multiplex.aspx
Luminex
http://www.luminexcorp.com/technology/index.html
SABiosciences
http://www.superarray.com/manuals/pcrarraywhitepaper.pdf
http://www.superarray.com/manuals/PCRArrayWhitePaper_App.pdf
ThermoFischer Scientific
http://www.piercenet.com/products/browse.cfm?fldID=36A25B3C-CCE5-4945-8953-2FBABA2A1DAA
Acknowledgments
I wish to thank Claudia Jursik (Bender MedSystems), Jeanne Gaylor (BD-Pharmingen), Bruce Seligmann (HighThroughput Genomics), Aiguo Zhang (Panomics), Pankaj Oberoi (MesoScale Discovery), Mark Coffey (Luminex), George Quellhorst (SABiosciences) and Linda Lavigne (Thermo Fischer Scientific) for the information described in this chapter.
Footnotes
Disclaimers
The content of this publication does not necessarily reflect the views or polices of the Department of Health and Human Services, nor does mention of trade names, commercial products, or organizations imply endorsement by the US government. The author has no financial interest either directly or indirectly in any of the companies mentioned in this chapter. There was no intentional omission of products from any specific company and the author apologizes to those companies whose products/technologies were not covered in this chapter.
References
- 1.Okada CY and Weissman IL (1989) Relative V beta transcript levels in thymus and peripheral lymphoid tissues from various mouse strains. Inverse correlation of I-E and Mls expression with relative abundance of several V beta transcripts in peripheral lymphoid tissues. J Exp Med 169, 1703–1719 [DOI] [PMC free article] [PubMed] [Google Scholar]
- 2.Kono DH, Baccala R, Balderas RS, Kovac SJ, Heald PW, Edelson RL, and Theofilo-poulos AN (1992) Application of a multiprobe RNase protection assay and junctional sequences to define V beta gene diversity in Sezary syndrome. Am J Pathol 140, 823–830 [PMC free article] [PubMed] [Google Scholar]
- 3.Young HA, Subleski JJ, and Krebs SM (2003) Multiprobe ribonuclease protection assay for simultaneous measurement of mRNA expression of 8–12 genes Curr Protocols Immunol Unit 10.29.1–10.29.15, Wiley, Hoboken, NJ: [DOI] [PubMed] [Google Scholar]
- 4.Luckow B, Maier H, Chilla S, and Perez de Lema G (2000) The mcK-5 multiprobe RNase protection assay kit can yield erroneous results for the murine chemokines IP-10 and MCP-1. Anal Biochem 286, 193–197 [DOI] [PubMed] [Google Scholar]
- 5.Hallensleben W, Biro L, Sauder C, Hausmann J, Asensio VC, Campbell IL, and Staeheli P (2000) A polymorphism in the mouse crg-2/IP-10 gene complicates chemokine gene expression analysis using a commercial ribonuclease protection assay. J Immunol Methods 234(1–2), 149–151 [DOI] [PubMed] [Google Scholar]
- 6.Martel RR, Botros IW, Rounseville MP, Hinton JP, Staples RR, Morales DA, Farmer JB, and Seligmann BE (2002) Multiplexed screening assay for mRNA combining nuclease protection with luminescent array detection. Assay Drug Dev Technol 1, 61–71 [DOI] [PubMed] [Google Scholar]
- 7.Robin Roberts R, Sabalos C, Martel R, LeBlanc M, Unger J, Botros I, Seligmann B, Miller T, Grogan T, and Rimsza L (2007) Quantitative nuclease protection assay in paraffin embedded tissue replicates prognostic microarray gene expression in diffuse large B cell lymphoma. Lab Invest 87, 979–997. Published on-line August 13 [DOI] [PubMed] [Google Scholar]
- 8.Zhang A, Pastor L, Nguyen Q, Luo Y, Yang W, Flagella M, Chavli R, Bui S, Nguyen CT, Zheng Z, He W, McMaster G, and Witney F (2005) Small interfering RNA and gene expression analysis using a multiplex branched DNA assay without RNA purification J Biomol Screen 10, 549–556 [DOI] [PubMed] [Google Scholar]
- 9.Flagella M, Bui S, Zheng Z, Nguyen CT, Zhang A, Pastor L, Ma Y, Yang W, Craw-ford KL, McMaster GK, Witney F, and Luo Y (2006) A multiplex branched DNA assay for parallel quantitative gene expression profiling. Anal Biochem 352, 50–60 [DOI] [PubMed] [Google Scholar]


