Abstract
BACKGROUND
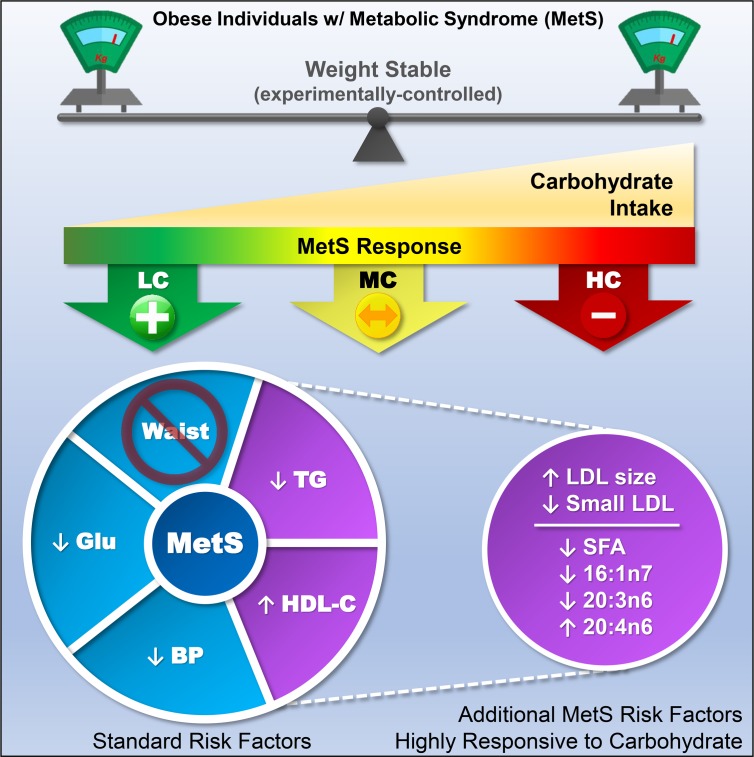
Metabolic syndrome (MetS) is highly correlated with obesity and cardiovascular risk, but the importance of dietary carbohydrate independent of weight loss in MetS treatment remains controversial. Here, we test the theory that dietary carbohydrate intolerance (i.e., the inability to process carbohydrate in a healthy manner) rather than obesity per se is a fundamental feature of MetS.
METHODS
Individuals who were obese with a diagnosis of MetS were fed three 4-week weight-maintenance diets that were low, moderate, and high in carbohydrate. Protein was constant and fat was exchanged isocalorically for carbohydrate across all diets.
RESULTS
Despite maintaining body mass, low-carbohydrate (LC) intake enhanced fat oxidation and was more effective in reversing MetS, especially high triglycerides, low HDL-C, and the small LDL subclass phenotype. Carbohydrate restriction also improved abnormal fatty acid composition, an emerging MetS feature. Despite containing 2.5 times more saturated fat than the high-carbohydrate diet, an LC diet decreased plasma total saturated fat and palmitoleate and increased arachidonate.
CONCLUSION
Consistent with the perspective that MetS is a pathologic state that manifests as dietary carbohydrate intolerance, these results show that compared with eucaloric high-carbohydrate intake, LC/high-fat diets benefit MetS independent of whole-body or fat mass.
TRIAL REGISTRATION
ClinicalTrials.gov Identifier: NCT02918422.
FUNDING
Dairy Management Inc. and the Dutch Dairy Association.
Keywords: Metabolism
Keywords: Lipoproteins, Obesity
Compared with equal-calorie high-carbohydrate diets, low-carbohydrate/high-fat diets benefit metabolic syndrome independently of whole-body or fat mass.
Introduction
The codification of metabolic syndrome (MetS) as a clustering of risk factors 3 decades ago (1) is now recognized as a turning point in our understanding of metabolism as it pertains to the clinical states of obesity, diabetes, and cardiovascular disease (CVD). Since then, the prevalence of MetS and obesity has increased in parallel to more than 1 in 3 adults in the United States (2, 3). Over the same period, there was a substantial increase in the absolute intake of carbohydrate, a dietary pattern temporally associated with the marked rise in obesity and MetS (4) and increased total mortality rates across multiple countries (5). Hyperinsulinemia is strongly linked to MetS pathogenesis and risk for CVD (6). Carbohydrate intake stimulates insulin secretion, which promotes fat storage and strongly inhibits adipose tissue lipolysis and fatty acid oxidation. Although not definitive, these observations point to a credible role of high-carbohydrate (HC) intake in the pathogenesis of MetS.
If an HC intake exacerbates MetS, the corollary implies that carbohydrate restriction may be therapeutic. A series of low-carbohydrate (LC) diet studies led us to the conclusion that improvement in MetS is intimately connected with carbohydrate restriction (7, 8). Nevertheless, traditional views continue to emphasize excess energy intake and obesity as the cause of MetS and reduced-fat and low-calorie diets as the treatment (9). Separating the effects of carbohydrate restriction from weight loss is challenging, as one affects the other and both have an impact on diet-induced response in atherogenic dyslipidemia (10).
To test the robustness of the hypothesis that carbohydrate intake has a primary role in the expression of MetS independent of weight loss, it is necessary to precisely control energy intake because free-living LC diets often result in reduced caloric intake and substantial weight loss (11). In this investigation, we prescribed energy intake and fed research participants controlled diets that maintained body mass, thereby eliminating changes in body mass and waist circumference (a central component of MetS) as factors influencing expression of the MetS phenotype. Participants who were obese with a diagnosis of MetS consumed 3 defined diets consisting of LC, moderate (MC), and HC in a randomized crossover manner. All diets were eucaloric and isonitrogenous with a relatively high amount of cheese, which allowed us to specifically test whether dietary carbohydrate per se is a control element in the pathogenesis of MetS independent of body mass and protein status. Because LC diets that emphasize natural foods are higher in total and saturated fatty acids (SFAs), there is concern regarding plasma LDL-C responses and perceived harmful effects on CVD risk, although this view is controversial. We therefore determined traits strongly linked to MetS including LDL subclass phenotype (12), accumulation of circulating SFAs (13, 14), palmitoleic acid (16:1n7) (15–17), and other fatty acid species associated with diabetes, CVD, and mortality (18, 19).
Results
Diet interventions.
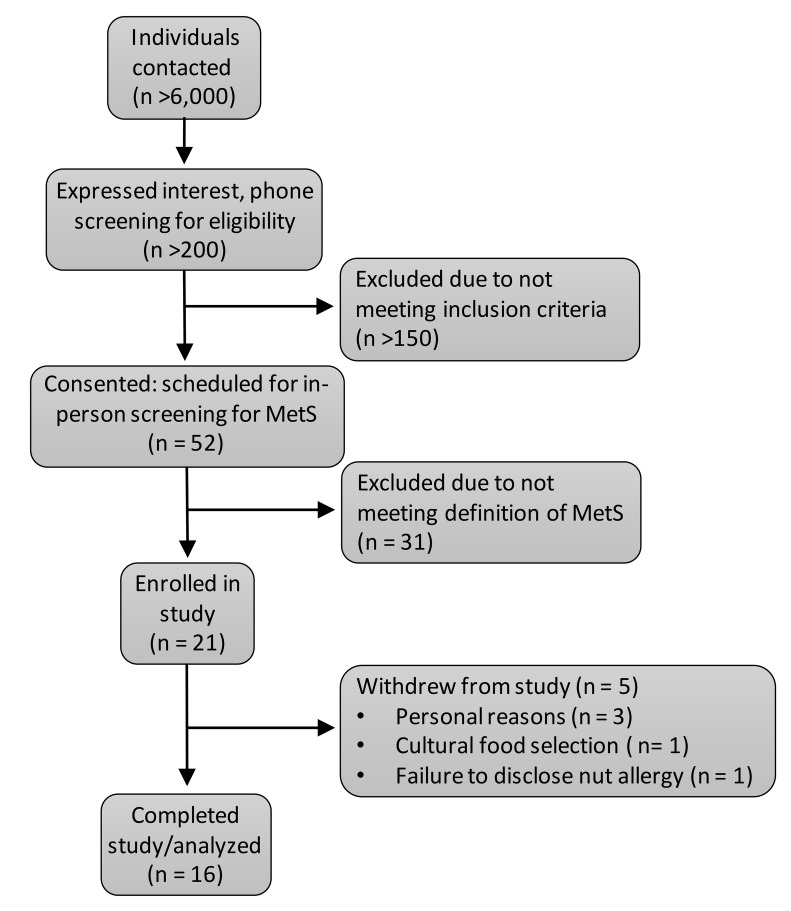
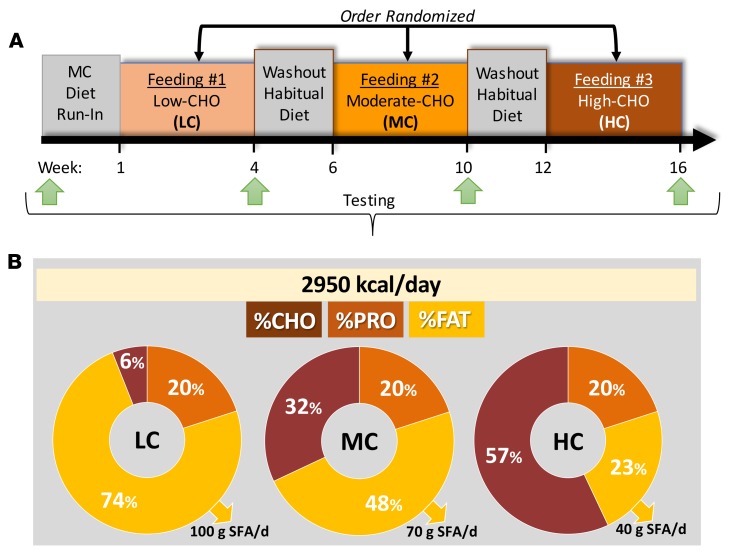
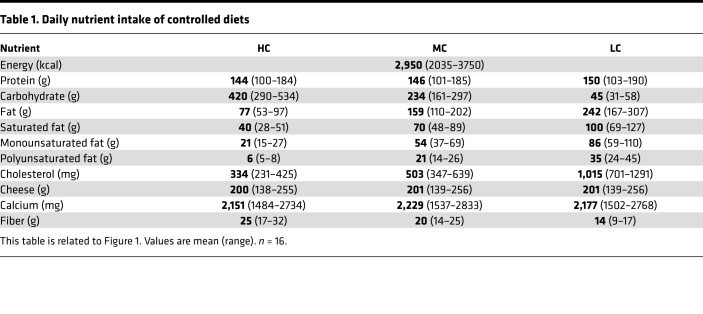
To investigate the role of diets varying in carbohydrate on markers of MetS, we fed women (n = 6) and men (n = 10) who were obese (mean ± SD age 41.3 ± 10.7 years, BMI 39.3 ± 8.3 kg/m2) and met at least 3 of 5 standard criteria for MetS (Figure 1) defined diets that contained LC, MC, and HC (Figure 2A, Table 1, and Supplemental Table 1; supplemental material available online with this article; https://doi.org/10.1172/jci.insight.128308DS1). Initially, subjects were fed a 2-week run-in MC diet to determine a eucaloric level that would stabilize body mass and be used for all feeding periods. The 3 experimental diets were eucaloric and consumed by all participants in a crossover and balanced-order manner to avoid interindividual differences in response to diet. Each controlled diet was 4 weeks in duration and separated by a 2-week washout period. Thus, the total length of the study for a participant was 16 weeks (Figure 2A). All food was weighed to the nearest 0.1 g and provided to participants to avoid errors in quantifying nutrient intake observed in free-living studies. To maintain body mass, the average total energy intake was nearly 3,000 kcal/day with 1 subject requiring as much as 3,750 kcal/day (Table 1). Daily protein intake (20% energy) was constant across all feeding periods. The percentage of carbohydrate varied on the LC, MC, and HC diets (6%, 32%, and 57% energy, respectively) and fat was adjusted proportionally (74%, 48%, and 23% energy, respectively) (Figure 2B). Total SFA content of the LC, MC, and HC diets was 100.2 ± 20.5, 69.9 ± 14.3, and 40.2 ± 8.2 g/day, respectively. An example daily meal plan for each diet is provided in Supplemental Table 1.
Figure 1. Participant flow through the study.
Figure 2. Overview of study design and experimental diets.
(A) Experimental approach. (B) Macronutrient distribution and daily saturated fat intake of controlled diets.
Table 1. Daily nutrient intake of controlled diets.
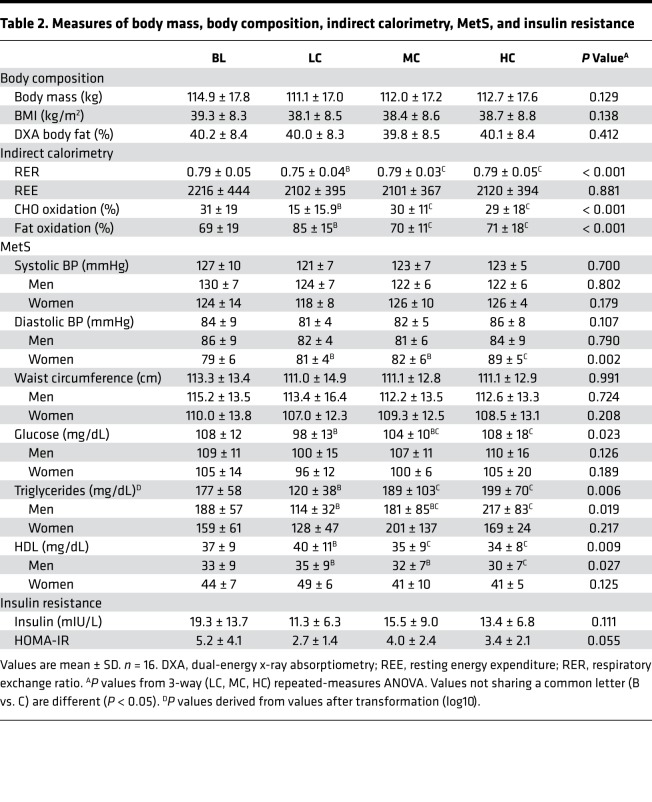
Subjects who were obese at baseline with a mean whole-body fat percentage of 40.2% and BMI just under the threshold for morbidly obese (40 kg/m2). As designed, there were no significant changes in body mass, whole-body composition by dual-energy x-ray absorptiometry, and waist circumference over the intervention (Table 2). Although body mass was stable, MetS often manifests in increased abdominal adiposity and hepatic fat content. To examine if these abnormal lipid accumulation patterns were affected by carbohydrate manipulation independent of body mass, we measured visceral adipose tissue (VAT) and liver fat by MRI. There was no difference in VAT or liver fat after the LC, MC, and HC diets (Supplemental Table 2). At baseline, the mean hepatic fat was 13.9% and was above 5% in all but 1 person, a suggested threshold for nonalcoholic fatty liver disease. There was 1 person who had the highest liver fat content at baseline (26.8%) who showed marked variability across diets. When this individual was removed from the study, there was a trend for lower liver fat after the LC diet (9.7%) than the MC (10.1%) and HC (11.5%) diets, respectively (P = 0.072).
Table 2. Measures of body mass, body composition, indirect calorimetry, MetS, and insulin resistance.
An LC diet enhances fat oxidation and rapidly reverses MetS in the majority of people independent of weight loss.
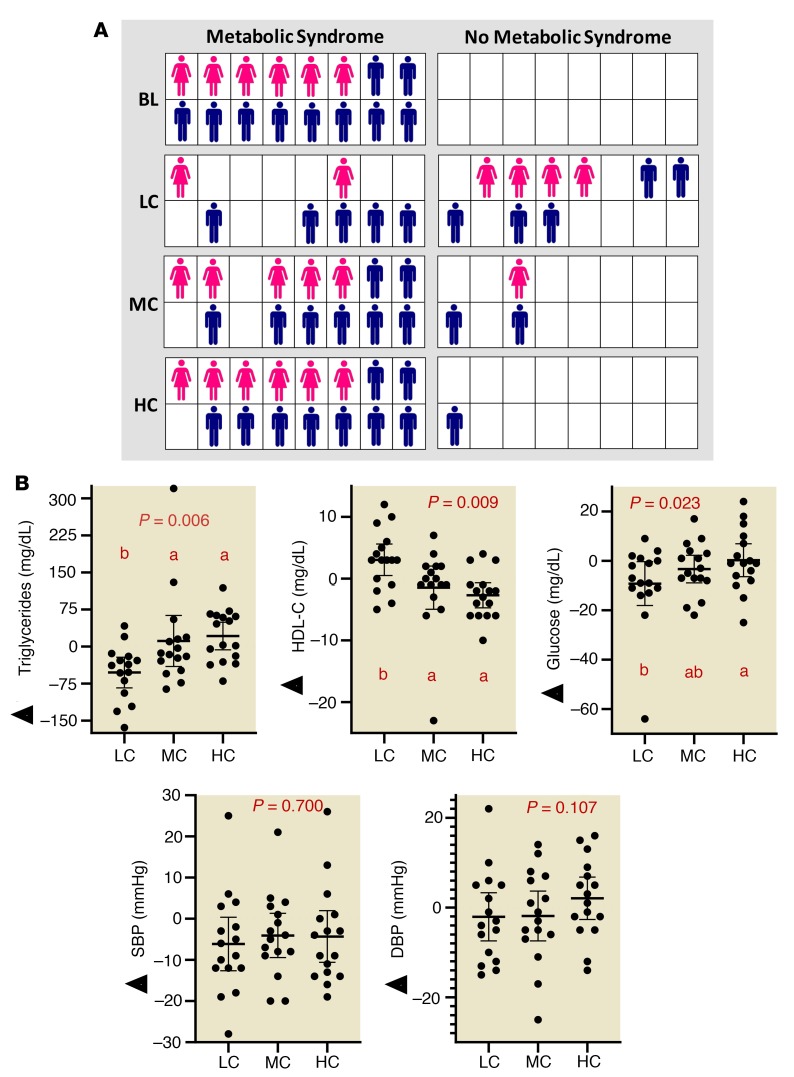
Although there was no difference in resting metabolic rate across each of the 4-week diets, there was a significantly lower respiratory exchange ratio indicating greater reliance on fat oxidation after the LC diet (P < 0.001) (Table 2). At baseline, all subjects had MetS as defined by the WHO, meeting 3 out 5 criteria (waist circumference, BP, HDL-C, glucose, and triglycerides). The number of participants with 3, 4, and 5 MetS characteristics was 7, 6, and 3, respectively (Supplemental Table 3). More than half the participants no longer met criteria for MetS after 4 weeks of the LC diet (9 of 16), whereas reversal of MetS occurred in only 3 of 16 people after MC and 1 of 16 after the HC diet (Figure 3A). Additional details on the specific MetS criteria present in each participant after each diet is shown in Supplemental Table 3. Triglycerides decreased (P = 0.006 from repeated-measures ANOVA after the LC, MC, and HC diets) and HDL-C increased (P = 0.009) more on the LC diet (P = 0.009). However, the HDL-C response was not of sufficient magnitude in most participants to exceed the diagnostic threshold for MetS (Figure 3B and Table 2). Glucose levels were lower on the LC than HC diets, but there was no significant difference in fasting insulin between diets (P = 0.111). Insulin resistance estimated from fasting glucose and insulin measures tended to be lower after the LC than the MC diet but was not different from the HC diet (Table 2). Neither systolic nor diastolic BP showed a significant diet effect. There was a small decrease relative to baseline that was enough in magnitude to bring this measure below the threshold for MetS in 14, 9, and 5 participants after the LC, MC, and HC diets, respectively (Supplemental Table 3). Women showed a more consistent decrease in diastolic BP after the LC diet than men (Table 2).
Figure 3. A eucaloric weight-stable LC diet rapidly reverses MetS in individuals who are obese, independent of weight loss.
(A) Individual diagnosis of MetS after LC, MC, and HC diets. Women are represented as pink figures and men are in blue. (B) Change in criteria for MetS relative to baseline after LC, MC, and HC diets. Circles represent individual participants, the thick line is the mean, and thin lines are 95% CIs. P value from 3-way (LC, MC, HC) repeated-measures ANOVA. Values not sharing a common letter are different (P < 0.05). All data n = 16.
A LC diet increases LDL size and decreases small, dense LDL particles independent of LDL-C concentration.
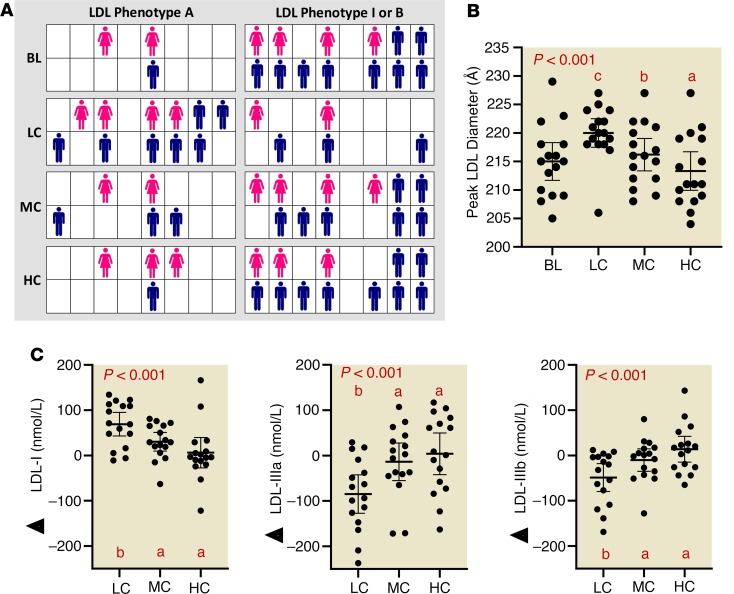
At baseline, serum LDL-C was in the normal range and remained stable over the 3 diets (Supplemental Table 4). In order to probe deeper into the effects of carbohydrate on the atherogenic dyslipidemia of MetS, we measured circulating lipoprotein particle subclasses using an ion mobility method. A predominance of small, dense LDL particles is referred to as phenotype B, a trait commonly associated with the dyslipidemia of MetS, whereas a greater proportion of large, buoyant LDL particles is called phenotype A. There is also an intermediate phenotype I. Most participants were phenotype B or intermediate at baseline with only 3 of 16 phenotype A. After the LC diet, two-thirds of participants were phenotype A and only 1 remained phenotype B (Figure 4A). Carbohydrate restriction resulted in a stepwise increase in mean peak LDL particle diameter (Figure 4B), in association with reduced concentrations of small LDL particles, increased levels of large LDL (Figure 4C), and lower concentrations of all VLDL particles (Supplemental Table 4 and Supplemental Figure 1). There were no changes in HDL subclasses (Supplemental Table 4). Peak LDL diameter was not significantly associated with LDL-C concentration.
Figure 4. An LC diet improves LDL phenotype independent of weight loss and LDL-C concentration.
(A) Individual characterization of LDL phenotype (A, I, and B). Women are represented as pink figures and men are in blue. (B) Peak LDL diameter responses to LC, MC, and HC diets. (C) Change in lipoprotein particle concentrations from largest (LDL-I) to smaller (LDL-IIIa and IIIb) relative to baseline after LC, MC, and HC diets. Circles represent individual participants, the thick line is the mean and thin lines are 95% CIs. P value from 3-way (LC, MC, HC) repeated-measures ANOVA. Values not sharing a common letter are different (P < 0.05). All data n = 16.
Higher saturated fat intake in the context of an LC diet decreases circulating saturated fatty acids and 16:1n7.
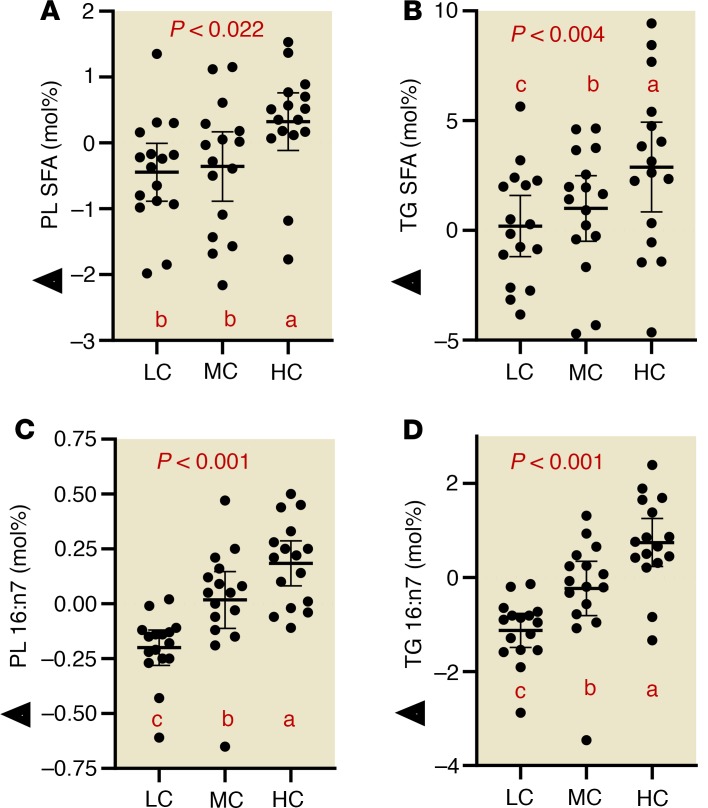
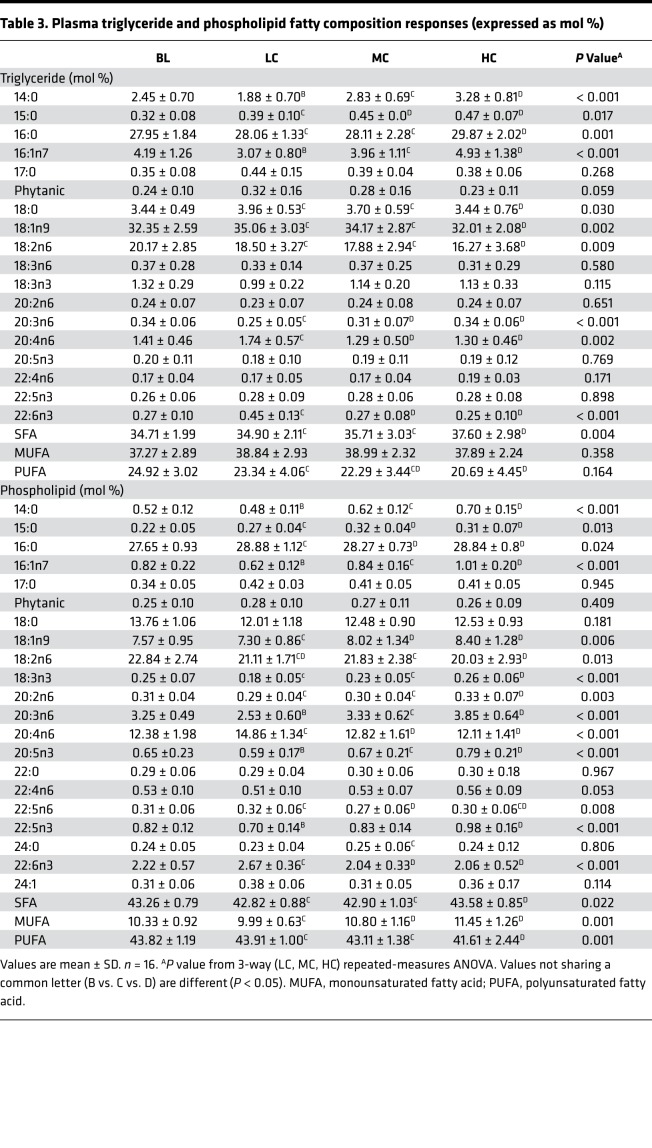
To investigate how diets varying in carbohydrate and SFAs affect the proportion of circulating SFAs, we isolated triglycerides (TGs) and phospholipids (PLs) from plasma to assess the relative abundance of fatty acids. In circulating PLs (Figure 5A) and TGs (Figure 5B), HC intake was associated with increased total SFA compared with the LC diet, mainly attributed to higher levels of 14:0, 15:0, and 16:0 (TG only) (Table 3). The lower proportion of SFA in the context of LC intake occurred despite the fact the LC diet contained 2.5 times more SFA (i.e., 100 vs. 40 g/day). As dietary carbohydrate decreased, there was a stepwise decrease in 16:1n7 in both PL (Figure 5C) and TG (Figure 5D), independent of dietary sequence. There was a significant correlation between plasma TG 16:1n7, a surrogate of de novo lipogenesis and liver fat (Supplemental Figure 2).
Figure 5. Despite being higher in saturated fat, carbohydrate-restricted diets decrease plasma total saturated fatty acids.
(A and B) Saturated fatty acid responses (normalized to baseline values) in PLs and TGs. (C and D) Palmitoleic responses (normalized to baseline values) in plasma PLs and TGs. Circles represent individual participants, the thick line is the mean and thin lines are 95% CIs. P value from 3-way (LC, MC, HC) repeated-measures ANOVA. Values not sharing a common letter are different (P < 0.05). All data n = 16.
Table 3. Plasma triglyceride and phospholipid fatty composition responses (expressed as mol %).
Carbohydrate restriction increases plasma arachidonic acid and decreases dihomo-γ-linolenic acid.
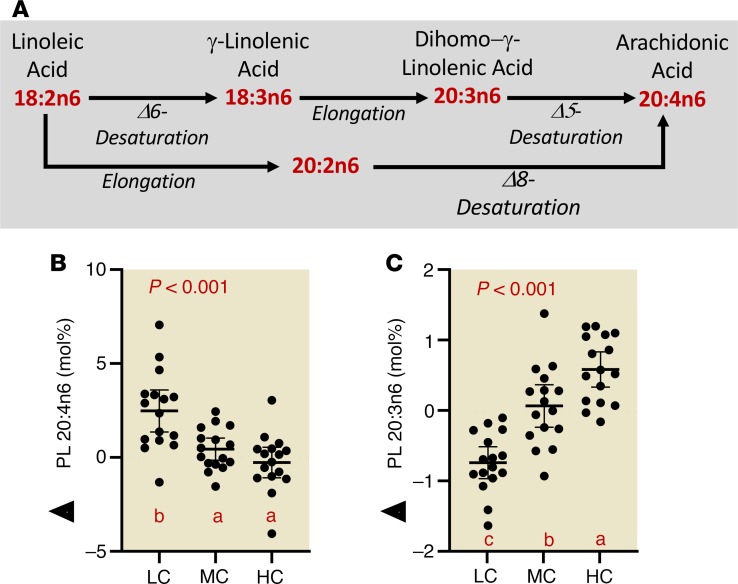
In further exploration of changes in fatty acid composition, we noted striking effects of diets varying in carbohydrate on omega-6 polyunsaturated fatty acid metabolism (Figure 6A). As dietary carbohydrate decreased, there was a consistent increase in plasma PL arachidonic acid (20:4n6) (Figure 6B), while its immediate biosynthetic precursor dihomo-γ-linolenic acid (DGLA, 20:3n6) uniformly decreased (Figure 6C). Linoleic acid (18:2n6), the primary dietary essential omega-6 fatty acid precursor of the anabolic pathway leading to 20:4n6, showed little change (Table 3). HC intake increased eicosadienoic acid (20:2n6), an intermediate in an alternative pathway from linoleic to 20:4n6. A similar pattern of effects with LC intake on these omega-6 fatty acids occurred in the TG fraction. Also of note, the proportions of the final n3 product docosahexaenoic acid (DHA, 22:6n3) in both the PL and TG fractions were greater during the LC compared with the other 2 diets. A more complete listing of fatty acid composition responses expressed as both molar and weight percent is provided in Table 3 and Supplemental Table 5.
Figure 6. Carbohydrate restriction uniformly increases PL 20:4n6 while decreasing its immediate biosynthetic precursor.
(A) Biosynthesis of 20:4n6 from 18:2n6. (B) 20:4n6 responses (normalized to baseline values) in PLs. (C) DGLA responses (normalized to baseline values) in plasma PLs. Circles represent individual participants, the thick line is the mean and thin lines are 95% CIs. P value from 3-way (LC, MC, HC) repeated-measures ANOVA. Values not sharing a common letter are different (P < 0.05). All data n = 16.
Discussion
Current views of MetS define it as a chronic progressive disorder with limited proven effective behavioral or pharmacological treatment options as evidenced by the continued escalation in its prevalence (2, 3). Given its broad range of 5 defining characteristics, pharmaceutical interventions targeting just 1 (e.g., hyperglycemia or hypertension) typically do not benefit the others enough to reverse the syndrome as a whole. Obesity is often emphasized as the key factor in the pathophysiology while ignoring the perspective that MetS manifests as a carbohydrate-intolerant phenotype (9, 20). Given the poor track record of low-fat diets during the epidemic of obesity and diabetes and the limited impact of pharmacologic or even exercise interventions on MetS, we have pursued carbohydrate restriction as a treatment based on evidence that it uniquely promotes weight and fat loss (11) and reverses features of the insulin-resistant phenotype including atherogenic dyslipidemia (8, 10, 21) and type 2 diabetes (22). However, much of the work supporting this perspective involved dietary interventions that were ad libitum, hypocaloric, and/or self-sourced by free-living participants counseled on diets — all of which cast doubt on dietary compliance and ultimately the importance of weight loss versus carbohydrate restriction as a primary control element of MetS. In this investigation, we conducted a controlled feeding experiment to determine to what extent MetS could be reversed by carbohydrate restriction in individuals who were obese but who were fed enough calories to prevent weight loss. The results clearly show that carbohydrate restriction, especially very LC intake, leads to improvement and reversal of MetS in many cases, in the context of stable weight and adiposity. Hypothetically, if waist circumference would have decreased below the threshold for MetS, all but 1 participant would have reversed MetS after the LC diet. BP did not show effects on diet. The most robust improvements were in circulating lipoproteins and fatty acid composition after the LC diet, suggesting that the proportion of dietary carbohydrate has significant regulatory control on intravascular lipid metabolism independent of total calories and net lipolysis in individuals with obesity and MetS. These findings underscore the perspective that MetS is a pathologic state that manifests as carbohydrate intolerance. Furthermore, we have shown that the favorable effects of the LC diet on MetS occur independent of changes in body mass and extend to other atherogenic markers including lipoprotein subclasses and the relative abundance of various fatty acids.
The discovery that LDL comprises particles of different sizes and composition that vary in atherogenicity and confer differential CVD risk has helped elucidate the effect of diet on lipid metabolism, especially in those with MetS (23). Although LDL-C concentration is often not elevated in MetS and is not one of the diagnostic criteria, most individuals with the combination of elevated TG and low HDL-C have a predominance of small LDL particles that is associated with higher risk for CVD. Both the Atherosclerosis Risk in Communities and Multi-Ethnic Study of Atherosclerosis trials (combined totaling more than 15,000 individuals) demonstrated that the small LDL fraction was significantly associated with incidence of coronary heart disease (24, 25). Of the participants with MetS enrolled in this study, 81% were either pattern B or an intermediate phenotype at baseline. This atherogenic dyslipidemia has a genetic component but is also strongly influenced by dietary carbohydrate as shown in many prior studies (10, 26, 27). The results of this investigation represent one of the more striking examples of how decreasing carbohydrate while increasing fat results in a stepwise increase in peak LDL diameter and a corresponding decrease in the concentration of small LDL particles. Considering the atherogenic effects of LDL particles (28), these results are consistent with a lowering of CVD risk by an LC diet.
There has been considerable interest and debate on the role of dietary SFA on health, with several recent reports suggesting that it is not associated with CVD or total mortality (29, 30). However, people with higher levels of circulating even-chain SFAs (particularly palmitate, 16:0) have increased risk of developing MetS (18), diabetes (31–33), CVD (32), heart failure (34), and mortality (15). Remarkably, the LC diet that contained more than twice as much SFAs resulted in lower plasma SFAs in both TG and PL fractions. The primary factor determining the amount of SFAs in the blood is the rate of hepatic release. When the liver is converting carbohydrate into fat (i.e., de novo lipogenesis or DNL), there is a higher incorporation of SFAs into TGs, which are then secreted into the blood as large VLDLs. Serum VLDL-TGs enriched with SFAs are highly correlated with insulin resistance and adiposity (35). The LC diet decreased these VLDL particles and TG SFAs without affecting whole-body adiposity.
Although palmitic acid is the primary fatty acid product of DNL, serum palmitoleic acid, a product of stearoyl CoA desaturase–1 activity, is a better proxy of DNL because of its low content in the diet and the fact that it increases proportionally more than any other fatty acid when carbohydrate is converted to fat (36). The lowest level of circulating 16:1n7 was after the LC diet, and the proportion progressively increased after the MC and HC diets, consistent with progressive increases in DNL as a function of dietary carbohydrate during eucaloric feeding. We previously reported a similar stepwise increase in plasma 16:1n7 as a function of carbohydrate intake in people with excess weight and MetS, but in that study, the diets were hypocaloric and associated with a significant loss of body mass and fat mass (37). Collectively, these results strongly link the proportion of 16:1n7 to dietary carbohydrate independent of changes in body mass.
Beyond its role as a surrogate for DNL, 16:1n7 in blood or adipose tissue is consistently and strongly linked to nearly all features of MetS including obesity and hypertriglyceridemia (38), hyperglycemia and type 2 diabetes (32, 39, 40), heart failure (16, 34), and CVD mortality (15, 19). In men who are not diabetic, higher proportions of 16:1n7 were significantly associated with worsening of hyperglycemia (41) and development of MetS (18, 42). In the Atherosclerosis Risk in Community study, the highest quintile of plasma PL 16:1n7 was associated with a 67% higher risk of incident heart failure compared with the lowest quintile (34). In the Physician’s Health Study, a 1 standard deviation increase in plasma 16:1n7 was associated with a 17% higher odds ratio of congestive heart failure (16). These data point to rising proportions of plasma 16:1n7 as an early indication of carbohydrate intolerance (i.e., more carbohydrate directed toward DNL), which in turn signals higher risk for MetS and CVD.
The decreased accumulation of plasma SFAs and 16:1n7 after the LC diet was likely mediated in part by decreased DNL. However, the LC diet also contained significantly higher amounts of palmitic acid and other SFAs from high-fat foods meaning that in order to explain the lower proportion of circulating SFAs, clearance must have been increased. As expected, the LC diet significantly increased the rate of whole-body fat oxidation, which clearly includes the preferred use of SFAs for fuel. Thus, the combination of greater fat oxidation and attenuation of hepatic DNL explains why a higher SFA intake is associated with lower circulating SFAs in the context of LC intake. Despite the presumably lower DNL and enhanced fat oxidation during the LC diet, liver fat was not significantly decreased. The most likely explanation is that the combination of dramatically increased fat intake (>300 g/day for some men) and increased hepatic fatty acid delivery from accelerated adipose tissue lipolysis counterbalanced the reduced DNL and enhanced fat oxidation. Nevertheless, there was a modest correlation between plasma TG 16:1n7 and liver fat (Supplemental Figure 2).
Increased DNL and promotion of atherogenic dyslipidemia in response to an HC load has been demonstrated in lean men with MetS (43), providing further evidence that MetS is a carbohydrate-intolerant state. In that study, despite the participants being lean, the HC meals induced an increase in hepatic TG synthesis that manifested in a rapid increase in serum TG and reduced HDL-C, thereby linking impaired metabolism of dietary carbohydrate to increased DNL and the atherogenic dyslipidemia of MetS. Consistent with this response, we show in a prospective manner that restricting carbohydrate decreased a biomarker of DNL and improved atherogenic dyslipidemia independent of changes in body mass and fat mass.
Similar to our previous study in individuals who were obese with MetS (21), we observed a striking increase in plasma 20:4n6 and a progressive decrease in DGLA associated with carbohydrate restriction. Although seemingly counterintuitive, these data are consistent with the view that LC diets decrease production of 20:4n6 from 18:2n6. A potential explanation for the higher circulating proportion of 20:4n6 is better preservation due to less lipid peroxidation. Insulin resistance is associated with increased oxidative stress and manifests in lower 20:4n6 levels (44), suggesting that increasing carbohydrate load in individuals with MetS is associated with oxidative stress, lower 20:4n6, and increased polyunsaturated fatty acid anabolism. Increased proportions of 20:4n6 and total polyunsaturated and less SFAs in membranes increase membrane fluidity and correlate with increased insulin sensitivity (44) and decreased inflammation (21, 45). Many of the same studies that reported increased risks for MetS, CVD, and morality associated with circulating SFAs and 16:1n7 also showed similar associated risks with increased DGLA and low 20:4n6 (13, 15, 34). In fact, the 2 fatty acids that most accurately predict future development of MetS in individuals who are obese are 16:1n7 and DGLA (42). Overall, the proportions of saturated, monounsaturated, and polyunsaturated fatty acids observed after the LC diet in this investigation are consistent with a significantly lower risk of developing diabetes, CVD, and mortality.
One of the questions addressed in this work was whether the response to consuming a diet high in saturated fat, primarily provided in the form of full-fat cheese, was altered by the total dietary carbohydrate-to-fat ratio. Thus, all the investigational diets contained a relatively high amount of cheese. The results clearly support a role of the carbohydrate-to-fat ratio as having an impact on the response to high cheese intake. Whether similar effects would hold true for diets that emphasize different saturated fat-rich foods cannot be determined from this study, but our past work that included diets with varying saturated fat-containing foods (21, 37) suggests a fundamental role of dietary carbohydrate on the metabolic response to saturated fat intake.
Conclusions
In summary, our results show that MetS can be rapidly (within 4 weeks) reversed by an LC diet in the majority of participants who are obese even when 1 of the main characteristics of the syndrome, increased waist circumference/adiposity, is locked out of the equation. Thus, these results likely underestimate the true benefits of LC diets that are commonly associated with weight loss when fed ad libitum (21, 22, 46). Reversal of the atherogenic lipoprotein and fatty acid composition phenotypes of MetS was particularly sensitive to carbohydrate restriction and increased fat intake, including decreased circulating SFAs despite higher SFA intake, suggesting “we are not what we eat.” These findings are consistent with the paradigm that MetS and LC/high-fat-adapted phenotypes are opposite ends of a continuum that is primarily influenced by increased and decreased carbohydrate intake (with corresponding changes in fat intake), respectively, in genetically predisposed individuals. Overall, this work highlights the importance of the dietary carbohydrate-to-fat ratio as a control element in MetS expression and points to LC diets as being uniquely therapeutic independent of traditional concerns about dietary total and saturated fat intakes. Although our findings extend a growing amount of research exploring LC diets on MetS, it remains unknown whether the improvements in the specific component of the syndrome observed here translate into decreased cardiometabolic outcomes. Based on these results, any long-term diet trials in participants with MetS studying hard outcomes should include LC diets.
Methods
Participant recruitment and screening
Participants were recruited through posted flyers, emails through Listservs, word of mouth, StudySearch, and by using ResearchMatch through The Ohio State University Center for Clinical and Translational Science. Print and email advertisements instructed interested individuals to call the study center, and one of the key personnel involved in the project described the study and determined preliminary qualifications by conducting a scripted phone interview. Participant answers to qualifying criteria questions were recorded to assess whether or not the person calling met the initial qualifying criteria. If participants met the initial qualifying criteria, an in-person appointment was scheduled.
Inclusion criteria included men and women 21 to 65 years of age with MetS defined as having 3 or more of the following characteristics: (a) waist circumference > 102 cm (40 in) in men and 88 cm (35 in) in women; (b) triglycerides ≥ 150 mg/dL; (c) HDL-C < 40 mg/dL in men, and < 50 mg/dL in women; (d) BP ≥ 130/85 mmHg; and (e) fasting glucose ≥ 100 mg/dL (47). Potential participants were excluded who had high total cholesterol (> 300 mg/dL), diabetes, liver, kidney, or other metabolic or endocrine dysfunction, gastrointestinal disorders, smoked regularly, had lactose intolerance, consumed excessive alcohol, or used medications for high cholesterol, diabetes, or infections in the last 3 months.
During the screening meeting, interested participants provided informed consent in accordance with the Institutional Review Board at The Ohio State University and the Declaration of Helsinki. After consent was provided, anthropometric measures of height, body mass, waist circumference, and BP were obtained. Additionally, a venipuncture in the antecubital fossa was conducted in the fasted state. A screening chemistry panel including serum lipids and glucose was sent to Quest Diagnostics for analysis. Participants were also required to complete an MRI screening questionnaire to determine if the participant could safely have an MRI scan completed. A flowchart of participant recruitment and enrollment can be found in Supplemental Figure 2. A total of 16 participants with MetS were enrolled: 7 met 3 out of 5 criteria, 6 met 4 out of 5 criteria, and 3 met all 5 criteria.
Experimental approach
Information about the sample size and baseline characteristics can be found in the Results section and in Figure 2. After enrollment, participants completed 3 controlled-feeding periods each lasting 4 weeks with a 2-week washout period in between diets (Figure 1A). The order of diets was randomized and balanced. During a 2-week run-in period, participants were fed an MC, standard American diet to determine an appropriate energy expenditure to maintain body mass. All controlled diets were formulated to consist of the same total calories to maintain weight stability throughout the entire experimental period. Testing occurred at baseline and was repeated after each of the controlled diets.
Method details
Controlled feeding and dietary intervention formulation.
Specific 7-day rotational menus were developed for the 3 diet treatments: LC, MC, and HC using typical food items. Each menu was designed using a caloric intake base of 2,500 kcal and to allow for scaling options for various caloric intakes. Although individual differences in absolute intakes of food occurred, this approach allowed for relative macronutrient and micronutrient proportions to be constant between participants.
Participants’ caloric needs were preliminarily determined via indirect calorimetry and the Harris-Benedict equation. At the initiation of the run-in diet, participants were fed an MC diet at a caloric intake level estimated to match energy expenditure. Any changes in body mass were monitored and caloric intake adjusted accordingly to maintain weight stability. Once body mass stabilized, no further adjustments to caloric intake were made across the interventions.
All food was prepared and provided to subjects during the experimental period. All food, drinks, and seasonings were weighed to the nearest 0.1 g and prepared in a metabolic kitchen located at The Ohio State University. In order to minimize intercompany and interproduct variations, every product utilized in the trial was maintained throughout the entirety of the study. All food was prepared by baking, boiling, or sautéing and all juices were collected in order to minimize nutrient loss. Participants were instructed to eat/drink meals in their entirety, including consumption of any residual oils that may be in the containers. Adherence was tracked by the receipt of empty food containers. Detailed nutrient composition was completed a priori via Nutritionist Pro (Axxya Systems) for every meal to ensure accurate macro-/micronutrient composition. Mean nutrient intakes for the diet periods are reported in Supplemental Table 2.
All 3 investigational diets were isocaloric, isonitrogenous, and contained a scalable amount of cheese (Cheddar and Gouda) that approximated 6 oz/day of full-fat cheese per 2,500 kcal. The MC diet was created to be comparable to the standard American diet with approximately one-third energy from fat and half from carbohydrate. It was high in potatoes and a mix of whole and processed grains, with at least 5 servings of fruits and vegetables every day. For the HC diet, we cut out fat primarily from animal products (except cheese) and scaled carbohydrate proportionately with at least 5 servings of fruits and vegetables per day. For the LC diet, we did the opposite. Because the primary vector for saturated fat was provided in the form of full-fat cheese products, polyunsaturated fat was relatively low for all diets. The main sources of polyunsaturated fat came from fatty meats, nuts, and condiments such as mayonnaise.
Metabolic analysis
Substrate oxidation rates, respiratory exchange ratio, and resting energy expenditure were measured via indirect calorimetry (Parvomedics TrueOne 2400) in the early morning after an overnight fast. After participants’ arrival and hydration status assessment, they were brought into a dark, quiet, room (ambient temperature: 20°C–22°C) to relax for 30 minutes. During this time and throughout the duration of the assessment, participants were supine on an examination table with pillows under their head and knees to ensure comfort throughout the testing period. Prior to subject assessment, the metabolic carts were calibrated with standardized gas and pressure. Participants laid motionless and were not allowed to talk or fall asleep during the assessment. Both expired volume of carbon dioxide and inspired oxygen were collected and sampled for a period of 40 minutes. The first 10 minutes of sampling was utilized as a stabilization period to account for any breathing alterations that may occur at the onset of assessment. As such, the total sampling time for determining substrate oxidation and resting energy expenditure was 30 minutes.
Venipuncture and blood chemistry
All blood was collected by a trained phlebotomist via venipuncture in the morning after an overnight fast. All venous blood was collected from the antecubital fossa via 21-g or 23-g butterfly needles (BD Vacutainer Safety-Lok Blood Collection Set, Becton, Dickinson and Company). Blood was collected into 10-ml spray-coated K2EDTA, sodium heparin, serum, and serum separator tubes (BD Vacutainer). Plasma tubes were placed on ice, while serum tubes were allowed to sit at room temperature until clotted (30–45 minutes). Blood collection tubes were then centrifuged at 1,200 g for 10 minutes. The serum separator tubes were stored at 4°C until courier service collected daily and were analyzed by Quest Diagnostics for serum glucose, triglycerides, LDL, and HDL. Remaining serum and plasma was then aliquoted and snap-frozen in liquid nitrogen. All samples were stored at –80°C and allowed only 1 free-thaw cycle before assay. Serum insulin was determined via ELISA with an average coefficient of variation of 2.1% (Quantikine, catalog no. DINS00, R&D Systems). Insulin resistance was determined from fasting glucose and insulin (48).
Body composition and anthropometric analysis
Whole-body composition and bone mineral density analysis was completed using an iDXA (GE Healthcare). All measurements were conducted by a radiologist certified in this technology. Bone mineral density, total lean mass, and fat mass were calculated. All waist circumference measurements were conducted by a trained researcher in the area between the floating ribs and the iliac crest, as defined by the WHO (Gulick II, Fitness Mart). Height and fasting body mass were assessed in the laboratory using a stadiometer and scale (SECA Model 703). BP was determined using a BP cuff (Welch Allyn) by a trained researcher after participants had been seated quietly, with feet on the floor, for a period of 5 minutes. Two measurements were taken with 2 to 3 minutes between subsequent measures.
MRI-based fat quantification
We assessed visceral adipose tissue (VAT) mass and liver organ fat fraction by MRI using a 3-Tesla system (MAGNETOM, Tim Trio, Siemens Healthcare). The abdomen, including the entire liver, was scanned during a single breath hold with a slice thickness of 5 mm. Fat percentage and water percentage image maps were generated automatically using the variable projection (VARPRO) fat separation technique (49). The resulting digital imaging and communications in medicine images were processed using semiautomated, custom-built software to segment VAT and subcutaneous adipose tissue (SAT) compartments and calculate the volume and mass of fat within the abdominal VAT and SAT depots.
Hepatic fat percentage was quantified using the same VARPRO image data used for VAT measurements. This technique provides an accurate and objective measurement of tissue fat composition on a pixel-by-pixel basis. Using the fat percentage maps automatically generated by the VARPRO technique, fat fraction was measured in regions of interest manually placed in each of the 9 standard anatomical liver segments (50). The regions of interest were drawn to avoid veins and visible image artifacts. Three measurements were taken within each segment (in 3 different slice planes) for a total of 27 measurements. The hepatic fat fraction (%) was expressed as the average fat fraction across all 9 liver segments.
Plasma fatty acid profiling of PL and TG
Plasma samples were extracted with mixtures of chloroform and methanol and extracted by standard methods of Bligh and Dyer (51). Prior to extraction, 100 μg phosphatidyl choline and triglyceride containing 17:0 (heptadecanoic acid) acyl chains was added as an internal standard. Resulting lipid extracts were dried under a steady stream of nitrogen. Dried lipid extracts were reconstituted in 100 μL chloroform and spotted on silica gel thin layer chromatography plates and developed in hexane/diethyl ether/glacial acetic acid (80:20:1). Resulting lipid bands were visualized with 5% dichlorofluorescein (Sigma-Aldrich) with ultraviolet light. The bands corresponding to total polar lipids (phospholipids) and triglycerides were scraped into a 16- × 100-mm screw-top Pyrex test tube. The lipid classes were then transesterified with 2% sulfuric acid in methanol in a hot water bath at 75°C. The resulting fatty acid methyl esters were then extracted with the addition of water and petroleum ether. The fatty acid methyl esters were then analyzed with a Shimadzu 2010 gas chromatograph (Shimadzu Corporation) utilizing a FAMEWAX capillary column (Restek) and flame ionization detector. Relative amounts of fatty acids in each lipid class were determined with internal standards and fatty acids from 12 to 24 carbons were quantified. Fatty acid data are expressed as both weight and molar percent composition.
Plasma lipoprotein particle analysis
Particle concentrations of VLDL, intermediate-density lipoprotein (IDL), LDL, and HDL subfractions were analyzed in specific particle-size intervals using ion mobility, which uniquely allows for direct particle quantification as a function of particle diameter (52) following a procedure to remove other plasma proteins (53). The ion mobility instrument utilizes an electrospray to create an aerosol of particles, which then pass through a differential mobility analyzer coupled to a particle counter. Particle concentrations (nmol/l) are determined for subfractions defined by the following size intervals (nm): VLDL: large (42.40–54.70), medium (33.50–42.39), small (29.60–33.49); IDL: large (25.00–29.59), small (23.33–24.99); LDL: large (22.0–23.32), medium (21.41–21.99), small (20.82–21.40), very small (18.0–20.81); HDL: large (10.50–14.50) and small (7.65–10.49). Peak LDL diameter (nm) is determined as described by Caulfield et al. (52). Interassay variation was reduced by inclusion of 2 in-house controls in each preparatory process and triplicate analysis. CV < 15% for each subfraction measurement was maintained throughout.
Statistics
A repeated-measures ANOVA was performed to test for differences in the various outcome variables after the 3 diet periods (i.e., LC, MC, and HC). In a few cases, data that did not have a normal distribution was log transformed. Main effects were evaluated by Fisher’s least significant difference post hoc testing. A significance level of P ≤ 0.05 was chosen. Statistical analyses were performed using Statistica.
Study approval
Prior to participation, all subjects in this study signed an informed consent document approved by the Institutional Review Board at The Ohio State University.
Author contributions
PNH, TNS, WJK, and JSV conceived the study design. PNH, TNS, CDC, RAL, MLB, AB, BF, FTM, RMD, VJM, and DS conducted the experiments. PNH, TNS, CDC, MLB, VJM, DS, OPS, SDP, WJK, SAK, RMK, and JSV analyzed and interpreted the data. PNH and JSV wrote the initial manuscript drafts. RAL, OPS, SDP, WJK, SAK, and RMK performed critical editing. All authors approved the final version of the manuscript.
Supplementary Material
Acknowledgments
Funding for this work was provided through a grant from Dairy Management Inc. and the Dutch Dairy Association to The Ohio State University.
Version 1. 06/20/2019
Electronic publication
Footnotes
Conflict of interest: JSV receives royalties for low-carbohydrate nutrition books. He is founder, consultant, and stockholder of Virta Health Corp.; a member of the advisory boards for Atkins Nutritionals Inc., UCAN Co., Ketone Sciences, and Axcess Global; and has received honoraria from Metagenics and Pruvit. SDP receives royalties for low-carbohydrate nutrition books. He is founder and stockholder of Virta Health Corp. and a member of the advisory board for Atkins Nutritionals Inc. RMK has had investigator-initiated research funding from Dairy Management, Inc. and the Almond Board of California. He receives royalties from a patent for ion mobility analysis of lipoproteins and from a textbook on nutrition and cardiometabolic health. He is on the scientific advisory boards of, and has stock options from, Virta Health, and DayTwo, and is a part-time employee of JumpstartMD.
Copyright: © 2019 American Society for Clinical Investigation
Reference information: JCI Insight. 2019;4(12):e128308. https://doi.org/10.1172/jci.insight.128308.
Contributor Information
Alex Buga, Email: buga.1@osu.edu.
Brandon Fell, Email: fell.52@osu.edu.
Debbie Scandling, Email: debbie.scandling@osumc.edu.
References
- 1.Reaven GM. Banting lecture 1988. Role of insulin resistance in human disease. Diabetes. 1988;37(12):1595–1607. doi: 10.2337/diab.37.12.1595. [DOI] [PubMed] [Google Scholar]
- 2.Moore JX, Chaudhary N, Akinyemiju T. Metabolic syndrome prevalence by race/ethnicity and sex in the United States, National Health and Nutrition Examination Survey, 1988–2012. Prev Chronic Dis. 2017;14:E24. doi: 10.5888/pcd14.160287. [DOI] [PMC free article] [PubMed] [Google Scholar]
- 3.Hales CM, Fryar CD, Carroll MD, Freedman DS, Ogden CL. Trends in obesity and severe obesity prevalence in US youth and adults by sex and age, 2007–2008 to 2015–2016. JAMA. 2018;319(16):1723–1725. doi: 10.1001/jama.2018.3060. [DOI] [PMC free article] [PubMed] [Google Scholar]
- 4.Cohen E, Cragg M, deFonseka J, Hite A, Rosenberg M, Zhou B. Statistical review of US macronutrient consumption data, 1965–2011: Americans have been following dietary guidelines, coincident with the rise in obesity. Nutrition. 2015;31(5):727–732. doi: 10.1016/j.nut.2015.02.007. [DOI] [PubMed] [Google Scholar]
- 5.Yusuf S, et al. Use of secondary prevention drugs for cardiovascular disease in the community in high-income, middle-income, and low-income countries (the PURE Study): a prospective epidemiological survey. Lancet. 2011;378(9798):1231–1243. doi: 10.1016/S0140-6736(11)61215-4. [DOI] [PubMed] [Google Scholar]
- 6.Kelly CT, Mansoor J, Dohm GL, Chapman WH, Pender JR, Pories WJ. Hyperinsulinemic syndrome: the metabolic syndrome is broader than you think. Surgery. 2014;156(2):405–411. doi: 10.1016/j.surg.2014.04.028. [DOI] [PubMed] [Google Scholar]
- 7.Volek JS, Feinman RD. Carbohydrate restriction improves the features of metabolic syndrome. Metabolic syndrome may be defined by the response to carbohydrate restriction. Nutr Metab (Lond) 2005;2:31. doi: 10.1186/1743-7075-2-31. [DOI] [PMC free article] [PubMed] [Google Scholar]
- 8.Volek JS, Fernandez ML, Feinman RD, Phinney SD. Dietary carbohydrate restriction induces a unique metabolic state positively affecting atherogenic dyslipidemia, fatty acid partitioning, and metabolic syndrome. Prog Lipid Res. 2008;47(5):307–318. doi: 10.1016/j.plipres.2008.02.003. [DOI] [PubMed] [Google Scholar]
- 9.Grundy SM. Metabolic syndrome update. Trends Cardiovasc Med. 2016;26(4):364–373. doi: 10.1016/j.tcm.2015.10.004. [DOI] [PubMed] [Google Scholar]
- 10.Krauss RM, Blanche PJ, Rawlings RS, Fernstrom HS, Williams PT. Separate effects of reduced carbohydrate intake and weight loss on atherogenic dyslipidemia. Am J Clin Nutr. 2006;83(5):1025–1031. doi: 10.1093/ajcn/83.5.1025. [DOI] [PubMed] [Google Scholar]
- 11.Sackner-Bernstein J, Kanter D, Kaul S. Dietary intervention for overweight and obese adults: comparison of low-carbohydrate and low-fat diets. A meta-analysis. PLoS One. 2015;10(10):e0139817. doi: 10.1371/journal.pone.0139817. [DOI] [PMC free article] [PubMed] [Google Scholar]
- 12.Williams PT, Zhao XQ, Marcovina SM, Otvos JD, Brown BG, Krauss RM. Comparison of four methods of analysis of lipoprotein particle subfractions for their association with angiographic progression of coronary artery disease. Atherosclerosis. 2014;233(2):713–720. doi: 10.1016/j.atherosclerosis.2014.01.034. [DOI] [PMC free article] [PubMed] [Google Scholar]
- 13.Wang L, Folsom AR, Eckfeldt JH. Plasma fatty acid composition and incidence of coronary heart disease in middle aged adults: the Atherosclerosis Risk in Communities (ARIC) Study. Nutr Metab Cardiovasc Dis. 2003;13(5):256–266. doi: 10.1016/S0939-4753(03)80029-7. [DOI] [PubMed] [Google Scholar]
- 14.Simon JA, Hodgkins ML, Browner WS, Neuhaus JM, Bernert JT, Hulley SB. Serum fatty acids and the risk of coronary heart disease. Am J Epidemiol. 1995;142(5):469–476. doi: 10.1093/oxfordjournals.aje.a117662. [DOI] [PubMed] [Google Scholar]
- 15.Warensjö E, Sundström J, Vessby B, Cederholm T, Risérus U. Markers of dietary fat quality and fatty acid desaturation as predictors of total and cardiovascular mortality: a population-based prospective study. Am J Clin Nutr. 2008;88(1):203–209. doi: 10.1093/ajcn/88.1.203. [DOI] [PubMed] [Google Scholar]
- 16.Djoussé L, Weir NL, Hanson NQ, Tsai MY, Gaziano JM. Plasma phospholipid concentration of cis-palmitoleic acid and risk of heart failure. Circ Heart Fail. 2012;5(6):703–709. doi: 10.1161/CIRCHEARTFAILURE.112.967802. [DOI] [PMC free article] [PubMed] [Google Scholar]
- 17.Zong G, et al. Associations of erythrocyte fatty acids in the de novo lipogenesis pathway with risk of metabolic syndrome in a cohort study of middle-aged and older Chinese. Am J Clin Nutr. 2013;98(2):319–326. doi: 10.3945/ajcn.113.061218. [DOI] [PubMed] [Google Scholar]
- 18.Warensjö E, Risérus U, Vessby B. Fatty acid composition of serum lipids predicts the development of the metabolic syndrome in men. Diabetologia. 2005;48(10):1999–2005. doi: 10.1007/s00125-005-1897-x. [DOI] [PubMed] [Google Scholar]
- 19.Djoussé L, Matthan NR, Lichtenstein AH, Gaziano JM. Red blood cell membrane concentration of cis-palmitoleic and cis-vaccenic acids and risk of coronary heart disease. Am J Cardiol. 2012;110(4):539–544. doi: 10.1016/j.amjcard.2012.04.027. [DOI] [PMC free article] [PubMed] [Google Scholar]
- 20.Sperling LS, et al. The CardioMetabolic Health Alliance: working toward a new care model for the metabolic syndrome. J Am Coll Cardiol. 2015;66(9):1050–1067. doi: 10.1016/j.jacc.2015.06.1328. [DOI] [PubMed] [Google Scholar]
- 21.Forsythe CE, et al. Comparison of low fat and low carbohydrate diets on circulating fatty acid composition and markers of inflammation. Lipids. 2008;43(1):65–77. doi: 10.1007/s11745-007-3132-7. [DOI] [PubMed] [Google Scholar]
- 22.Hallberg SJ, et al. Effectiveness and safety of a novel care model for the management of type 2 diabetes at 1 year: an open-label, non-randomized, controlled study. Diabetes Ther. 2018;9(2):583–612. doi: 10.1007/s13300-018-0373-9. [DOI] [PMC free article] [PubMed] [Google Scholar]
- 23.Austin MA, King MC, Vranizan KM, Krauss RM. Atherogenic lipoprotein phenotype. A proposed genetic marker for coronary heart disease risk. Circulation. 1990;82(2):495–506. doi: 10.1161/01.CIR.82.2.495. [DOI] [PubMed] [Google Scholar]
- 24.Hoogeveen RC, et al. Small dense low-density lipoprotein-cholesterol concentrations predict risk for coronary heart disease: the Atherosclerosis Risk In Communities (ARIC) study. Arterioscler Thromb Vasc Biol. 2014;34(5):1069–1077. doi: 10.1161/ATVBAHA.114.303284. [DOI] [PMC free article] [PubMed] [Google Scholar]
- 25.Tsai MY, et al. New automated assay of small dense low-density lipoprotein cholesterol identifies risk of coronary heart disease: the Multi-ethnic Study of Atherosclerosis. Arterioscler Thromb Vasc Biol. 2014;34(1):196–201. doi: 10.1161/ATVBAHA.113.302401. [DOI] [PMC free article] [PubMed] [Google Scholar]
- 26.Krauss RM. Dietary and genetic probes of atherogenic dyslipidemia. Arterioscler Thromb Vasc Biol. 2005;25(11):2265–2272. doi: 10.1161/01.ATV.0000186365.73973.f0. [DOI] [PubMed] [Google Scholar]
- 27.Volek JS, Sharman MJ, Forsythe CE. Modification of lipoproteins by very low-carbohydrate diets. J Nutr. 2005;135(6):1339–1342. doi: 10.1093/jn/135.6.1339. [DOI] [PubMed] [Google Scholar]
- 28.Steinberg D, Parthasarathy S, Carew TE, Khoo JC, Witztum JL. Beyond cholesterol. Modifications of low-density lipoprotein that increase its atherogenicity. N Engl J Med. 1989;320(14):915–924. doi: 10.1056/NEJM198904063201407. [DOI] [PubMed] [Google Scholar]
- 29.Jakobsen MU, et al. Major types of dietary fat and risk of coronary heart disease: a pooled analysis of 11 cohort studies. Am J Clin Nutr. 2009;89(5):1425–1432. doi: 10.3945/ajcn.2008.27124. [DOI] [PMC free article] [PubMed] [Google Scholar]
- 30.Siri-Tarino PW, Sun Q, Hu FB, Krauss RM. Meta-analysis of prospective cohort studies evaluating the association of saturated fat with cardiovascular disease. Am J Clin Nutr. 2010;91(3):535–546. doi: 10.3945/ajcn.2009.27725. [DOI] [PMC free article] [PubMed] [Google Scholar]
- 31.Patel PS, et al. Fatty acids measured in plasma and erythrocyte-membrane phospholipids and derived by food-frequency questionnaire and the risk of new-onset type 2 diabetes: a pilot study in the European Prospective Investigation into Cancer and Nutrition (EPIC)-Norfolk cohort. Am J Clin Nutr. 2010;92(5):1214–1222. doi: 10.3945/ajcn.2010.29182. [DOI] [PubMed] [Google Scholar]
- 32.Wang L, Folsom AR, Zheng ZJ, Pankow JS, Eckfeldt JH, ARIC Study Investigators Plasma fatty acid composition and incidence of diabetes in middle-aged adults: the Atherosclerosis Risk in Communities (ARIC) Study. Am J Clin Nutr. 2003;78(1):91–98. doi: 10.1093/ajcn/78.1.91. [DOI] [PubMed] [Google Scholar]
- 33.Forouhi NG, et al. Differences in the prospective association between individual plasma phospholipid saturated fatty acids and incident type 2 diabetes: the EPIC-InterAct case-cohort study. Lancet Diabetes Endocrinol. 2014;2(10):810–818. doi: 10.1016/S2213-8587(14)70146-9. [DOI] [PMC free article] [PubMed] [Google Scholar]
- 34.Yamagishi K, Nettleton JA, Folsom AR, ARIC Study Investigators Plasma fatty acid composition and incident heart failure in middle-aged adults: the Atherosclerosis Risk in Communities (ARIC) Study. Am Heart J. 2008;156(5):965–974. doi: 10.1016/j.ahj.2008.06.017. [DOI] [PMC free article] [PubMed] [Google Scholar]
- 35.Kotronen A, et al. Serum saturated fatty acids containing triacylglycerols are better markers of insulin resistance than total serum triacylglycerol concentrations. Diabetologia. 2009;52(4):684–690. doi: 10.1007/s00125-009-1282-2. [DOI] [PubMed] [Google Scholar]
- 36.Aarsland A, Wolfe RR. Hepatic secretion of VLDL fatty acids during stimulated lipogenesis in men. J Lipid Res. 1998;39(6):1280–1286. [PubMed] [Google Scholar]
- 37.Volk BM, et al. Effects of step-wise increases in dietary carbohydrate on circulating saturated fatty acids and palmitoleic acid in adults with metabolic syndrome. PLoS One. 2014;9(11):e113605. doi: 10.1371/journal.pone.0113605. [DOI] [PMC free article] [PubMed] [Google Scholar]
- 38.Paillard F, et al. Plasma palmitoleic acid, a product of stearoyl-coA desaturase activity, is an independent marker of triglyceridemia and abdominal adiposity. Nutr Metab Cardiovasc Dis. 2008;18(6):436–440. doi: 10.1016/j.numecd.2007.02.017. [DOI] [PubMed] [Google Scholar]
- 39.Mahendran Y, et al. Association of erythrocyte membrane fatty acids with changes in glycemia and risk of type 2 diabetes. Am J Clin Nutr. 2014;99(1):79–85. doi: 10.3945/ajcn.113.069740. [DOI] [PubMed] [Google Scholar]
- 40.Vessby B, Aro A, Skarfors E, Berglund L, Salminen I, Lithell H. The risk to develop NIDDM is related to the fatty acid composition of the serum cholesterol esters. Diabetes. 1994;43(11):1353–1357. doi: 10.2337/diab.43.11.1353. [DOI] [PubMed] [Google Scholar]
- 41.Mahendran Y, et al. Association of erythrocyte membrane fatty acids with changes in glycemia and risk of type 2 diabetes. Am J Clin Nutr. 2014;99(1):79–85. doi: 10.3945/ajcn.113.069740. [DOI] [PubMed] [Google Scholar]
- 42.Ni Y, et al. Circulating unsaturated fatty acids delineate the metabolic status of obese individuals. EBioMedicine. 2015;2(10):1513–1522. doi: 10.1016/j.ebiom.2015.09.004. [DOI] [PMC free article] [PubMed] [Google Scholar]
- 43.Petersen KF, et al. The role of skeletal muscle insulin resistance in the pathogenesis of the metabolic syndrome. Proc Natl Acad Sci U S A. 2007;104(31):12587–12594. doi: 10.1073/pnas.0705408104. [DOI] [PMC free article] [PubMed] [Google Scholar]
- 44.Borkman M, Storlien LH, Pan DA, Jenkins AB, Chisholm DJ, Campbell LV. The relation between insulin sensitivity and the fatty-acid composition of skeletal-muscle phospholipids. N Engl J Med. 1993;328(4):238–244. doi: 10.1056/NEJM199301283280404. [DOI] [PubMed] [Google Scholar]
- 45.Ferrucci L, et al. Relationship of plasma polyunsaturated fatty acids to circulating inflammatory markers. J Clin Endocrinol Metab. 2006;91(2):439–446. doi: 10.1210/jc.2005-1303. [DOI] [PubMed] [Google Scholar]
- 46.Boden G, Sargrad K, Homko C, Mozzoli M, Stein TP. Effect of a low-carbohydrate diet on appetite, blood glucose levels, and insulin resistance in obese patients with type 2 diabetes. Ann Intern Med. 2005;142(6):403–411. doi: 10.7326/0003-4819-142-6-200503150-00006. [DOI] [PubMed] [Google Scholar]
- 47. Grundy SM, et al. Definition of metabolic syndrome: report of the National Heart, Lung, and Blood Institute/American Heart Association conference on scientific issues related to definition. Arterioscler Thromb Vasc Biol. 2004;24(2):e13–e18. [DOI] [PubMed] [Google Scholar]
- 48.Matthews DR, Hosker JP, Rudenski AS, Naylor BA, Treacher DF, Turner RC. Homeostasis model assessment: insulin resistance and beta-cell function from fasting plasma glucose and insulin concentrations in man. Diabetologia. 1985;28(7):412–419. doi: 10.1007/BF00280883. [DOI] [PubMed] [Google Scholar]
- 49.Hernando D, Haldar JP, Sutton BP, Ma J, Kellman P, Liang ZP. Joint estimation of water/fat images and field inhomogeneity map. Magn Reson Med. 2008;59(3):571–580. doi: 10.1002/mrm.21522. [DOI] [PMC free article] [PubMed] [Google Scholar]
- 50.Abdel-Misih SR, Bloomston M. Liver anatomy. Surg Clin North Am. 2010;90(4):643–653. doi: 10.1016/j.suc.2010.04.017. [DOI] [PMC free article] [PubMed] [Google Scholar]
- 51.Bligh EG, Dyer WJ. A rapid method of total lipid extraction and purification. Can J Biochem Physiol. 1959;37(8):911–917. doi: 10.1139/o59-099. [DOI] [PubMed] [Google Scholar]
- 52.Caulfield MP, et al. Direct determination of lipoprotein particle sizes and concentrations by ion mobility analysis. Clin Chem. 2008;54(8):1307–1316. doi: 10.1373/clinchem.2007.100586. [DOI] [PubMed] [Google Scholar]
- 53.Mora S, et al. Atherogenic lipoprotein subfractions determined by ion mobility and first cardiovascular events after random allocation to high-intensity statin or placebo: the justification for the use of statins in prevention: an intervention trial evaluating Rosuvastatin (JUPITER) trial. Circulation. 2015;132(23):2220–2229. doi: 10.1161/CIRCULATIONAHA.115.016857. [DOI] [PMC free article] [PubMed] [Google Scholar]
Associated Data
This section collects any data citations, data availability statements, or supplementary materials included in this article.


