Abstract
Gastric cancer (GC) has been classified as the fourth leading cause of cancer-related deaths worldwide. Due to their ability to suppress the expression of target genes, microRNAs (miRNAs) are listed as one of the key elements involved in the formation and development of tumors. This study was therefore conducted to investigate the effects of microRNA-135b (miR-135b) on cisplatin [cis-diamminedichloroplatinum (CDDP)] resistance of GC cells through the MAPK signaling pathway by targeting mammalian ste20-like kinase 1 (MST1). A microarray-based gene expression analysis was performed to screen the GC-related differentially expressed genes. The 3-[4,5-dimethylthiazol-2-yl]-2,5 diphenyl tetrazolium bromide assay was performed to determine the sensitivity of GC cells to CDDP. The bioinformatics database and dual luciferase reporter gene assay were used to check whether MST1 was a direct target gene of miR-135b. GC cell lines were prepared with high CDDP resistance, after which they were cultured and transfected respectively, followed by the administration of transfected cells into nude mice and subsequent treatment with CDDP in an attempt to identify the underlying mechanisms and functions of miR-135b in relation to MST1 in GC progression. The results were highly indicative of the crucial role played by MST1 in the development of GC and the sensitivity of GC to CDDP. miR-135b was found to regulate MST1, which in turn had an impact on the development of GC. MKN28 was observed to be most sensitive to CDDP, whereas MKN45 presented with the poorest sensitivity to CDDP. Furthermore, the down-regulation of miR-135b resulted in inactivation of the MAPK signaling pathway; increased the expression of MST1 and Bax; and decreased expression of p-p38MAPK, p-ERK1/2, P-glycoprotein, p38MAPK, ERK1/2, multidrug resistance protein 1, multidrug resistance–associated protein 1, lung resistance–related protein, and Bcl-2, thus inhibiting CDDP resistance of GC cells. The down-regulation of miR-135b also restrained cell proliferation and induced the apoptosis rate of GC cells. In summary, the results of this study showed that the down-regulation of miR-135b induced apoptosis, and it inhibited proliferation and CDDP resistance of GC cells by inactivating the MAPK signaling pathway and increasing the expression of MST1.—Zhou, J., Chen, Q. Poor expression of microRNA-135b results in the inhibition of cisplatin resistance and proliferation and induces the apoptosis of gastric cancer cells through MST1-mediated MAPK signaling pathway.
Keywords: miR-135b, CDDP, MKN28, MKN45
Gastric cancer (GC) is the fourth most commonly occurring disease in men and fifth in women, and regardless of the recent decrease in the incidences of GC, it continues to have a distinctly high mortality rate worldwide (1, 2). Among the multiple risk factors that have been identified through various studies, unhealthy dietary habits, increased Helicobacter pylori infections, and the presence of a greater proportion of abnormal serum gastrin-17 levels have been highlighted as some of the leading causes of the disease (3, 4). Only approximately 4 to 20% patients with GC had a 5-yr survival rate after receiving surgical resection, and 20% had a 5-yr survival rate; however, it is widely believed that nearly all patients will be subsequently diagnosed with advanced-stage GC (2). The development of GC occurs as a result of the accumulation of multiple genetic, as well as epigenetic, changes over the lifetime of cancer patients, which eventually leads to the activation of oncogenic or the inactivation of tumor-suppressor pathways (5). Of the patients whose GC diagnosis was made at an early stage of disease and who receive surgical treatment followed by perioperative (even adjuvant) computed tomography imaging with curative intent, there is still a chance of disease recurrence, with only ∼25% of patients surviving long term (6). Therefore, the development of newer and more effective diagnostic and predictive tools are urgently needed to enhance treatment protocols for patients with GC.
MicroRNAs (miRNAs) are a type of a noncoding RNA that have been shown to play an array of important roles in the tumorigenesis process. Furthermore, some studies have suggested that miRNAs can function as important specific regulators in a number of biologic processes (7). The correlation between microRNA-135b (miR-135b) and the Laurén classification, tumor differentiation, invasion, and pathologic tumor-node-metastasis stage of GC was outlined in a previous study (8). The overexpression of miR-135b has been found to be conducive to the chemoresistance of cells, while promoting the chemosensitivity of drug-resistant lung cancer cell lines (9). In addition, miR-135b has been earmarked as a key player in the progression of cisplatin [cis-diamminedichloroplatinum (CDDP)] resistance in lung cancer cells, with reports indicating its association with the modulation of apoptosis by targeting MCL1 (10). Furthermore, other studies have suggested that miR-135b regulates the mammalian ste20-like kinase 1 (MST1) gene by binding to the 3′UTR in connection with the target prediction program, microRNA.org. MST1 has the ability to regulate cell proliferation as well as apoptosis in both embryonic development and adult tissue homeostasis, in addition to possessing notable tumor formation suppression ability in the liver (11).
The MAPK signaling pathway, particularly the ERK1/2 and JNK components, are involved in GC cell proliferation and suppression of the synergistic inhibitory effects, which suggests that regulation of the MAPK signaling pathway can result in inhibition of cell proliferation (12). Due to the association of the MAPK pathway with tumorigenesis and metastatic potential in GC, inhibition of the MAPK pathway could potentially suppress tumor metastasis (13). Moreover, an active and well-tolerated method in the treatment of advanced GC includes paclitaxel-CDDP complexity, which can also be used as a further treatment in 5-FU–based, first-line palliative chemotherapy-failed patients with GC (14). The MAPK signaling pathway could be activated by TNF-related apoptosis inducing ligand through caspase activation, and MST1 has been identified as an important mediator during the process (15). The aforementioned findings led us to hypothesize that the MAPK signaling pathway and miR-135b may be involved in the progression of GC. Hence, the central objective of the present study was to explore the effects of miR-135b on GC through the MST1-mediated MAPK signaling pathway to provide an effective therapeutic method for GC.
MATERIALS AND METHODS
Study design
An increasing number of studies suggest that a correlation exists between MST1, miR-135b, and the MAPK signaling pathway with GC (16–18). However, the exact mechanism of the interaction has yet to be thoroughly investigated. The present study was therefore conducted with the key objective of determining the regulatory mechanism associated with the interaction among MST1, miR-135b, and the MAPK signaling pathway in GC. First, microarray-based gene expression analysis was used to retrieve the GC-related gene and predict the miRNA. The results revealed that hsa-miR-135b targets MST1. Thereafter, the cell lines with the highest or lowest resistance to cisplatin were screened out among the human GC cell lines MKN28 (well differentiated), NCI-N87 (moderately and well differentiated), SGC7901 (moderately differentiated), BGC823 (moderately and poorly differentiated), and MKN45 (poorly differentiated) by using the 3-[4,5-dimethylthiazol-2-yl]-2,5 diphenyl tetrazolium bromide (MTT) assay, and were then used for subsequent experiments. Dual-Luciferase Reporter Assay System was used in an attempt to identify the relationship between miR-135b and MST1. The GC cell line with the highest resistance (MKN28) and the GC cell line with the lowest resistance (MKN45) were cultured in vitro and transfected with miR-135b mimic, miR-135b inhibitor, small interfering RNA (siRNA)-MST1, and miR-135b inhibitor + siRNA-MST1, respectively. Quantitative RT-PCR (qRT-PCR) and Western blot analysis were performed for evaluation of the expression of miR-135b, MST1, and MAPK-related factors, drug resistance genes, and apoptosis-related factors after transfection in each group. MTT assay and flow cytometry were then applied to detect cell proliferation, cell cycle, and apoptosis. Finally, tumor xenograft was conducted in nude mice, followed by the injection of the transfected cells into the mice, and the tumor growth in mice was recorded after 21 d of CDDP treatment.
Ethics statement
All experimental procedures were conducted in strict accordance with the relevant regulations in Guidance on the Good Treatment of Experimental Animals (No. 398) by the Ministry Science and Technology, People’s Republic of China, the Guide for the Care and Use of Laboratory Animals [National Institutes of Health (NIH), Bethesda, MD, USA], and the principles of conducting experiments with minimal animal utility and pain (19).
Cell line direct screening
Human GC cells MKN28 (well differentiated), NCI-N87 (moderately and well differentiated), SGC7901 (moderately differentiated), BGC823 (moderately and poorly differentiated), and MKN45 (poorly differentiated) were purchased from the Shanghai Institute of Cell Biology, Chinese Academy of Sciences (Shanghai, China). Liquid nitrogen was then added to the cells, removed from the frozen tube and placed into a water bath at 38°C with gentle shaking to allow quick thawing. The cells were then placed in an Eppendorf tube under sterile conditions and centrifuged at 179 g for 5 min followed by the removal of the supernatant. Subsequently, the cells were placed in a culture flask and cultured based on the adherence method. The monolayer cells were then further cultured in DMEM, a high-glucose medium containing 10% fetal bovine serum, 100 U/ml penicillin, and 100 U/ml streptomycin in an incubator (5% CO2, 37°C). The culture medium was replaced every 48–72 h, and the GC cells in the logarithmic growth phase were collected.
Cell transfection and grouping
The MKN45 and MKN28 cells at the logarithmic phase were collected and inoculated into a 24-well plate (1 × 10⁵ cells each well). The analogues of miR-135b mimic (MCH01291; Applied Biological Materials, Richmond, BC, Canada), miR-135b inhibitor (MIH01291; Applied Biological Materials), negative control (NC) (MIH00000; Applied Biological Materials), siRNA-MST1 (NM_020998; Applied Biological Materials), and miR-135b inhibitor + siRNA-MST1 were then transfected into the cells, respectively, in accordance with the instructions of Lipofectamine 2000 Transfection Kit (11668-019; Thermo Fisher Scientific, Waltham, MA, USA). The cell lines MKN45 and MKN28 were respectively classified into the blank group (cells without any transfection), the NC group (cells transfected with NC sequence), the miR-135b mimic group (cells transfected with miR-135b mimic), the miR-135b inhibitor group (cells transfected with miR-135b inhibitor), the siRNA-MST1 group (cells transfected with siRNA-MST1), and the miR-135b inhibitor + siRNA-MST1 group (cells transfected with miR-135b inhibitor + siRNA-MST1).
Microarray-based gene expression analysis
The Gene Expression Omnibus (GEO) database (https://www.ncbi.nlm.nih.gov/geo/) was explored to retrieve the 4 datasets: GSE13861, GSE19826, GSE49051, and GSE79973 (with “Gastric cancer” used as the key word). The 4 datasets included the normal control samples and the GC samples, and 2 of the 4 datasets were subjected to a differential analysis. The R language “limma” package (R Foundation for Statistical Computing, Vienna, Austria) was applied to analyze the differences in the samples of the 2 groups among the 4 datasets;  and values of P < 0.05 were used as the criteria of the differentially expressed gene (DEG) screening.
Expression thermal maps of the first 30 genes of the analysis results in the 4 datasets were constructed. The Venn diagrams composition website (http://bioinformatics.psb.ugent.be/webtools/Venn/) was used to construct the Venn diagrams for the initial 100 DEGs from the 4 datasets in an attempt to identify the intersection of the 4 datasets. Next, “Gastric cancer” and “cisplatin” were used as the key words to search the GEO database, and the GSE31811 dataset was subsequently discovered, which included 2 sets of data with effective and ineffective CDDP treatments, respectively. The expressions of MST1 in the 2 groups of data were analyzed.
MiRNA screening of MST1
The miRNAs capable of regulating MST1 were retrieved from the TargetScan (http://www.targetscan.org/vert_71/) database, with human used as the selective species. The miRNAs that could regulate MST1 were also retrieved from the mirDIP (http://ophid.utoronto.ca/mirDIP/index.jsp#r) and microRNA.org (http://34.236.212.39/microrna/home.do) databases. Meanwhile, the GC-related miRNA sequencing chips were retrieved from the GEO database, and the 2 datasets (GSE26595 and GSE30070) were retrieved. Next, the differential analysis of GSE26595 was performed, after which the results were used to conduct a Venn analysis, along with the prediction results of the 3 databases. The intersection of the Venn analysis was then subjected to an expression test in the GSE30070.
MTT assay
The analysis of the sensitivity of GC cells to CDDP
Five GC cell lines that had been confirmed to be at the logarithmic growth phase were inoculated into a 96-well plate, with each cell type grouped into the following 7 groups: 0 adjustment group (cells without any inoculation but were added with culture medium); control group (cells without any drug intervention), 0.01 μg/ml CDDP group (cells added with 0.01 μg/ml CDDP), 0.1 μg/ml CDDP group (cells added with 0.1 μg/ml CDDP), 1 μg/ml CDDP group (cells added with 1 μg/ml CDDP), 10 μg/ml CDDP group (cells added with 10 μg/ml CDDP), and 100 μg/ml CDDP group (cells added with 100 μg/ml CDDP). Six replicate wells were set in each group. After cells in each group were cultured for 48 h in a 37°C and 5% CO2 incubator, 20 μl of freshly prepared MTT solution (5 g/L) was added into each well. The cells were then continually cultured over a 4 h period, after which they were removed from the incubator to terminate the culturing process. The supernatant of the culture medium was then carefully removed, and 150 μl DMSO was added into each well. After 10 min of oscillation and reaction, the absorbance value of each well was measured at a wavelength of 490 nm by using an enzyme-linked immunosorbent, with the average optical density (OD) value of the 6 replicates calculated. The experiment was independently repeated 3 times.
Cell growth inhibition rate detection
First, the sensitivity of the 5 GC cells to CDDP was analyzed, and the results verified that the 5 GC cells were indeed in the logarithmic growth phase; the cells were then inoculated into a 96-well plate and added with CDDP with the final concentration of 1 μg/ml. Six replicate wells were set in each group. Once the cells in each group were cultured for 48 h in a 37°C and 5% CO2 incubator, 20 μl of freshly prepared MTT solution (5 g/L) was added into each well. After a continual incubation period over a 4-h period, the cells were removed from the incubator to terminate the culturing process. The supernatant of the culture medium was carefully removed, and 150 μl DMSO was added into each well. After a 10 min oscillation and reaction, the OD value of each well was measured at a wavelength of 490 nm by using an enzyme-linked immunosorbent, with the average value of the 6 replicate wells calculated in accordance with the following formula: 50% inhibiting concentration (IC50) = (OD value of the control group − OD value of the experimental group)/OD value of the control group × 100%. The experiment was independently repeated 3 times.
Second, the MKN45 and MKN28 cell lines were transfected and were assigned to 7 groups with 6 replicate wells set for each group. After transfection, cells in each group were cultured for 24 h in a 37°C and 5% CO2 incubator, followed by the addition of 20 μl freshly prepared MTT solution (5 g/L) into each well. The cells were continually cultured over a 4-h period and then removed from the incubator to terminate the culturing process. The supernatant of the culture medium was then carefully removed, and 150 μl DMSO was added into each well. After 10 min of oscillation and reaction, the OD value of each well was measured at the wavelength of 490 nm by using an enzyme-linked immunosorbent, and the average value of the 6 replicate wells was calculated by using the formula: IC50 = (OD value of the control group − OD value of the experimental group)/OD value of the control group × 100%. The experiment was independently repeated 3 times.
Cell proliferation detection
MKN45 and MKN28 cell lines were transfected and assigned to 6 groups in addition to the preparation of 6 replicate wells. After transfection, cells in each group were cultured for 24, 48, and 72 h in a 37°C and 5% CO2 incubator, followed by the addition of 20 μl freshly prepared MTT solution (5 g/L). The cells were continually cultured over a 4-h period before being removed from the incubator to terminate the culturing process. The supernatant of the culture medium was then carefully removed, and 150 μl DMSO was added into each well. After 10 min of oscillation and reaction, the OD value of each well was measured at the wavelength of 490 nm by using an enzyme-linked immunosorbent, and the average value of the 6 replicate wells was calculated. The OD value was considered to be a representation of cell proliferation in each group. The experiment was independently repeated 3 times.
qRT-PCR
Total RNA was extracted by using the Trizol 1-step method, and the purity and concentration of the RNA sample were determined by using a microplate reader (DNM-9606; Perlong Medical Equipment, Beijing, China). After cDNA was synthesized by using the PrimeScript RT-PCR Kit (Perfect Real-Time) (RR047A; Takara, Tokyo, Japan), it was used as a template. The miR-135b expression was determined by means of qRT-PCR with U6 regarded as the internal control. The expressions of MST1, p38MAPK, ERK1/2, multidrug resistance protein 1 (MDR1), multidrug resistance–associated protein 1 (MRP1), lung resistance–related protein (LRP), Bcl-2, and Bax were measured by qRT-PCR; β-actin was considered to be the internal control (Table 1). The reaction conditions were as follows: reverse transcription was conducted at 37°C for 60 min and inactivation of reverse transcriptase at 85°C for 5 min. qRT-PCR was then performed on the Bio-Rad instrument (10021337; Bio-Rad, Hercules, CA, USA), with the following reaction system: 21 µl 1 × SYBR premix Ex Taq mix (Takara), 2 µl cDNA, and 1 µl (10 nM) forward and reverse primers. The reaction conditions for the qRT-PCR were as follows: 3 min of predenaturation at 95°C, 45 cycles of 15 s of denaturation at 95°C, 20 s of annealing at 60°C, and 30 s of extension at 72°C. The mRNA expressions in each group were then calculated by using the 2−△△Ct method (20). The relative mRNA expressions were detected with the use of SYBR Green (1725270; Bio-Rad) qRT-PCR. The experiment was repeated 3 times.
TABLE 1.
Primer sequence for qRT-PCR
| Gene | Primer sequence, 5′–3′ |
|
|---|---|---|
| Forward | Reverse | |
| miR-135b | GCTTATGGCTTTTCATTCCT | GTGCAGGGTCCGAGGT |
| U6 | GTGCTCGCTTCGGCAGCACATATAC | AAAAATATGGAACGCTTCACGAATTTG |
| MST1 | CTCCTACAGCACCCGTTTGT | TGAGTTCTCCTCGTCGTCCT |
| p38MAPK | ACTGCCAAGGAGCATCTA | GAAGAGCCTGACCTACAGT |
| ERK1/2 | AATCACACGGTAGACACTGAAATGCC | CATCATCCCATCTAAAATGTCCCCTG |
| MDR1 | TGGGGCTGGACTTCCTCTCATGATGC | GCAGCAACCAGCACCCCAGCACCAAT |
| MRP1 | CTTCGCTGAGTTCCTGCGTA | GCTGAGCTGTCTCTGCAGTT |
| LRP | CAGCTGGCCATCGAGATCA | TCCAGTCTCTGAGCCTCATGC |
| β-actin | AGGCACCAGGGCGTGAT | GCCCACATAGGAATCCTTCTGAC |
Western blot analysis
After the collection of 1 × 10⁶ cells/ml of cells at the logarithmic growth phase from each group, the cells were split by cell lysis buffer cell lysate (ab152163, 1:1000; Abcam, Cambridge, United Kingdom), and total protein was extracted. The supernatant was removed following a 15 min centrifugation (4°C, 45 g), after which the protein concentration was determined in accordance with the Bradford method. An appropriate amount of solid-phase pH gradient strip solution protein was mixed with 30 μg of the protein sample. The protein on the slab rubber was subsequently transferred to the PVDF membrane after 2 h of electrophoresis with 10% SDS-PAGE. The membrane was then closed in 5% skimmed milk powder at room temperature for 2 h and washed 3 times with Tris-buffered saline with Tween 20 (TBST). The membrane was then immersed and incubated in a blocking solution (mouse anti-human β-actin mAb, diluted at 1:2000, was used as the internal control) composed of rabbit anti-human MST1 mAb (ab124787, 1:1000), mouse anti-human p38MAPK mAb (ab31828, 1:1000), rabbit anti-human ERK1/2 pAb (ab17942, 1:1000), mouse anti-human Bcl-2 mAb (ab692, 1:500), rabbit anti-human Bax mAb (ab32503, 1:1000), rabbit anti-human MDR1 mAb (ab1709041, 1:1000), MRP1 (ab24102, 1:20), LRP (ab92544, 1:50,000), and rabbit anti-human P-gp pAb (ab103477, 1:500) (all purchased from Abcam) overnight at 4°C. The membrane was then washed 3 times with TBST, and immersed in goat anti-mouse IgG (LY376009, 1:5000; Cell Signaling Technology, Danvers, MA, USA) and goat anti-rabbit IgG (ab6721, 1:2000; Abcam) solutions, respectively. After 2 h of reaction at room temperature, the membrane was washed 3 times by using TBST. The electrochemiluminescence method was subsequently used for color reaction, after which the membrane was tableted and scanned by a computer, with the test results preserved. ImageJ software (NIH) was used to determine the gray value of the target bands. The relative protein expressions were the gray value ratios of the target band to the reference band. The aforementioned experiment was repeated 3 times.
Flow cytometry
The cells were collected after 48 h of transfection, followed by washing 3 times with cooled PBS and centrifugation, after which the supernatant was removed. The cells were resuspended with PBS, and the concentration of the cells was adjusted accordingly to 1 × 10⁵ cells/ml. The cells were then fixed in precooled 1 ml 75% ethanol (−20°C), fixed at 4°C for 1 h, and centrifuged following the removal of the cooled ethanol. After the cells were washed twice with PBS, the supernatant was removed. Following the addition of 100 μl RNase A under conditions void of light, the cells were placed in a water bath at 37°C for 30 min, followed by staining with 400 μl propidium iodide (PI) (MilliporeSigma, Burlington, MA, USA). The cells were then cultured at 4°C for 30 min with the avoidance of light, with the cell cycle recorded at a wavelength of 488 nm using flow cytometry. The experiment was independently repeated 3 times.
After a transfection period of 48 h, the cells were treated by using non-EDTA trypsin and collected in a flow tube. After centrifugation, the supernatant was removed, and the cells were washed 3 times with cooled PBS followed by additional centrifugation with the supernatant removed. Next, Annexin-V-FITC, PI, and 4-(2-hydroxyethyl)-1-piperazineethanesulfonic acid (HEPES) buffers were made into Annexin-V-FITC/PI dye liquor at a ratio of 1:2:50 based on the instructions of the Annexin-V-FITC cell apoptosis detection kit (MilliporeSigma). Each 100 μl of dye liquor was used for the resuspension of 1 × 10⁶ cells. After being oscillated and mixed, the cells were incubated at room temperature for 15 min, followed by the addition of 1 ml 4-(2-hydroxyethyl)-1-piperazineethanesulfonic acid buffer, oscillation, and mixing. The relative fluorescence was determined at an excitation wavelength of 488 nm, whereas FITC and PI fluorescence was detected at 520 or 620 nm bandpass filters, respectively. Subsequently, cell apoptosis was determined, and the experiment was independently repeated 3 times.
Dual luciferase reporter gene assay
The biologic prediction site (http://www.microrna.org), as well as a dual luciferase reporter gene assay, was used to obtain verification as to whether MST1 was a direct target gene of miR-135b respectively. MST1 3′UTR gene fragment was artificially synthesized and introduced into pMIR-reporter (Huayueyang Biotechnology, Shanghai, China) by using SpeI and Hind III endonuclease sites. The mutational site of the complementary sequence of the seed sequence was designed on MST1 wild type. After restrictive endonuclease digestion was conducted, the target fragment was inserted into the pMIR-reporter report plasmid through T4 DNA ligase. The luciferase reporter plasmids wild type and mutant with correct sequences were then cotransfected with miR-135b into MKN45 and MKN28 cells (Shanghai Beinuo Biotechnology, Shanghai, China), respectively. After a 48 h transfection, the cells were collected and lysed, with the luciferase activity detected by using a Luciferase Detection Kit (K801-200; BioVision, Milpitas, CA, USA). The experiment was independently repeated 3 times.
Tumor xenograft in nude mice
Thirty nude mice (4 wk of age) weighing 14–16 g, purchased from Shanghai Laboratory Animal Center (Shanghai, China), were randomly grouped into 6 groups of 5 mice each. Cell inoculation was then performed after the administration of anesthesia. The cells confirmed to be at the logarithmic growth phase in each transfected group were then resuspended in 50% Matrigel (Corning, Corning, NY USA), with the cell concentration adjusted to 1 × 10⁷ cells/ml, after which 0.5 ml of single cell suspension (containing 5 × 10⁶ cells) was injected into the hypodermis of the left armpit of each mouse. After 3 d of free tumor growth, 5 mg/kg CDDP was intraperitoneally injected into the mice every 3 d, with the exception of the mice in the NC and miR-135b mimic groups, which were used as the control groups. A digital caliper [length and width (mm)] was used to determine tumor size, and the volume (mm3) was estimated by using the formula (length × width2)/2. The tumor growth rate of the mice was assessed by comparing the tumor volume on the day of treatment vs. that of the first day (total, 21 d).
Hematoxylin and eosin staining
After being fixed in 4% polyoxymethylene (p1110-100; Tideradar Beijing Technology Co., Ltd., Beijing, China) for 16–18 h, the GC and adjacent normal tissues were dehydrated in gradient alcohol (70, 80, 90, 95, and 100%) (1.5 h/time), cleared in xylene (X820, 585–500 ml; HZ Biotech, Anhui, China) twice (15 min/time), then immersed in wax, then embedded in paraffin, and then cut into 4 μm sections (preparing some sections for immunohistochemistry). After being embedded with embedding paper, the sections were dehydrated by using the routine method, immersed in wax, embedded in paraffin, and cut into sections. Following routine dewaxing of the cells, hematoxylin (C0007; Baoman Biotech, Shanghai, China) staining was performed for 10 min at room temperature, after which the cells were washed under high-pressure running water for 30–60 s until the cell nucleus appeared to have a blue color. Next, 1% hydrochloric acid alcohol was used to differentiate the cells for 1 min, after which the cells were washed with running water for 1 min before the following procedures were performed: eosin staining at room temperature for 5–10 min, gradient alcohol dehydration (1 min each), and xylene clearing twice (1 min each) and mounting by neutral balsam. An ordinary optical microscope (XSP-8CA; Optical Instrument Factory, Shanghai, China) was used to photograph the cells (for observation of morphologic changes).
Statistical analysis
All experimental data were analyzed by using SPSS v.21.0 (IBM, Armonk, NY, USA) with the mean and sd calculated. All experiments were repeated at least 3 times. Analysis between groups was conducted by using Student’s t test. Data with a skewed distribution were detected by using a nonparametric Wilcoxon signed rank test. The Shapiro-Wilk method was used to detect the numerical normal distribution of data among multiple groups. For multiple group data analysis, 1-way ANOVA was used, with values of P < 0.05 considered indicative of statistical significance.
RESULTS
MiR-135b affects the progression of GC through the MAPK signaling pathway by targeting MST1
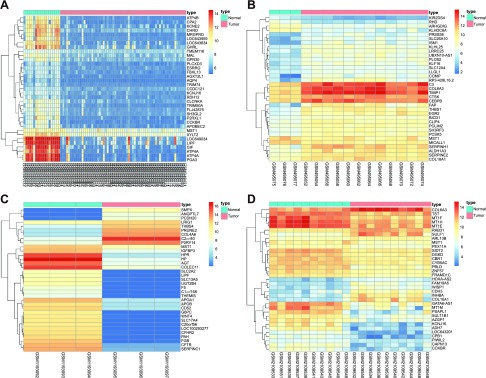
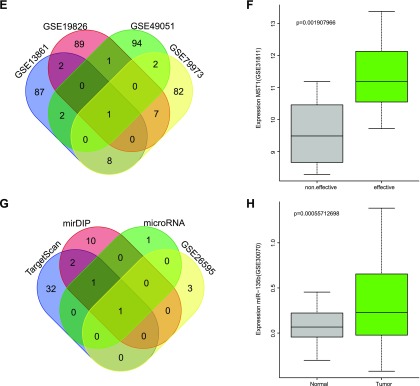
After the GEO database was explored in the GC chip data analysis, 614 DEGs were obtained in GSE13861, 2168 in GSE19826, 2535 in GSE49051, and 1767 in GSE79973 (Fig. 1A–D). Venn analysis was performed on the intersection of the first 100 genes of the 4 datasets as determined from the assessment of these 4 chip datasets (Fig. 1E). The results revealed that only the MST1 gene was present in the results of the 4 data analyses at the same time, with the highest MST1 expression detected among the GC samples between the 4 datasets. The function of MST1 was further investigated through analysis of MST1 expression in GSE31811. The dataset included the effective sample group with CDDP treatment of GC cells and the ineffective sample group with CDDP treatment of GC cells. Based on analysis of MST1 gene expression in the dataset (Fig. 1F), the results revealed that MST1 was markedly increased in the effective sample group with CDDP treatment of GC cells, indicating that MST1 could exert adverse effects in the survival of GC cells (reflected by the higher expression levels of MST1 in GC cells). The high expression of MST1 could also improve the sensitivity of GC cells to CDDP.
Figure 1.
GEO data analysis and miRNA prediction revealed that miR-135b affects the progression of GC through the MAPK signaling pathway by targeting MST1. A–D) Thermal maps of gene expression in the 4 results of database analysis [GSE13861 (A), GSE19826 (B), GSE49051 (C), and GSE79973(D)]. The abscissa represents the sample number, the ordinate represents the name of DEGs, and the upper right histogram is the color gradation (color change from top to bottom meant value from large to small of chip expression data). In the map, each rectangle corresponds to a sample expression value, each column represents the expression of all genes in each sample, the dendrogram on the left is cluster analysis results of various genes from different samples, the top bar is the sample type, and the upper right box indicates the reference for sample color (blue for normal control samples, red for tumor samples). E) The blue part indicates the selected gene number in GSE13861, the red is selected DEGs in GSE19826, green is selected genes in GSE49051, yellow is selected DEGs in GSE79973, and the intersection of the 4 datasets is MST1. F) Expression of MST1 gene in GSE31811. The abscissa is the sample type, the ordinate is the gene name and the selected dataset name, the gray box represents the gene expression in the ineffective treatment with CDDP, the green box shows the effective treatment with CDDP, and the P value is located in the upper left corner of the map. G) Prediction results of the miRNA that mediated MST1 in the TargetScan, mirDIP, and microRNA.org databases. The intersection of the 4 groups was obtained through analysis of GC miRNA dataset GSE26595. Blue indicates the prediction results of the TargetScan database, red indicates the prediction results of the mirDIP database, green indicates the prediction results of the microRNA.org database, red corresponds to the GSE26595 database, the intersection of the 4 groups is hsa-miR-135b. H) Expression of hsa-miR-135b in GSE30070. The abscissa is the sample type, the ordinate is the gene name and the selected dataset, the gray box refers to the expression of hsa-miR-135b in the normal control group, and the green box refers to the expression of hsa-miR-135b in GC group. The difference of the miRNA expression level between the 2 samples was significant, with the P value in the upper left corner of the graph.
The related signaling pathways in GC were further researched, and based on the retrieval of the metabolic pathway of GC in the Kyoto Encyclopedia of Genes and Genomes database, the MAPK signaling pathway in GC played a key role (map05226) during the period of transformation of normal gastric mucosa into diffuse-type adenocarcinoma. Studies have suggested that MST1 may regulate the MAPK signaling pathway and promote cell apoptosis (21). However, it remains unclear as to whether MST1 regulates the progression of GC through the MAPK signaling pathway in GC. Therefore, the TargetScan database, the mirDIP database, and the microRNA.org database were explored in an attempt to predict the miRNAs that regulate MST1, as well as to further identify the effects of MST1 on GC. The prediction results revealed 36 potential regulatory miRNAs in the TargetScan database; 14 miRNAs were found in the mirDIP database, and 3 were found in the microRNA.org database. A differential analysis was performed in the GSE26595 dataset to confirm these observations, and the results found 4 differentially expressed miRNAs in GC. Venn analysis was subsequently performed, and the results of the 3-database predictions and GSE26595 differential analysis, and the intersection of the 4 groups were determined (Fig. 1G); hsa-miR-135b expression was identified as the only intersection among the 4 groups. The expression of the miRNA in GC was further investigated through analysis of the miRNA expression of GSE30070 (Fig. 1H). The results indicate that there was a markedly higher amount of hsa-miR-135b expression in the tumor samples compared with the normal control, which provided added verification regarding the impact of miRNA on GC. These findings suggest that hsa-miR-135b could potentially affect the MAPK signaling pathway by regulating the expression of MST1, which ultimately enhances the progression of GC.
GC MKN28 cell line is the most sensitive and the MKN45 cell line is the least sensitive to CDDP
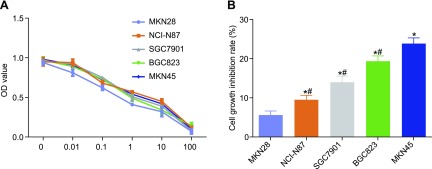
The MTT assay was applied in the differential analysis of the sensitivity of the 5 cell lines to CDDP. The results obtained are depicted in Fig. 2A. The changes observed in cell inhibition rate were in a concentration-dependent manner to the drug concentration. As the reaction of 1 μg/ml CDDP reached a plateau, 1 μg/ml CDDP was selected to calculate the IC50 in an attempt to minimize cytotoxicity. The MTT assay was used to detect and calculate the IC50 value of the 5 cell types (MKN28, NCI-N87, SGC7901, BGC823, and MKN45) (Fig. 2B). IC50 values of MKN28, NCI-N87, SGC7901, BGC823, and MKN45 were 4.62, 9.51, 13.98, 19.35, and 23.87, respectively. Therefore, among the 5 cell lines, the MKN28 cell line was found to have the greatest sensitivity to CDDP, and the MKN45 cell line had the weakest sensitivity to CDDP (both, P < 0.05).
Figure 2.
MTT assay results identified GC MKN28 as the cell line most sensitive to CDDP and the MKN45 cell line as the least sensitive to it. A) Cell proliferation in each group treated with 0–100 μg/ml CDDP. B) Difference of sensitivity of cells in each group treated with 1 μg/ml CDDP. The data are presented as means ± sd; different time points in A were performed with repeated measures ANOVA and in B with 1-way ANOVA. The experiment was repeated 3 times. *P < 0.05 compared with MKN28 cells, #P < 0.05 compared with MKN45 cells.
MST1 is a target gene of miR-135b
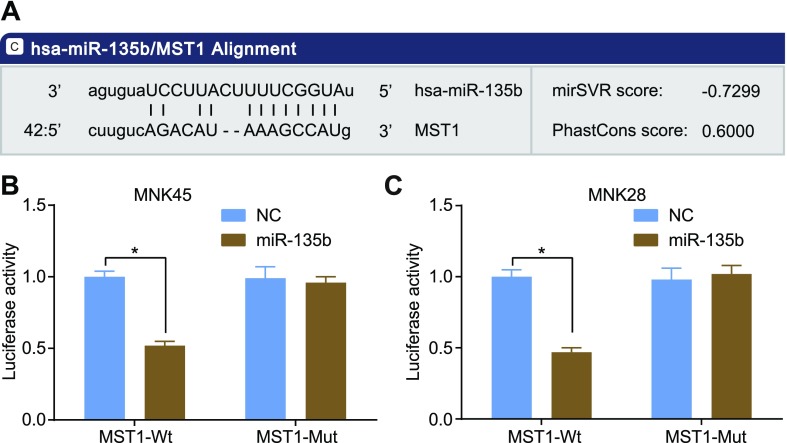
The relationship between MST1 and miR-135b was verified by using the dual luciferase reporter gene assay and microRNA.org. Based on the results, the target site at which MST1 combined with corresponding miR-135b and the sequence of the 3′-UTR zone in which MST1 mRNA combined with miR-135b were determined (Fig. 3A) by using online prediction software (http://www.microrna.org). The results of the dual luciferase reporter gene assay strongly suggest that the miR-135b mimic had no effect on the luciferase activity of the mutant miR-135b/MST1 plasmid, whereas it was found to down-regulate the wild-type miR-135b/MST1 plasmid in the MKN45 (Fig. 3B) and MKN28 cells (Fig. 3B) (P < 0.05), indicating that miR-135b can specifically bind to MST1, making MST1 its target gene.
Figure 3.
Dual luciferase reporter assay and microRNA.org showed that MST1 is a target gene of miR-135b in MKN45 and MKN28 cells. A) Sequence of the 3′-UTR zone in which MST1 mRNA combined with miR-135b. B) Luciferase activity of MST1-wild type (Wt) and MST1-mutant (Mut) in MKN45. C) Luciferase activity of MST1-wild type (Wt) and MST1-mutant (Mut) in MKN28. The results of luciferase activity are expressed as means ± sd, and the data were analyzed by using Student’s t test. The experiment was repeated 3 times. *P < 0.05 compared with the NC group.
miR-135b overexpression inhibits mRNA and protein expression of MST1
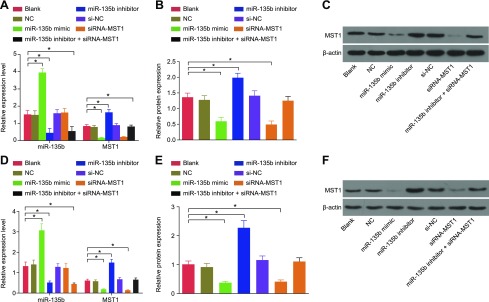
The effect miR-135b had on MST1 expression was detected by using qRT-PCR and Western blot analysis to examine the expression of MST1 in the MKN45 and MKN28 cells after transfection. The results revealed that there was no significant difference in relation to the mRNA and protein expression of MST1 in MKN45 and MKN28 cells among the blank, NC, and negative control of siRNA-MST1 (si-NC) groups. Compared with cells in the blank group and the NC group, the expression of miR-135b in MKN45 and MKN28 cells was significantly increased in the miR-135b mimic group, whereas there was no significant difference observed in the siRNA-MST1 group; the mRNA and protein expression of MST1 decreased in the miR-135b mimic and siRNA-MST1 groups; the miR-135b inhibitor group presented with significantly lower levels of miR-135b expression, while mRNA and protein expression of MST1 was elevated (all P < 0.05); and the miR-135b inhibitor + siRNA-MST1 group showed decreased expression of miR-135b but had no significant difference in MST1 expression (Fig. 4). These findings were highly indicative of the significant inhibitory effect miR-135b overexpression had on MST1 expression.
Figure 4.
The results of qRT-PCR and Western blot analysis provided evidence that overexpression of miR-135b inhibits mRNA and protein expression of MST1. A) the miR-135b expression and mRNA expression of MST1 in MKN45 cells. B) Protein expression of MST1 in MKN45 cells. C) Protein bands of MST1 and β-actin in MKN45 cells. D) MiR-135b expression and mRNA expression of MST1 in MKN28 cells. E) Protein expression of MST1 in MKN28 cells. F) Protein bands of MST1 and β-actin in MKN28 cells. The expression of GC cell lines after transfection is expressed as mean ± sd, and the data were detected by using 1-way ANOVA. The experiment was repeated 3 times. *P < 0.05 compared with the NC group.
MiR-135b overexpression activates the MAPK signaling pathway
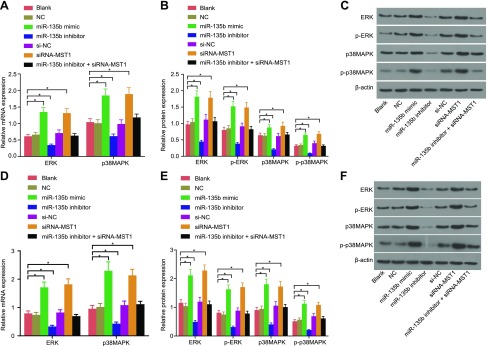
qRT-PCR and Western blot analysis were used to determine the effect of miR-135b on the MAPK signaling pathway, the results of which indicated that there was no significant difference regarding the mRNA and protein expression of the related factors among the blank, NC, and si-NC groups. Compared with cells in the blank and NC groups, the expressions of p38MAPK and ERK1/2 and the extent of p38MAPK and ERK1/2 phosphorylation were increased in the miR-135b mimic and siRNA-MST1 groups, whereas they were significantly decreased in the miR-135b inhibitor group (all P < 0.05) (Fig. 5). These findings suggest that miR-135b overexpression could potentially result in the activation of the MAPK signaling pathway by targeting MST1.
Figure 5.
According to qRT-PCR and Western blot analysis, the overexpression of miR-135b activates the MAPK signaling pathway. A) mRNA expressions of MAPK signaling pathway–related genes in MKN45 cells. B) Protein expressions of MAPK signaling pathway–related genes in MKN45 cells. C) Protein bands of MAPK signaling pathway–related genes in MKN45 cells. D) mRNA expressions of MAPK signaling pathway–related genes in MKN28 cells. E) Protein expressions of MAPK signaling pathway–related genes in MKN28 cells. F) Protein bands of MAPK signaling pathway–related genes in MKN28 cells. The expression of GC cell lines after transfection is expressed as mean ± sd, and the data were detected by using 1-way ANOVA. The experiment was repeated 3 times. *P < 0.05 compared with the NC group.
Down-regulation of miR-135b promotes cell apoptosis in MKN28 cells and MKN45 cells
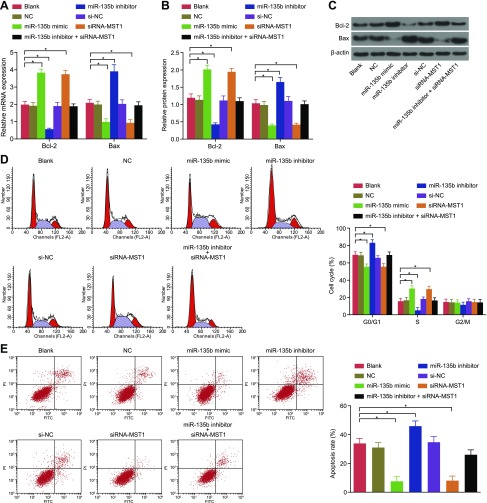
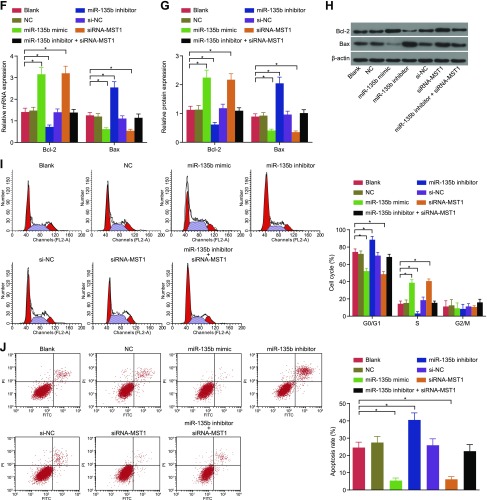
Cell apoptosis was detected by means of flow cytometry, and mRNA and protein expression of apoptosis-related genes was detected by using qRT-PCR and Western blot analysis (Fig. 6). Based on the results, there was no significant difference in the ratio of apoptotic cells or cell cycle detected among the blank, NC, and si-NC groups. Compared with cells in the blank and the NC groups, the cells in the miR-135b mimic and siRNA-MST1 groups presented with fewer arrested cells at the G0 phase and an increased number of arrested cells at the S phase, suggesting that a significant decrease occurred in the rate of cell apoptosis, while the contrary occurred in the cells in the miR-135b inhibitor group (all P < 0.05). Meanwhile, the results of qRT-PCR and Western blot analysis indicated that there was no significant difference regarding the expression of the apoptosis-related genes among the blank, NC, and si-NC groups. Compared with the blank and NC groups, the miR-135b mimic group and the siRNA-MST1 group presented with decreased Bax expression and increased expression of Bcl-2, whereas the miR-135b inhibitor group exhibited the opposite trend (all P < 0.05). These findings indicate that the poor expression of miR-135b could improve cell apoptosis in MKN28 cells and MKN45 cells.
Figure 6.
Results of flow cytometry showed that decreased expression of miR-135b induces cell apoptosis in MKN28 cells and MKN45 cells. A) mRNA expression of apoptosis-related factors in MKN45 cells after transfection. B) Protein expression of apoptosis-related factors in MKN45 cells after transfection. C) Protein bands of apoptosis-related factors in MKN45 cells after transfection. D) Cell cycle of MKN45 cells. E) Cell apoptosis of MKN45 cells. F) mRNA expression of apoptosis-related factors in MKN28 cells after transfection. G) Protein expression of apoptosis-related factors in MKN28 cells after transfection. H) Protein bands of apoptosis-related factors in MKN28 cells after transfection. I) Cell cycle of MKN28 cells. J) Cell apoptosis of MKN28 cells. The data of expression of apoptosis-related factors, cell cycle, and cell apoptosis in GC cells after transfection are expressed as means ± sd, and the data were detected by using 1-way ANOVA. The experiment was repeated 3 times. *P < 0.05 compared with the NC group.
Down-regulation of miR-135b restrains cell proliferation in MKN28 cells and MKN45 cells
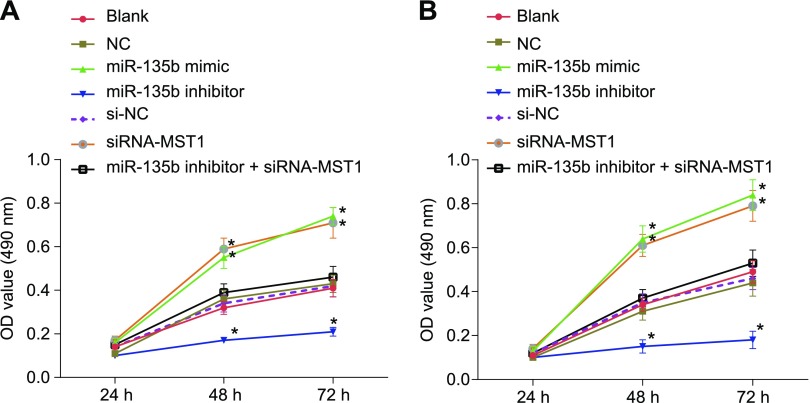
The MTT assay was performed to assess cell proliferation in the MKN28 and MKN45 cells. The results indicate that there was no significant difference in terms of the cell proliferation ability after 24 h in each group; however, remarkable changes were observed regarding cell proliferation ability after 48 and 72 h in each group. No significant difference in cell proliferation at the same time point was found among the blank, NC, and si-NC groups. Compared with cells in the blank and NC groups, cell proliferation ability in the miR-135b mimic and siRNA-MST1 groups was significantly enhanced, whereas a contrasting result was obtained in the miR-135b inhibitor group (all P < 0.05) (Fig. 7). The data showed that poor expression of miR-135b inhibits cell proliferation in MKN28 cells and MKN45 cells.
Figure 7.
Down-regulation of miR-135b inhibits cell proliferation of MKN28 cells and MKN45 cells according to MTT assay. A) Cell proliferation of MKN45 cells. B) Cell proliferation of MKN28 cells. The proliferation activity of GC cells in each group after transfection is expressed as means ± sd, and comparisons among different time points were performed with repeated measures ANOVA. The experiment was repeated 3 times. *P < 0.05 compared with the NC group.
MKN28 cells and MKN45 cells treated with CDDP have increased MST1 expression
qRT-PCR and Western blot analysis were conducted to detect the expression of MST1 in MKN45 and MKN28 cells. The results showed that there was a significant increase in the expression of MST1 in cell lines treated with CDDP compared with homogeneous parental cells (P < 0.05). Compared with MKN28/CDDP, the expression of MST1 in MKN45/CDDP presented with a significant increase (P < 0.05) (Fig. 8). These data indicate that there is an elevation in the expressions of MST1 in the MKN45 and MKN28 cells after treatment with CDDP.
Figure 8.
The results from qRT-PCR and Western blot analysis showed that MST1 expression is increased in MKN45 and MKN28 cells after treatment with CDDP. A) Protein expression of MST1. B) mRNA expression of MST1. C) Protein bans of MST1 and β-actin. The expression of MST1 is expressed as mean ± sd, and pairwise comparisons were analyzed by using Student’s t test. The experiment was repeated 3 times. *P < 0.05 compared with homologous parental cells, #P < 0.05 compared with MKN28/CDDP.
Poor expression of miR-135b decreases cell resistance to CDDP in MKN28 cells and MKN45 cells
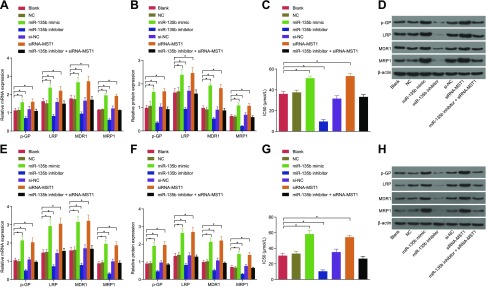
The effects of miR-135b on cell resistance to CDDP in MKN28 cells and MKN45 cells were detected by using qRT-PCR and Western blot analysis. As illustrated in Fig. 9, the results revealed that no significant difference occurred in relation to the mRNA and protein expression of the related factors among the blank, NC, and si-NC groups. Compared with the blank and NC groups, the expressions of MDR1, MRP1, LRP, and P-glycoprotein (p-GP) were elevated in the miR-135b mimic and siRNA-MST1 groups (all P < 0.05), whereas notable reductions were observed in the miR-135b inhibitor group (all P < 0.05). These results indicate that miR-135b significantly up-regulated the expression of drug resistance genes and proteins in cells.
Figure 9.
Results of qRT-PCR, Western blot analysis, and MTT assay evaluated the decreased expression of miR-135b, which further revealed decreased expressions of MDR1, MRP1, LRP, and p-GP and decreased cell resistance to CDDP. A) mRNA expression of drug-resistant genes in MKN45 cells. B) Protein expression of drug-resistant genes in MKN45 cells after transfection. C) IC50 value of MKN45 cells in each group after transfection. D) Protein bands of drug-resistant genes in MKN45 cells after transfection. E) mRNA expression of drug-resistant genes in MKN28 cells. F) Protein expression of drug-resistant genes in MKN28 cells after transfection. G) IC50 value of MKN28 cells in each group after transfection. H) The protein bands of drug-resistant genes in MKN28 cells after transfection. The expression of drug-resistant genes related to GC cells after transfection and the IC50 is expressed as mean ± sd, and the data were detected by using 1-way ANOVA. The experiment was repeated 3 times. *P < 0.05 compared with the NC group.
Moreover, the value of IC50 (μM) was measured in each group by using the MTT assay. The results revealed a sharp increase in the IC50 of the cells in both the miR-135b mimic group and the siRNA-MST group, whereas a reciprocal result was observed in the miR-135b inhibitor group compared with the blank and NC groups (all P < 0.05). The IC50 values of cells in the blank, NC, miR-135b mimic, miR-135b inhibitor, siRNA-MST, and miR-135b inhibitors + siRNA-MST1 groups were 37.12, 37.50, 51.20, 53.20, 9.56, and 37.23, respectively, indicating that the poor expression of miR-135b could lead to a decrease in cell resistance to CDDP in MKN28 cells and MKN45 cells.
Poor expression of miR-135b increases protein expressions of MST1, resulting in the inhibition of cell CDDP resistance
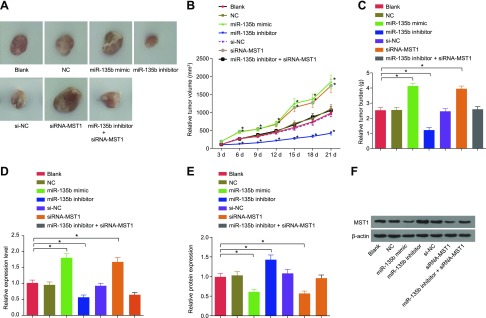
Western blot analysis and qRT-PCR were performed to measure the expressions of miR-135b and MST1. As shown in Fig. 10, the results obtained were as follows: in the first 3 d, there was no significant difference in the size of tumor growth; on d 6, there was a notable difference in the size, volume and quality of tumors; on d 12, there was a significant increase in the tumor in miR-135b mimic and siRNA-MST1 groups; and on d 21, there was a remarkable increase in the size, volume, and quality of tumor in the miR-135b mimic group and the siRNA-MST1 group (all P < 0.01). The aforementioned indicators decreased in the miR-135b inhibitor group (P < 0.05) compared with the blank and NC groups. Compared with cells in the blank and NC groups, the miR-135b mimic group and the siRNA-MST1 groups presented with increased miR-135b expression but reduced MST1 expression (all P < 0.05), whereas the miR-135b inhibitor group had lowered expressions of miR-135b and elevated levels of MST1 expression (all P < 0.05). The expression of miR-135b was decreased in the miR-135b inhibitor + siRNA-MST1 group (P < 0.05). These results showed that miR-135b overexpression could inhibit the protein expression of MST1. The comparison of the blank group without CDDP treatment vs. the miR-135b mimic group treated with CDDP revealed that decreased miR-135b expression could restrain the GC cell growth in vivo, thus contributing to the decrease in CDDP resistance.
Figure 10.
MiR-135b down-regulation results in an increase in the protein expression of MST1 and inhibits cell CDDP resistance, according to the results of Western blot analysis and qRT-PCR. A) Size of tumor. B) Volume of tumor treated with CDDP in each group after transfection. C) Weight of tumor treated with CDDP in each group after transfection. D) Expression of miR-135b in vivo in each group after transfection. E) Expression of MST1 in vivo in each group after transfection. F) Protein band of MST1 in vivo in each group after transfection. The size, volume, and weight of tumors in nude mice and the expression of miR-135b and MST1 are expressed as means ± sd. The data among multiple groups were compared by using 1-way ANOVA, and comparisons among different time points were performed with repeated measures ANOVA. The experiment was repeated 3 times. *P < 0.05 compared with the NC group.
Decreased miR-135b expression significantly promotes CDDP-induced GC cell apoptosis
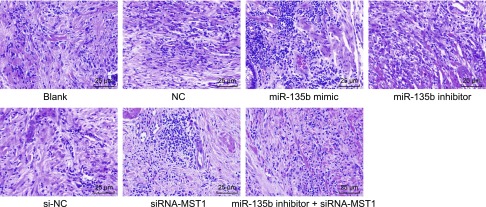
Hematoxylin and eosin staining was performed to assess cell conditions and to verify the relation between miR-135b and CDDP-induced GC cell apoptosis. After hematoxylin and eosin staining, the tumor tissue sections were observed under a light microscope (Fig. 11), and the results obtained were as follows: staining morphology in the blank, NC, and miR-135b inhibitor + siRNA-MST1 groups was essentially the same, with the presence of a few nuclear divisions, and scattered schistose coagulation necrosis, focal necrosis, and cancer nests. In the miR-135b mimic and the siRNA-MST1 groups, there were cancer cell masses of different sizes, a large number of schistose coagulation necrosis, and focal necrosis. In addition, the tumor cell nuclei were large and deeply stained with obvious heteromorphosis, as well as pathologic mitosis. The cells in the miR-135b inhibitor group presented with the least shallow nuclei staining and heteromorphosis. These results indicate that the down-regulation of miR-135b could significantly promote CDDP-induced GC cell apoptosis.
Figure 11.
Hematoxylin and eosin staining strongly indicate that decreased miR-135b and increased MST1 stimulate CDDP-induced GC cell apoptosis (×400). Scale bars, 25 µm.
DISCUSSION
GC is a type of malignancy arising from the lining of the stomach with a complicated treatment and prognosis (22). A previously conducted study highlighted the key role played by miR-135a in the repression of GC as it functions as an innovative mechanism in relation to the miRNA-mediated KIFC1 expression in cancer cells (23). MST1, a serine/threonine kinase, is activated during cellular stress, which results in an increase in the rate of cell death through the activation of downstream signaling targets such as JNK/p38 MAPK, histone H2B, and FOXO (24). Because there is accumulative evidence regarding the in vitro effects of miR-135b on CDDP resistance of GC cells via the MAPK signaling pathway by targeting MST1, the central objective of the present study was to thoroughly verify the aforementioned hypothesis. The key findings of the study provide evidence suggesting that the down-regulation of miR-135b restrained the biologic processes of cell proliferation and induced cell apoptosis, resulting in the inhibition of CDDP resistance of GC cells in connection with inactivation of the MAPK signaling pathway by negatively targeting MST1 in vivo and in vitro.
GC tissues presented with low levels in MST1 expression and higher miR-135b expression. Some findings have suggested that there is an elevation in miR-135b expression in clinical samples compared with the corresponding epithelium; the average expression of miR-135b in GC tissues was notably higher than in the normal epithelium (25). Moreover, hsa-miR-135b has been identified as a promising biomarker for gastric carcinogenesis because its expression has been found to be up-regulated in gastric lesions compared with normal gastric mucosa and intestinal-type gastric adenocarcinoma samples (17). A previous study concluded that MST1 and cyclophilin D expressions were notably reduced in gemcitabine-resistant pancreatic cancer tissues and cell lines (24). MST1 was also found to be elevated in control patients compared with patients with stage I colorectal cancer during early colorectal cancer examinations (26). MST1 could also be activated by gemcitabine, making it capable of facilitating cancer cell death by means of complexation with mitochondrial protein cyclophilin D (24). The results obtained during the present study confirmed that miR-135b targeted MST1 and that it had a negative correlation with MST1 in GC tissues.
Moreover, our study revealed that the poor expression of miR-135b stimulated the expression of MST1 as well as GC cell apoptosis, while inhibiting GC cell proliferation and CDDP resistance of GC cells by inactivating the MAPK signaling pathway. This study showed that gene levels (including MDR1, MRP1, LRP, p-GP, and Bcl-2) were up-regulated, whereas Bax was down-regulated, in GC cells. MDR1 has been highlighted as a crucial factor during drug therapy, with its related processes often reflective of the degree of interindividual variability that has been subsequently genetically verified (27). Based on a number of studies, MDR has been identified as a major cause of chemotherapeutic treatment failure in various cases of cancer (28). A previous study showed that the overexpression of Runx3 could activate GC cells to chemotherapeutic drugs by down-regulating the expressions of Bcl-2, MDR1, and MRP1genes (29). TNF-related apoptosis-inducing ligand has also been associated with the reversal of multidrug resistance in GC cases because it may induce cell death and proliferation as well as suppress the chemotherapy drug cancer cells by reducing drug-resistant gene expressions such as MDR1 and LRP (30). A few major pathways are known for their ability to up-regulate Bax and activate caspase-3, which influences the antitumor response of aspirin and indomethacin in GC cells and suggests that Bax is a key factor in the chemoprevention of GC (31). In addition, MST1 kinase has been speculated to regulate H2O2-induced cell apoptosis in connection with anticancer drugs such as CDDP in a p53-dependent manner (32). These findings strongly indicate that the down-regulation of miR-135b could potentially repress particular GC genes and promote the expression of Bax, which results in the inhibition of GC cell growth in a process that culminates in CDDP resistance.
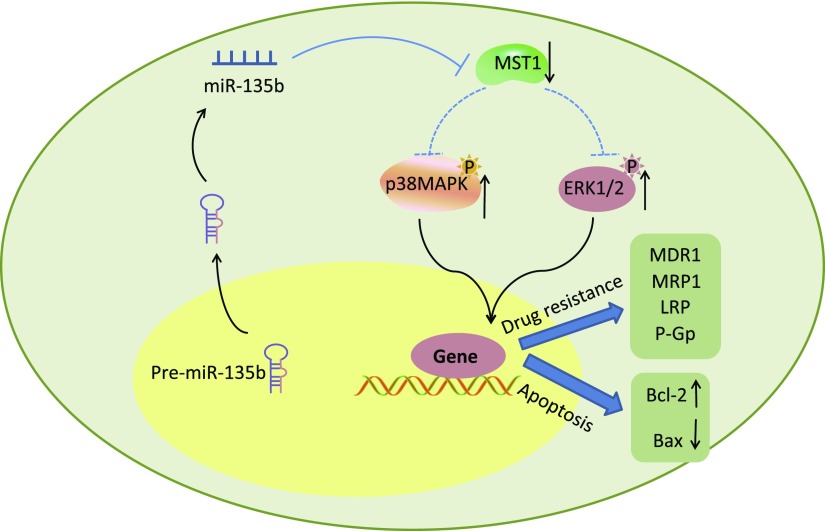
In summary, these study findings strongly indicate that miR-135b is involved in GC cells. The down-regulation of miR-135b leads to the inactivation of the MAPK signaling pathway and elevation of MST1 expression, in turn resulting in the enhancement of apoptosis, inhibition of GC proliferation, and CDDP resistance (Fig. 12). The down-regulation of miR-135b is beneficial in the suppression of GC cell proliferation and CDDP resistance in addition to the stimulation of GC cell apoptosis, hence highlighting the potential of miR-135b as a novel target in the treatment of GC, by lowering GC cell resistance to CDDP. However, due to the small sample size in GC cell lines, this study alone is not sufficient to scientifically prove the hypothesis and experiment. Therefore, additional large-scale studies on the molecular mechanisms of miR-135b–based GC therapeutic agents are required to further elucidate the role of miR-135b in GC.
Figure 12.
The mechanism map shows that down-regulation of miR-135b induced apoptosis and inhibited proliferation and CDDP resistance of GC cells by inactivating the MAPK signaling pathway and increasing the expression of MST1.
ACKNOWLEDGMENTS
The authors acknowledge the reviewers for their helpful comments on this paper. This research was supported by the National Natural Science Foundation of China (81572985, 81371508, and 31000471). The authors declare no conflicts of interest.
Glossary
- CDDP
cis-diamminedichloroplatinum
- DEGs
differentially expressed genes
- GC
gastric cancer
- GEO
Gene Expression Omnibus
- IC50
50% inhibiting concentration
- LRP
lung resistance–related protein
- MDR1
multidrug resistance protein 1
- MRP1
multidrug resistance–associated protein 1
- miRNA
microRNA
- miR-135b
microRNA-135b
- MST1
mammalian ste20-like kinase-1
- MTT
3-[4,5-dimethylthiazol-2-yl]-2,5 diphenyl tetrazolium bromide
- NC
negative control
- OD
optical density
- qRT-PCR
quantitative RT-PCR
- p-GP
P-glycoprotein
- PI
propidium iodide
- si-NC
negative control of siRNA-MST1
- siRNA
small interfering RNA
- TBST
Tris-buffered saline with Tween 20
AUTHOR CONTRIBUTIONS
J. Zhou and Q. Chen conceived and designed the study; J. Zhou was involved in data collection; J. Zhou and Q. Chen performed the statistical analysis and preparation of figures; J. Zhou and Q. Chen drafted the manuscript; and both authors read and approved the final manuscript.
REFERENCES
- 1.Guggenheim D. E., Shah M. A. (2013) Gastric cancer epidemiology and risk factors. J. Surg. Oncol. 107, 230–236 [DOI] [PubMed] [Google Scholar]
- 2.Chen L., Min L., Wang X., Zhao J., Chen H., Qin J., Chen W., Shen Z., Tang Z., Gan Q., Ruan Y., Sun Y., Qin X., Gu J. (2015) Loss of RACK1 promotes metastasis of gastric cancer by inducing a miR-302c/IL8 signaling loop. Cancer Res. 75, 3832–3841 [DOI] [PubMed] [Google Scholar]
- 3.Xie X. Q., Zheng K. C., Wu B. S., Chen T. H., Lai S. R., Lin Z. S., Aoki K. (2014) Differences in the levels of gastric cancer risk factors between Nanjing and Minqing counties, China. J. Prev. Med. Public Health 47, 281–287 [DOI] [PMC free article] [PubMed] [Google Scholar]
- 4.Shimazu T., Asada K., Charvat H., Kusano C., Otake Y., Kakugawa Y., Watanabe H., Gotoda T., Ushijima T., Tsugane S. (2015) Association of gastric cancer risk factors with DNA methylation levels in gastric mucosa of healthy Japanese: a cross-sectional study. Carcinogenesis 36, 1291–1298 [DOI] [PubMed] [Google Scholar]
- 5.Figueiredo C., Garcia-Gonzalez M. A., Machado J. C. (2013) Molecular pathogenesis of gastric cancer. Helicobacter 18(Suppl 1), 28–33 [DOI] [PubMed] [Google Scholar]
- 6.Cervantes A., Roda D., Tarazona N., Roselló S., Pérez-Fidalgo J. A. (2013) Current questions for the treatment of advanced gastric cancer. Cancer Treat. Rev. 39, 60–67 [DOI] [PubMed] [Google Scholar]
- 7.Kim Y. K., Yu J., Han T. S., Park S. Y., Namkoong B., Kim D. H., Hur K., Yoo M. W., Lee H. J., Yang H. K., Kim V. N. (2009) Functional links between clustered microRNAs: suppression of cell-cycle inhibitors by microRNA clusters in gastric cancer. Nucleic Acids Res. 37, 1672–1681 [DOI] [PMC free article] [PubMed] [Google Scholar]
- 8.Lu M., Huang Y., Sun W., Li P., Li L., Li L. (2018) miR-135b-5p promotes gastric cancer progression by targeting CMTM3. Int. J. Oncol. 52, 589–598 [DOI] [PubMed] [Google Scholar]
- 9.Su W., Mo Y., Wu F., Guo K., Li J., Luo Y., Ye H., Guo H., Li D., Yang Z. (2016) miR-135b reverses chemoresistance of non-small cell lung cancer cells by downregulation of FZD1. Biomed. Pharmacother. 84, 123–129 [DOI] [PubMed] [Google Scholar]
- 10.Zhou L., Qiu T., Xu J., Wang T., Wang J., Zhou X., Huang Z., Zhu W., Shu Y., Liu P. (2013) miR-135a/b modulate cisplatin resistance of human lung cancer cell line by targeting MCL1. Pathol. Oncol. Res. 19, 677–683 [DOI] [PubMed] [Google Scholar]
- 11.Song H., Mak K. K., Topol L., Yun K., Hu J., Garrett L., Chen Y., Park O., Chang J., Simpson R. M., Wang C. Y., Gao B., Jiang J., Yang Y. (2010) Mammalian Mst1 and Mst2 kinases play essential roles in organ size control and tumor suppression. Proc. Natl. Acad. Sci. USA 107, 1431–1436 [DOI] [PMC free article] [PubMed] [Google Scholar]
- 12.Li P., Xue W. J., Feng Y., Mao Q. S. (2016) Long non-coding RNA CASC2 suppresses the proliferation of gastric cancer cells by regulating the MAPK signaling pathway. Am. J. Transl. Res. 8, 3522–3529 [PMC free article] [PubMed] [Google Scholar]
- 13.Yang M., Gu Y. Y., Peng H., Zhao M., Wang J., Huang S. K., Yuan X. H., Li J., Sang J. L., Luo Q., Huang C. (2015) NAIF1 inhibits gastric cancer cells migration and invasion via the MAPK pathways. J. Cancer Res. Clin. Oncol. 141, 1037–1047 [DOI] [PMC free article] [PubMed] [Google Scholar]
- 14.Park S. R., Oh D. Y., Kim D. W., Kim T. Y., Heo D. S., Bang Y. J., Kim N. K., Kang W. K., Kim H. T., Im S. A., Suh J. H., Kim H. K., Kim H. K. (2004) A multi-center, late phase II clinical trial of Genexol (paclitaxel) and cisplatin for patients with advanced gastric cancer. Oncol. Rep. 12, 1059–1064 [PubMed] [Google Scholar]
- 15.Song J. J., Lee Y. J. (2008) Differential cleavage of Mst1 by caspase-7/-3 is responsible for TRAIL-induced activation of the MAPK superfamily. Cell. Signal. 20, 892–906 [DOI] [PMC free article] [PubMed] [Google Scholar]
- 16.Xu Z. P., Zhu J. S., Zhang Q., Wang X. Y. (2011) A breakdown of the Hippo pathway in gastric cancer. Hepatogastroenterology 58, 1611–1617 [DOI] [PubMed] [Google Scholar]
- 17.Vidal A. F., Cruz A. M., Magalhães L., Pereira A. L., Anaissi A. K., Alves N. C., Albuquerque P. J., Burbano R. M., Demachki S., Ribeiro-dos-Santos Â. (2016) hsa-miR-29c and hsa-miR-135b differential expression as potential biomarker of gastric carcinogenesis. World J. Gastroenterol. 22, 2060–2070 [DOI] [PMC free article] [PubMed] [Google Scholar]
- 18.Liang B., Wang S., Zhu X. G., Yu Y. X., Cui Z. R., Yu Y. Z. (2005) Increased expression of mitogen-activated protein kinase and its upstream regulating signal in human gastric cancer. World J. Gastroenterol. 11, 623–628 [DOI] [PMC free article] [PubMed] [Google Scholar]
- 19.Holleman A., Chung I., Olsen R. R., Kwak B., Mizokami A., Saijo N., Parissenti A., Duan Z., Voest E. E., Zetter B. R. (2011) miR-135a contributes to paclitaxel resistance in tumor cells both in vitro and in vivo. Oncogene 30, 4386–4398 [DOI] [PMC free article] [PubMed] [Google Scholar]
- 20.Xu X. M., Qian J. C., Deng Z. L., Cai Z., Tang T., Wang P., Zhang K. H., Cai J. P. (2012) Expression of miR-21, miR-31, miR-96 and miR-135b is correlated with the clinical parameters of colorectal cancer. Oncol. Lett. 4, 339–345 [DOI] [PMC free article] [PubMed] [Google Scholar]
- 21.Ura S., Masuyama N., Graves J. D., Gotoh Y. (2001) MST1-JNK promotes apoptosis via caspase-dependent and independent pathways. Genes Cells 6, 519–530 [DOI] [PubMed] [Google Scholar]
- 22.Nishide N., Ono H., Kakushima N., Takizawa K., Tanaka M., Matsubayashi H., Yamaguchi Y. (2012) Clinical outcomes of endoscopic submucosal dissection for early gastric cancer in remnant stomach or gastric tube. Endoscopy 44, 577–583 [DOI] [PubMed] [Google Scholar]
- 23.Zhang C., Chen X., Chen X., Wang X., Ji A., Jiang L., Sang F., Li F. (2016) miR-135a acts as a tumor suppressor in gastric cancer in part by targeting KIFC1. OncoTargets Ther. 9, 3555–3563 [DOI] [PMC free article] [PubMed] [Google Scholar]
- 24.Chen S. H., Li D. L., Yang F., Wu Z., Zhao Y. Y., Jiang Y. (2014) Gemcitabine-induced pancreatic cancer cell death is associated with MST1/cyclophilin D mitochondrial complexation. Biochimie 103, 71–79 [DOI] [PubMed] [Google Scholar]
- 25.Wang L. P., Ma X. Q., Cai J. C. (2012) Clinicopathological significance and function of miR-135b in the occurrence and development of gastric cancer. Zhonghua Yi Xue Za Zhi 92, 3269–3273 [PubMed] [Google Scholar]
- 26.Yu J., Zhai X., Li X., Zhong C., Guo C., Yang F., Yuan Y., Zheng S. (2017) Identification of MST1 as a potential early detection biomarker for colorectal cancer through a proteomic approach. Sci. Rep. 7, 14265 [DOI] [PMC free article] [PubMed] [Google Scholar]
- 27.Kim R. B., Leake B. F., Choo E. F., Dresser G. K., Kubba S. V., Schwarz U. I., Taylor A., Xie H. G., McKinsey J., Zhou S., Lan L. B., Schuetz J. D., Schuetz E. G., Wilkinson G. R. (2001) Identification of functionally variant MDR1 alleles among European Americans and African Americans. Clin. Pharmacol. Ther. 70, 189–199 [DOI] [PubMed] [Google Scholar]
- 28.Wu H., Hait W. N., Yang J. M. (2003) Small interfering RNA-induced suppression of MDR1 (P-glycoprotein) restores sensitivity to multidrug-resistant cancer cells. Cancer Res. 63, 1515–1519 [PubMed] [Google Scholar]
- 29.Guo C., Ding J., Yao L., Sun L., Lin T., Song Y., Sun L., Fan D. (2005) Tumor suppressor gene Runx3 sensitizes gastric cancer cells to chemotherapeutic drugs by downregulating Bcl-2, MDR-1 and MRP-1. Int. J. Cancer 116, 155–160 [DOI] [PubMed] [Google Scholar]
- 30.Zhang K. G., Qin C. Y., Wang H. Q., Wang J. X., Wang Q. M. (2012) The effect of TRAIL on the expression of multidrug resistant genes MDR1, LRP and GST-π in drug-resistant gastric cancer cell SGC7901/VCR. Hepatogastroenterology 59, 2672–2676 [DOI] [PubMed] [Google Scholar]
- 31.Zhou X. M., Wong B. C., Fan X. M., Zhang H. B., Lin M. C., Kung H. F., Fan D. M., Lam S. K. (2001) Non-steroidal anti-inflammatory drugs induce apoptosis in gastric cancer cells through up-regulation of bax and bak. Carcinogenesis 22, 1393–1397 [DOI] [PubMed] [Google Scholar]
- 32.Morinaka A., Funato Y., Uesugi K., Miki H. (2011) Oligomeric peroxiredoxin-I is an essential intermediate for p53 to activate MST1 kinase and apoptosis. Oncogene 30, 4208–4218 [DOI] [PubMed] [Google Scholar]


