Abstract
Excess dietary salt contributes to inflammation and hypertension via poorly understood mechanisms. Antigen-presenting cells including DCs play a key role in regulating intestinal immune homeostasis in part by surveying the gut epithelial surface for pathogens. Previously, we found that highly reactive γ-ketoaldehydes or isolevuglandins (IsoLGs) accumulate in DCs and act as neoantigens, promoting an autoimmune-like state and hypertension. We hypothesized that excess dietary salt alters the gut microbiome leading to hypertension and this is associated with increased immunogenic IsoLG adduct formation in myeloid antigen-presenting cells. To test this hypothesis, we performed fecal microbiome analysis and measured blood pressure of healthy human volunteers with salt intake above or below the American Heart Association recommendations. We also performed 16S rRNA analysis on cecal samples of mice fed normal or high-salt diets. In humans and mice, high-salt intake was associated with changes in the gut microbiome reflecting an increase in Firmicutes, Proteobacteria, and genus Prevotella bacteria. These alterations were associated with higher blood pressure in humans and predisposed mice to vascular inflammation and hypertension in response to a subpressor dose of angiotensin II. Mice fed a high-salt diet exhibited increased intestinal inflammation, including the mesenteric arterial arcade and aorta, with a marked increase in the B7 ligand CD86 and formation of IsoLG protein adducts in CD11c+ myeloid cells. Adoptive transfer of fecal material from conventionally housed high-salt diet–fed mice to germ-free mice predisposed them to increased inflammation and hypertension. These findings provide potentially novel insights into the mechanisms underlying inflammation and hypertension associated with excess dietary salt and may lead to interventions targeting the microbiome to prevent and treat this important disease.
Keywords: Inflammation
Keywords: Hypertension
A high-salt diet alters the gut microbiome in both humans and mice and is associated with increased IsoLG-protein adduct formation in antigen presenting cells in the gut.
Introduction
Hypertension is a major risk factor for cardiovascular disease and a growing health care burden worldwide. According to the recent American Heart Association and American College of Cardiology classification criteria, nearly half of the American population is hypertensive (1). Despite its significance as a risk factor, the pathogenesis of essential hypertension is poorly understood. Extensive evidence demonstrates that excess dietary sodium (Na+) is a major risk factor for hypertension and cardiovascular disease (2, 3). Salt-sensitive hypertension is associated with increased risk of mortality in normotensive and hypertensive subjects, suggesting it is an independent cardiovascular risk factor (4, 5). The American Heart Association recommends Na+ intake at a maximum of 2,300 mg per day, however; more than 90% of the US population does not observe this recommendation (4, 6). Thus, there is a need to identify novel therapeutic targets for treatment and/or prevention of salt-induced hypertension.
Over the past decade, our work and that of others has implicated inflammation in the genesis of hypertension (7–10). T cells infiltrate the kidneys and perivascular space in response to hypertensive stimuli and release inflammatory cytokines that promote renal and vascular dysfunction and further elevate blood pressure (11–13). We also reported that DCs play a major role in initiating adaptive immune responses associated with hypertension following their accumulation of immunogenic isolevuglandins (IsoLGs; ref. 9). IsoLGs are oxidized lipid byproducts that rapidly react with lysines on self-proteins. We found that these modified proteins act as neoantigens and that IsoLG scavenging blocks the ability of DCs to activate T cells and ultimately reduces hypertension (9). We then showed that IsoLGs activate DCs in mice with salt-sensitive hypertension (14–17).
The intestinal mucosa is the first and main absorption site for excess salt. DCs survey the mucosa and regulate intestinal immune homeostasis by (a) inducing tolerance to harmless antigens and (b) initiating protective immunity against intestinal pathogens. Recent studies demonstrated that excess salt may induce proinflammatory and hypertensive effects by acting on the gut microbiome (18, 19). Here, we examined the effect of excess dietary salt in contributing to hypertension by altering the gut microbiome in mice and humans and investigated whether this is associated with immune cell activation and formation of IsoLG protein adducts.
Results
A high-salt diet is associated with dysbiosis and hypertension in humans.
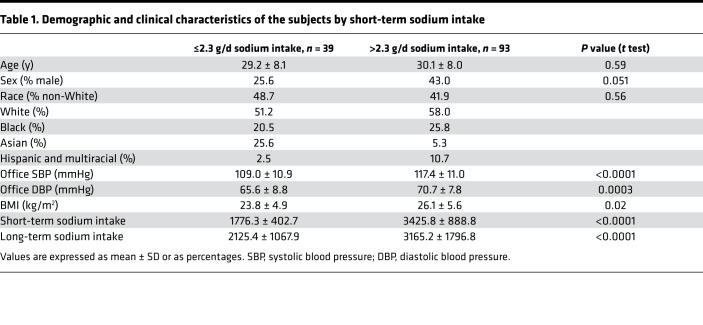
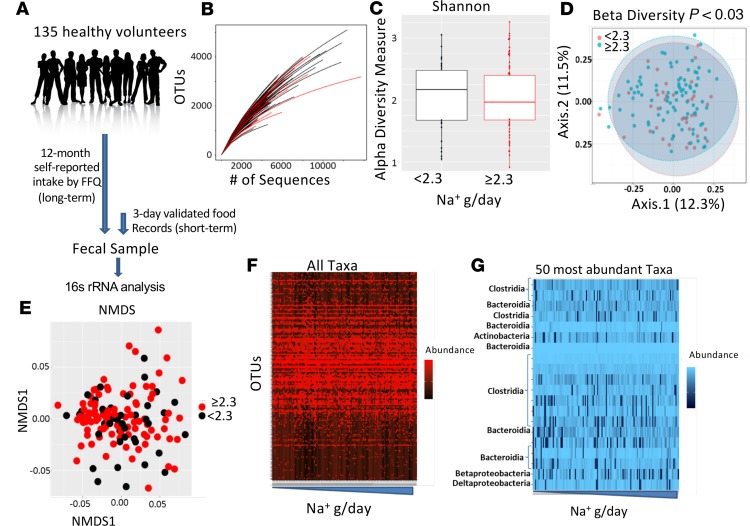
To determine whether excess dietary salt is associated with dysbiosis and concomitant blood pressure elevation in humans, we analyzed the gut microbiome composition in subjects with normal or high-Na+ intake based on American Heart Association recommendations of <2.3 g sodium/d. Subjects were categorized into normal or high-Na+ intake groups based on their responses to surveys of both short-term (3-day) and long-term (1-year) Na+ consumption. Subjects’ general characteristics are shown in Table 1. The study design is shown in Figure 1A, and the rarefaction curve in fecal samples is represented in Figure 1B. As shown in Figure 1C, we found no significant difference in the α diversity measure in people eating a low-salt diet versus high-salt diet. However, there was a significant difference in β diversity between short-term high-salt and low-salt intake (Figure 1D). We found no differential clustering of bacteria from low- versus high-salt diet, as indicated by nonmetric multidimensional scaling (Figure 1E). The relative abundance of selected 16S rRNA gene targets with microbial primers for all taxa (Figure 1F) and for the 50 most abundant taxa (Figure 1G) are shown. Additional global patterns of differences in gut microbiota with short- and long-term salt diets at the phylum, class, order, and family levels are shown in Supplemental Figure 1 (Supplemental material available online with this article; https://doi.org/10.1172/jci.insight.126241DS1).
Table 1. Demographic and clinical characteristics of the subjects by short-term sodium intake.
Figure 1. Relationship between a high-salt diet and the human gut microbiome.
(A) Study design; self-reported dietary Na+ intake was estimated from Food Frequency Questionnaires for 12 months (long-term) and 3-day food records prior to the study visit (short-term). 16S rRNA analysis was performed on fecal samples. (B) Rarefaction curve of OTUs in fecal samples. (C) α Diversity measure in people eating a normal salt diet versus a high-salt diet. (D) β Diversity measure in normal versus high salt. (E) Nonmetric multidimensional scaling (NMDS) of bacteria from people eating a low- versus high-salt diet. (F) Relative abundance of selected 16S rRNA gene targets with microbial primers for all taxa. (G) Relative abundance of selected 16S rRNA gene targets with given microbial primers of the 50 most abundant taxa. 16S rRNA data analyses were performed using R software and a type-I error rate of 0.05 was set to infer statistical significance.
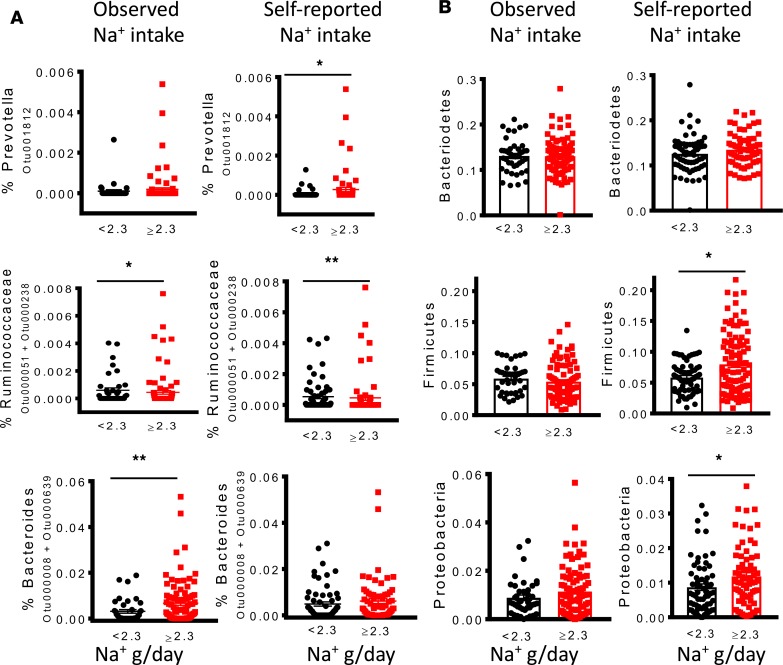
High-Na+ intake (≥2.3 g/d) was associated with increased relative abundance of several bacterial taxa, including operational taxonomic units (OTUs) mapping to the genus Prevotella, family Ruminococcaceae, and genus Bacteroides (Figure 2A). Some associations were statistically significant only in the context of short-term Na+ consumption (e.g., Bacteroides), others were significant in long-term Na+ consumption (e.g., Prevotella), and others differed significantly in both contexts (e.g., Ruminococcaceae). However, trends were similar for both short- and long-term consumption. At the phylum level, high-Na+ intake was associated with a higher proportion of Firmicutes and Proteobacteria but not Bacteroidetes, and these reached statistical significance in the context of long-term Na+ intake (Figure 2B).
Figure 2. A high-salt diet is associated with differences in the human gut microbiome.
Gut microbiome composition in subjects with normal or high-Na+ intake based on American Heart Association recommendations of <2.3 g sodium/d during short-term and long-term intake was analyzed. (A) Relationship between sodium intake and relative abundance of bacterial taxa, including OTUs mapping to the genus Prevotella, family Ruminococcaceae, and genus Bacteroides. (B) Effect of sodium intake on the proportion of Phyla Bacteroidetes, Firmicutes, and Proteobacteria (*P < 0.05, **P < 0.001 using 2-tailed unpaired Student’s t tests).
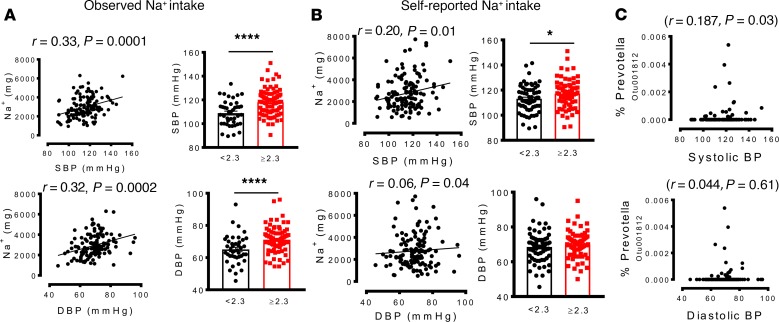
We found that higher Na+ intake was significantly associated with increased systolic and diastolic blood pressure. Participants who consumed greater than the recommended 2.3 g/d of Na+ based on short-term analysis had significantly higher systolic and diastolic blood pressures (Figure 3A), while increased long-term Na+ intake was significantly correlated with higher systolic but not diastolic pressure (Figure 3B). We also observed a significant positive correlation between elevated systolic blood pressure and the presence of a specific OTU mapping to Prevotella (Figure 3C). Linear regression to analyze the relationship between blood pressure and the bacteria controlling for age, sex, BMI, race, and sodium intake showed that the Firmicutes remained markedly associated with increased salt intake. Ruminococcaceae also remained associated with for short-term but not long-term elevated salt intake. The Firmicutes/Bacteroidetes ratio was also robustly correlated with short-term and long-term salt intake but did not reach statistical significance. While Prevotella was associated with elevated salt intake in the univariate analysis, this association was lost in the multivariate analysis. These results suggest overall that a high-salt diet may alter the human gut microbiome in a manner that favors colonization by Prevotella and other bacteria, an outcome associated with elevated blood pressure.
Figure 3. A high-salt diet is associated with increased colonization of the human gut by genus Prevotella, and this correlates with hypertension.
(A and B) Relationship between sodium intake and systolic and diastolic blood pressures during short-term and long-term intake. (C) Correlation between blood pressure and OTU mapping to Prevotella. (*P < 0.05, ****P < 0.00001 using 2-tailed unpaired Student’s t tests). Linear regression was used to analyze the relationship between blood pressure and Prevotella bacteria, and a type-I error rate of 0.05 was set to infer statistical significance.
Hypertension is associated with increased gut pathology, inflammation, and IsoLG formation in humans.
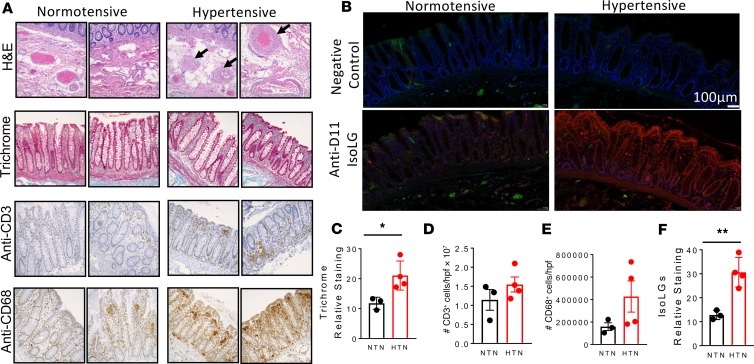
In additional experiments, we performed histological staining with H&E and Masson’s trichrome for fibrosis, as well as immunohistochemical analysis for infiltration of T cells and macrophages of colon sections of normotensive and hypertensive humans obtained from the Vanderbilt Cooperative Human Tissue Network (Figure 4A). We found that compared with normotensive individuals, hypertension was associated with increased arteriolar wall thickening and increased fibrosis (Figure 4, A and C). There was also a trend for increased infiltration of immune cells, including T cells and macrophages in the intestinal wall of hypertensive when compared with normotensive individuals (Figure 4, A, D, and E). In additional experiments, we found increased accumulation of IsoLGs in the colon sections from hypertensive when compared with normotensive humans (Figure 4, B and F). These results suggest that hypertension is associated with increased gut pathology, inflammation, and accumulation of IsoLGs.
Figure 4. Effect of hypertension on gut pathology, inflammation, and isolevuglandin formation in humans.
(A) Representative histological staining images with H&E and Masson’s trichrome for fibrosis as well as immunohistochemical analysis for infiltration of T cells and macrophages of colon sections of normotensive and hypertensive humans obtained from the Vanderbilt Cooperative Human Tissue Network. (B) Immunofluorescent representatives for isolevuglandin (IsoLG) staining. (C) Average data showing trichrome staining in normotensive and hypertensive individuals. (D) Average data for T cells. (E) Average data showing macrophages in hypertensive compared with normotensives. (F) Average data showing IsoLG accumulation in colon sections from hypertensive when compared with normotensive humans (*P < 0.05, **P < 0.001 using 2-tailed unpaired Student’s t tests).
A high-salt diet alters the mouse gut microbiome.
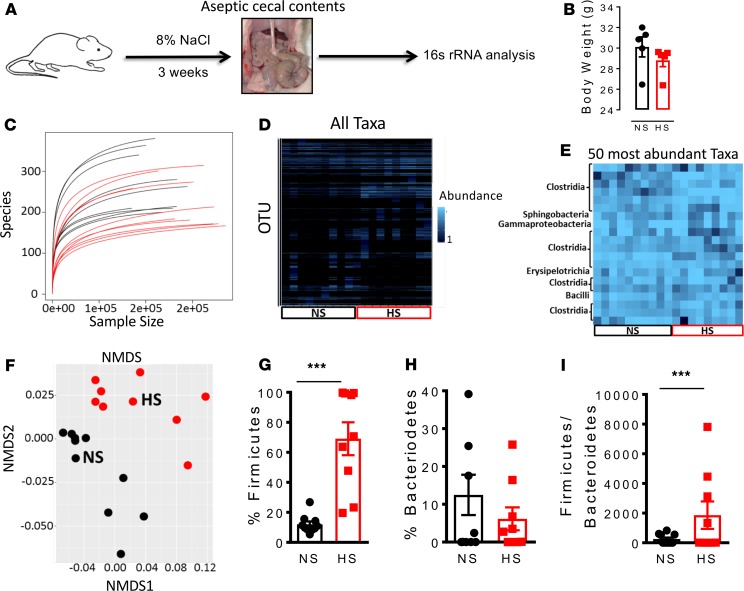
To further confirm whether a high-salt diet alters the gut microbiome, we fed mice either an 8% NaCl diet + 1% NaCl water or a normal salt diet for 3 weeks and then aseptically collected cecal contents to conduct 16S rRNA-based identification of bacterial species (Figure 5A). We did not find any significant differences in body weight between mice fed a normal salt diet and those fed a high-salt diet (Figure 5B). Mice fed a high-salt diet exhibited a markedly altered gut microbiome compared with those fed a normal salt diet and showed a relative decrease in species biodiversity (Figure 5C). The relative abundance of 16S rRNA gene targets based on analysis with microbial primers of either all taxa or the 50 most abundant is shown is shown in Figure 5, D and E, respectively. Nonmetric multidimensional scaling revealed that bacteria from normal and high-salt–fed diet animals form distinct clusters (Figure 5F). In addition, we observed that a high-salt diet led to colonization of the gut by bacteria of phylum Firmicutes (Figure 5G) rather than phylum Bacteroidetes (Figure 5H). Accordingly, we observed a significant increase in the Firmicutes/Bacteroidetes ratio following feeding with a high-salt diet (Figure 5I).
Figure 5. A high-salt diet alters the gut microbiome in mice.
(A) Experimental design; cecal samples from C57BL/6 mice fed a high-salt diet for 3 weeks and regular diet (normal salt) were subjected to 16S rRNA analysis. (B) Body weight of normal salt diet– and high-salt diet–fed mice. (C) Species biodiversity estimation in cecal samples of normal salt diet– and high-salt diet–fed mice. (D) Relative abundance of selected 16S rRNA gene targets with microbial primers for all taxa. (E) Relative abundance of selected 16S rRNA gene targets with given microbial primers of the 50 most abundant taxa. (F) Nonmetric multidimensional scaling (NMDS) showing that the bacteria from normal salt (NS) and high-salt (HS) diet–fed mice cluster separately. Effect of a high-salt diet on the phyla Firmicutes (G) and Bacteroidetes (H). (I) Effect of a high-salt diet on the Firmicutes/Bacteroidetes ratio (***P < 0.0001, n = 10 normal salt and n = 9 high salt using 2-tailed unpaired Student’s t tests).
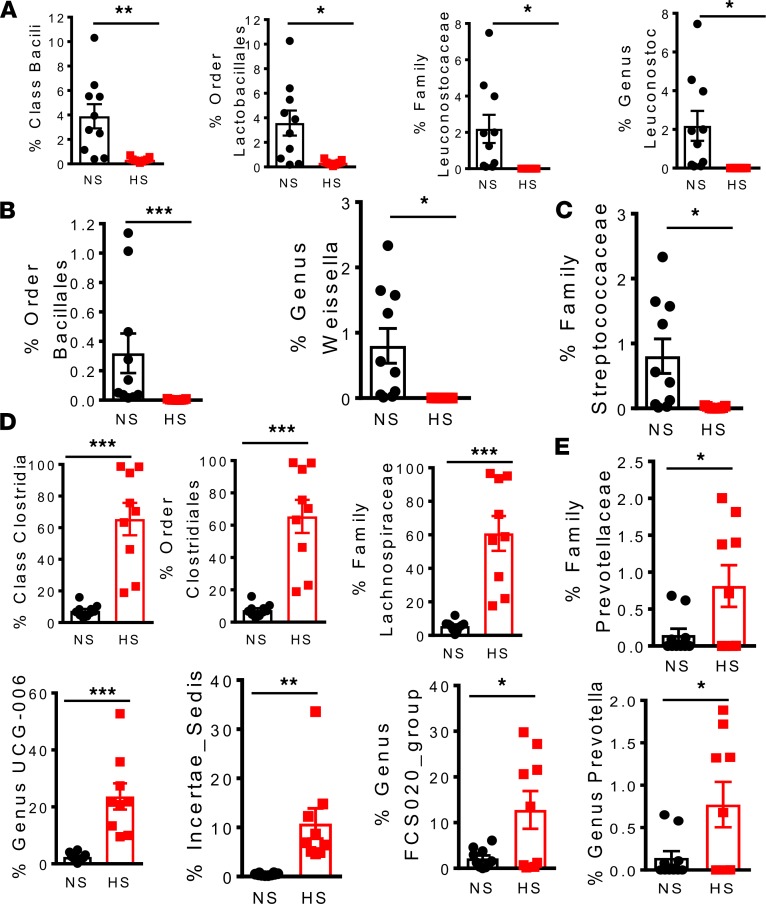
Recent studies have found that lactic acid–producing bacteria protect against salt-induced activation of T cells and hypertension (19). We found that potential lactic acid–producing bacteria, including the class Bacilli, order Lactobacillales, family Leuconostocaceae, and genus Leuconostoc, were depleted by high-salt feeding (Figure 6A). We also found that the relative number of bacteria of the order Bacillales, the genus Weissella (Figure 6B), and the family Streptococcaceae (Figure 6C) decreased after feeding a high-salt diet.
Figure 6. A high-salt diet depletes lactic acid–producing bacteria and leads to colonization of the gut by families Lachnospiraceae and Prevotellaceae in mice.
(A) Effect of high salt on bacterial number of the Firmicutes phylum belonging to class Bacili, order Lactobacillales, family Leuconostocaceae, and genus Leuconostoc. (B) Effect of high salt on bacterial number of the class Bacilli belonging to the order Bacillales and genus Weissella. (C) Effect of high salt on bacterial numbers of the order Lactobacillales belonging to family Streptococcaceae. (D) Effect of high salt on bacterial number of the Firmicutes phylum belonging to class Clostridia, order Clostridiales, family Lachnospiraceae, and genus Lachnospiraceae UCG-006, Incertae Sedis, and the Lachnospiraceae FCS020 group and (E) family Prevotellaceae and genus Prevotella (*P < 0.05, **P < 0.001, ***P < 0.0001, n = 10 normal salt and n = 9 high salt using 2-tailed unpaired Student’s t tests).
Bacteria of the families Lachnospiraceae and Prevotellaceae have been linked to metabolic syndrome and chronic inflammation, including periodontal disease and rheumatoid arthritis (20–22). Mice fed a high-salt diet showed marked increases in Firmicutes bacteria belonging to class Clostridia, order Clostridiales, family Lachnospiraceae and the genera Lachnospiraceae UCG-006, Incertae Sedis, and the Lachnospiraceae FCS020 group (Figure 6D). A high-salt diet led to colonization of the gut by the family Prevotellaceae and genus Prevotella (Figure 6E). These results overall suggest that high-salt intake leads to dysbiosis marked by depletion of lactic acid–producing bacteria and colonization by bacteria previously implicated in inflammation and metabolic syndrome.
A high-salt diet increases inflammation and formation of IsoLG protein adducts in the mouse gut.
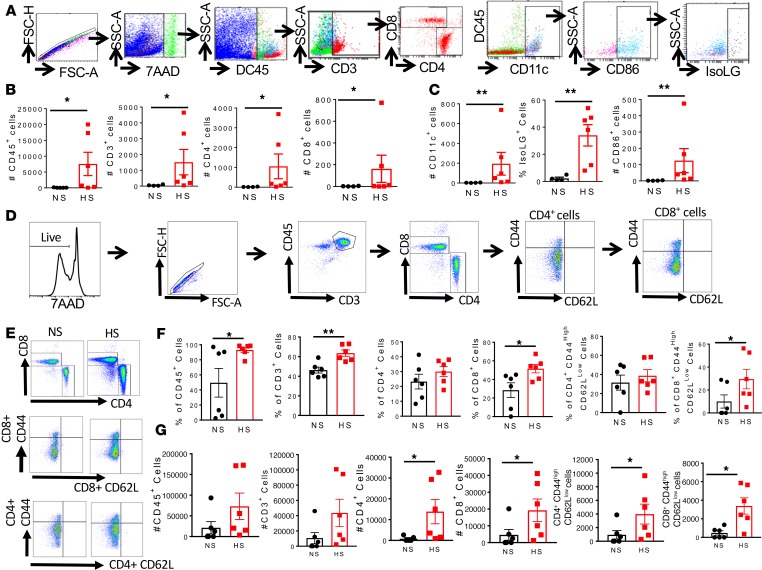
Over the last decade, our work and that of others has implicated cells of the adaptive immune system in development of salt-sensitive hypertension (7, 8). Accordingly, we also reported that DCs function in initiating adaptive immune responses associated with hypertension via accumulation of immunogenic IsoLGs (9). We performed flow cytometry on the mesenteric arterial arcade, including the perivascular fat, of mice fed a normal or high-salt diet using a gating strategy (Figure 7A) to identify inflammatory cells, including total leukocytes (CD45+ cells), total T cells (CD45+/CD3+ cells), and the T cell subtypes (CD3+/CD8+ and CD4+). We also performed surface staining for B7 ligand CD86 as well as intracellular staining for IsoLG adducts using the single-chain antibody D11 ScFv, in CD11c+ cells. We found that compared with a normal diet, high salt consumption resulted in infiltration of the mesenteric arterial arcade by CD45+, CD3+, CD4+, and CD8+ cells (Figure 7B). High-salt feeding also increased infiltration of the mesentery by CD11c+ cells, with a concomitant increase in surface expression of CD86 and accumulation of IsoLG protein adducts (Figure 7C). In additional experiments, we performed flow cytometry on the mesenteric lymph nodes using a gating strategy to identify memory T cell subtypes (Figure 7D). Representative flow cytometry images are shown in Figure 7E. We found increased percentages (Figure 7F) and absolute numbers (Figure 7G) of CD45+ cells, CD3+ T cells, CD8+ T cells, and CD8+ effector memory T cells in the mesenteric lymph nodes of mice fed a high-salt diet when compared with those fed a normal salt diet.
Figure 7. A high-salt diet increases formation of isolevuglandin adducts and inflammation in the mesentery and mesenteric lymph nodes of mice.
(A) Flow cytometry gating strategy to identify inflammatory cell subtypes. (B) Effect of a high-salt diet on mesenteric total CD45+ cells, CD3+ T cells, CD4+ T cells, and CD8+ T cells. (C) Effect of high salt on CD11c+ cells, surface expression of B7 ligand CD86 and intracellular isolevuglandin formation in CD11c+ cells. (D) Flow cytometry gating strategy to identify effector memory T cell subtypes. (E) Representative flow cytometry dot plots for T cell and effector memory T cell subtypes. (F and G) Effect of high-salt feeding on total CD45+ cells, CD3+ T cells, CD4+ T cell, and CD8+ T cells and effector memory CD4+ and CD8+ T cells in the mesenteric lymph nodes (percentages and numbers are shown; *P < 0.05, **P < 0.001 using 2-tailed unpaired Student’s t tests or Mann-Whitney according to the distribution).
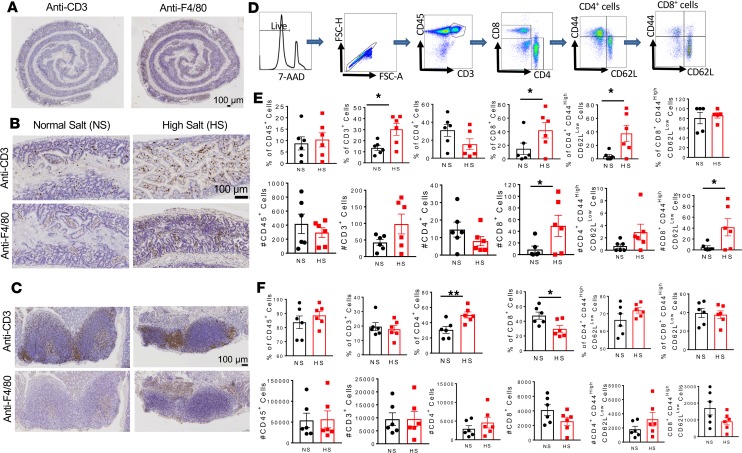
To determine the spatial in situ distribution of immune cells in the salt-fed mouse gut, we performed immunohistochemistry staining for T cells and monocyte/macrophages of the entire intestinal tract. Most immune cells, especially the monocyte/macrophage F4/80+ cells, were localized in the large intestines (Figure 8A). As shown in Figure 8, B and C, we found that high-salt feeding increased infiltration of the mouse colon and the Peyer’s patches with CD3+ cells and F4/80+ cells. Quantitative analysis by flow cytometry using a gating strategy to identify memory T cell subtypes (Figure 8D) confirmed a marked increase in CD45+/CD3+ cells and CD3+/CD8+ but not CD4+ T cells. There was also increased infiltration of the colon with effector memory CD4+ and CD8+ T cells (Figure 8E). In additional experiments, we performed flow cytometry quantification on the Peyer’s patches and did not find any significant differences in immune infiltration, except in CD4+ T cells and a reduction in T CD8+ cells (Figure 8F). These results suggest that a high-salt diet increases the presence of inflammatory cells in the gut potentially due to increased formation of IsoLG protein adducts in antigen-presenting cells (APCs).
Figure 8. A high-salt diet increases inflammation in the colon and Peyer’s patches of mice.
(A) Immunohistochemistry images showing distribution of T cells and monocyte/macrophages in the entire gut of a high-salt diet–fed mouse. Scale bar: 100 μm. (B) Representative immunohistochemistry images showing increased infiltration of T cells and monocyte/macrophages in the colon of high-salt diet–fed mice compared with normal salt diet–fed mice. Scale bar: 100 μm. (C) Representative images showing increased infiltration of T cells and monocyte/macrophages in the Peyer’s patches of high-salt diet–fed mice compared with normal salt diet–fed mice. Scale bar: 100 μm. (D) Flow cytometry gating strategy to identify effector memory T cell subtypes. (E) Effect of high-salt feeding on total CD45+ cells, CD3+ T cells, CD4+ T cells, CD8+ T cells, and effector memory CD4+ and CD8+ T cells in the colon. (F) Effect of high-salt feeding on total CD45+ cells, CD3+ T cells, CD4+ T cells, CD8+ T cells, and effector memory CD4+ and CD8+ T cells in the Peyer’s patches (percentages and numbers are shown; *P < 0.05, **P < 0.001 using 2-tailed unpaired Student’s t tests).
A high-salt diet sensitizes mice to a subpressor dose of angiotensin II, leading to hypertension.
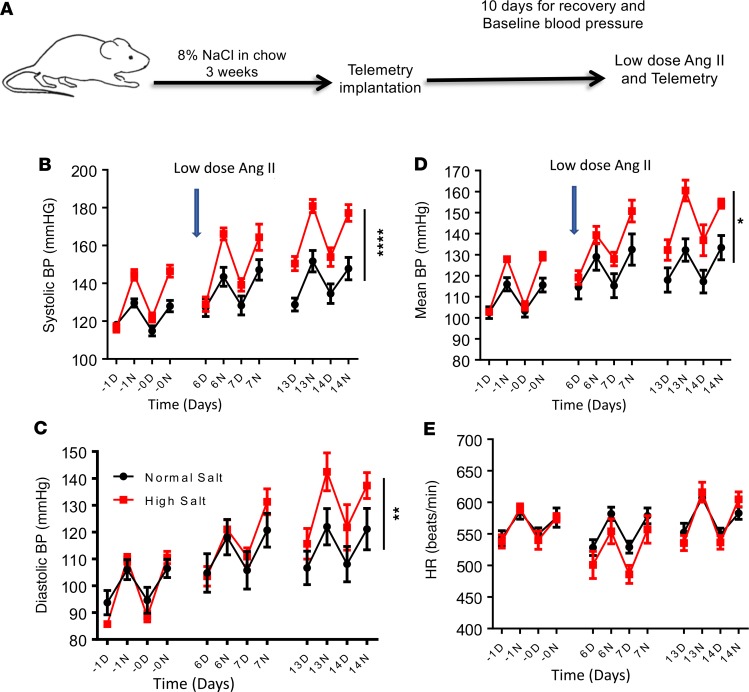
To determine the mechanism by which high-salt intake predisposes to hypertension, we fed mice a normal or high-salt diet for 3 weeks and then implanted them with radiotelemeters to measure blood pressure and heart rate. Two weeks later, we implanted osmotic minipumps subcutaneously to deliver a continuous low dose of angiotensin II (140 mg/kg/h) for 2 weeks (Figure 9A). Mice consuming a normal salt diet and administered low-dose angiotensin II showed no increase in blood pressure. However, low-dose angiotensin II treatment caused a significant increase in systolic (Figure 9B), diastolic (Figure 9C), and mean arterial pressure (Figure 9D) in mice fed a high-salt diet, without altering heart rate (Figure 9E). These results suggest that a high-salt diet primes mice to hypertension.
Figure 9. A high-salt diet predisposes to hypertension.
Mice were fed a normal salt diet (black) or a high-salt diet, 8% NaCl (red), for 3 weeks. Osmotic minipumps were implanted at 3 weeks to deliver a subcutaneous low dose of angiotensin II (140 mg/kg/h) for 2 weeks. (A) Experimental strategy. Systolic (B), diastolic (C), mean arterial blood pressure (D), and heart rate (E) were monitored using radiotelemetry (n = 5 normal salt and 6 high salt; *P < 0.05, **P < 0.001, ****P < 0.0001 high salt versus normal salt control, using 2-way repeated-measures ANOVA). D, day; N, night.
A high-salt diet predisposes mice to aortic inflammation in response to a subpressor dose of angiotensin II.
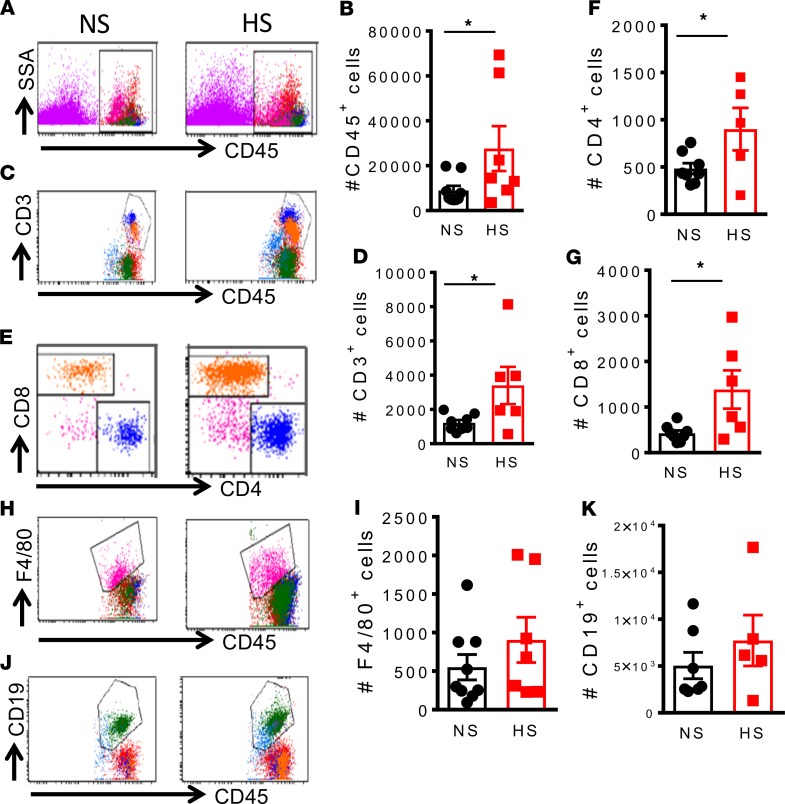
To determine whether feeding mice a high-salt diet predisposes them to increased aortic inflammation in response to low-dose angiotensin II, we made single-cell suspensions from freshly isolated aorta tissue of mice fed a normal or high-salt diet and given low-dose angiotensin II. Mice fed a high-salt diet exhibited a marked increase in aortic infiltration of both the number and percentage of CD45+ total leukocytes (Figure 10, A and B), number of CD3+ T lymphocytes (Figure 10, C and D), and CD4+ and CD8+T cell subsets (Figure 10, E–G) in response to a subpressor dose of angiotensin II. We observed no significant difference in numbers of F4/80+ monocytes/macrophages (Figure 10, H and I) and CD19+ B lymphocytes (Figure 10, J and K) between normal salt–fed and high-salt diet–fed mice in response to low-dose angiotensin II nor did we detect any significant differences in inflammatory cells infiltrating the kidney (Supplemental Figure 2). These results suggest that a high-salt diet predisposes mice to aortic but not renal inflammation in response to a subpressor dose of angiotensin II.
Figure 10. A high-salt diet predisposes mice to aortic inflammation in response to low-dose angiotensin II.
Mice were fed a normal salt diet or a high-salt diet, 8% NaCl, for 3 weeks. Osmotic minipumps were implanted at 3 weeks to deliver a subcutaneous low dose of angiotensin II (140 mg/kg/h) for 2 weeks. The mice were sacrificed, and single-cell suspensions were prepared from freshly isolated mouse aortas via enzymatic digestion and mechanical dissociation. Live-cell singlets were analyzed for vascular inflammatory cells including number and percentages CD45+ total leukocytes (A and B), CD3+ T lymphocytes (C and D), CD4+/CD8+T cell subsets (E, F, and G), F4/80+ monocytes and macrophages (H and I), and CD19+ B lymphocytes (J and K). An unpaired t test was used to compare infiltrating leukocyte subsets between normal salt (NS) and high salt (HS) (*P < 0.05 using 2-tailed unpaired Student’s t tests).
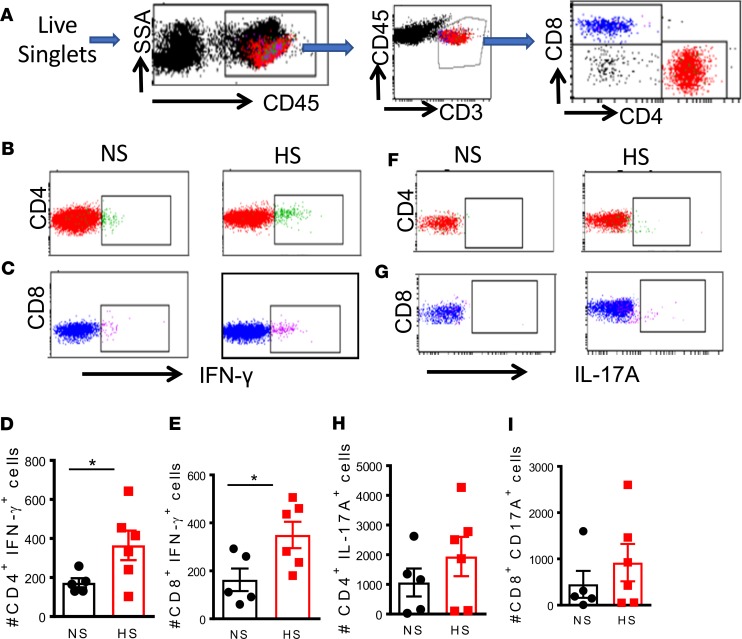
T cells from high-salt diet–fed mice treated with low-dose angiotensin generate high levels of IFN-γ. We recently reported that exposure of DCs to elevated concentrations of salt drives cytokine production by T cells (23). Thus, we hypothesized that T cells from mice fed a high-salt diet would exhibit altered cytokine production in response to low-dose angiotensin II infusion. To address this, we isolated splenic CD4+ and CD8+ T cells from normal and high-salt diet–fed mice infused with 140 ng/kg/min of angiotensin II for 2 weeks and then performed flow cytometry with intracellular staining for IFN-γ and IL-17A. The gating strategy to identify T cell populations among total splenocytes is shown in Figure 11A. We found that among both CD4+ and CD8+ T cells, high-salt feeding followed by low-dose angiotensin II was associated with increased IFN-γ production (Figure 11, B–E). However, we observed no significant difference in T cell IL-17A production between normal salt and high-salt diet–fed mice treated with low-dose angiotensin II (Figure 11, F–I).
Figure 11. Cytokine production of T cells in the spleen of mice fed normal or high-salt diet.
Mice were fed a normal salt diet or a high-salt diet, 8% NaCl, for 3 weeks. Osmotic minipumps were implanted at 3 weeks to deliver a subcutaneous low dose of angiotensin II (140 mg/kg/h) for 2 weeks. The mice were sacrificed, and single-cell suspensions were prepared from freshly isolated mouse spleens via enzymatic digestion and mechanical dissociation. (A) Gating strategy for identifying T cell populations among total splenocytes. Intracellular staining for IFN-γ (B–E) and IL-17A (F–I) production in T cell subsets (*P < 0.05 using 2-tailed unpaired Student’s t tests). NS, normal salt; HS, high salt.
Fecal microbial transfer from mice fed a high-salt diet predisposes recipient germ-free mice to inflammation and hypertension.
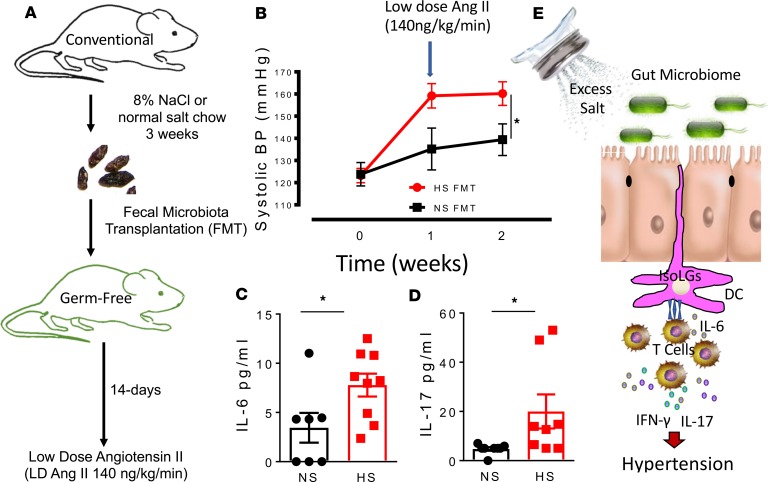
We performed fecal microbiota transplantation (FMT) from mice fed a high-salt diet into recipient germ-free mice using an experimental design shown in Figure 12A. We found that FMT from high-salt diet–fed mice to recipient germ-free mice resulted in significantly higher systolic blood pressure in response to a low subpressor dose of angiotensin II when compared with mice with FMT from normal salt-fed mice (Figure 12B). In additional studies, we found higher plasma levels of IL-6 and IL-17 in recipient germ-free mice with FMT from high-salt diet–fed mice when compared with those with FMT from normal salt–fed mice (Figure 12, C and D). Our findings here clearly show that the gut microbiome plays a role in priming mice to hypertension in response to a low dose of angiotensin II, which normally does not increase hypertension as previously reported (9, 23, 24).
Figure 12. Fecal microbial transfer from mice fed a high-salt diet predisposes recipient germ-free mice to inflammation and hypertension.
(A) Experimental design for fecal material transfer (FMT) from conventionally fed mice fed a high-salt diet into recipient germ-free mice. (B) Tail cuff systolic blood pressure of normal salt (NS) and high salt (HS) FMT recipient germ-free mice in response to a low subpressor dose of angiotensin II. (C and D) Plasma levels of IL-6 and IL-17 in recipient germ-free mice with FMT from high-salt diet–fed mice when compared with those with FMT from normal salt–fed mice (*P < 0.05 using 2-way repeated-measures ANOVA). (E) Paradigm illustrating how excess dietary salt alters the gut microbiome and activates DCs, leading to hypertension. A high-salt diet compromises the microbiome and induces production of IsoLG protein adduct formation in CD11c+ cells. The DCs become activated and promote T cell production of IL-17 and IFN-γ, leading to hypertension.
Discussion
In the current studies, we identified what we believe to be a novel mechanism by which excess Na+ contributes to inflammation and hypertension. Our results indicate that a high-salt diet alters the gut microbiome in both humans and mice and is associated with increased IsoLG protein adduct formation in APCs, which leads to inflammation and hypertension (Figure 12E). We found that mice fed a high-salt diet have elevated blood pressure in response to an infusion of angiotensin II at a dose that is generally subpressor. These mice also exhibited increased aortic and mesenteric arterial inflammation.
Clinical and experimental studies have established a link among excessive salt intake, inflammation, and hypertension (25, 26), but the underlying mechanisms remain unclear. Resident DCs in the gut mucosa survey for pathogens and play a key role in regulating intestinal immune homeostasis. Previously, we showed that IsoLGs, which are oxidative products of fatty acids, accumulate in DCs and act as neoantigens, promoting an autoimmune-like state and hypertension (9). Here, we found that excess dietary salt alters the gut microbiome and leads to hypertension by increasing immunogenic IsoLG protein adduct formation in CD11c+ APCs, leading to T cell activation and production of the prohypertensive cytokine IFN-γ.
An important finding in the current studies is that salt-induced gut dysbiosis is associated with hypertension and vascular inflammation following a subpressor dose of angiotensin II in mice. The intestinal mucosa is rich in Na+ transporters and is the main absorptive site for dietary Na+. In our recent study, we demonstrated that DCs sense increased extracellular Na+ through amiloride-sensitive transporters, leading to calcium influx via the Na+/Ca2+ exchanger (23). Increased intracellular calcium activates protein kinase C, which phosphorylates and activates the NADPH oxidase subunit p47phox, leading to superoxide production and formation of immunogenic IsoLG protein adducts. DCs activated by excess Na+ secrete IL-1β and stimulate T cells to produce cytokines IL-17A and IFN-γ. When adoptively transferred into naive mice, these activated DCs prime hypertension in response to a subpressor dose of angiotensin II (23). Thus, it is conceivable that excess dietary Na+ is directly absorbed through the gastrointestinal wall to directly activate DCs via IsoLG protein adduct formation. These activated DCs then drive T cells to produce cytokines that can alter the gut microbiome and lead to inflammation and hypertension in a feed-forward fashion.
Recent evidence shows that gut microbiota play a role in the development of cardiovascular disease, including hypertension (27, 28). Germ-free mice are resistant to hypertension and vascular dysfunction and have less renal and vessel infiltration of immune cells after angiotensin II infusion (29). Importantly, transplant of the microbiome from hypertensive subjects increases blood pressure in germ-free recipient mice, suggesting a causal role of the microbiome in development of hypertension (30). A recent study found that the gut microbiome of both hypertensive rats and humans is marked by an increase in the Firmicutes/Bacteroidetes ratio (31). Here, we found that a high-salt diet increased gut colonization by bacteria of the phylum Firmicutes, with a resultant increase in the Firmicutes/Bacteroidetes ratio. This ratio reportedly increases in conditions of obesity and metabolic syndrome in both experimental animals and in human subjects (32, 33).
Among members of the Firmicutes phylum, we found that the bacteria enriched by high salt primarily belonged to family Lachnospiraceae, which belongs to the order Clostridiales and class Clostridia. This family has been linked to obesity and diabetes (20). We also found that a high-salt diet led to colonization of the gut by Prevotella spp. in both mice and humans. Prevotella spp. have been associated with chronic inflammation, including periodontal disease (21) and rheumatoid arthritis (22), which are important risk factors for hypertension and cardiovascular disease. Increases in Prevotella and decreases in Lactobacillus have been associated with the genesis of autoinflammatory disease (34). Indeed, recent studies found that increased salt intake downregulated metabolite β-hydroxybutyrate (β-OHB). This was attributed to increased activation of the renal Nlrp3 inflammasome and increased production of IL-1β leading to elevation in blood pressure, renal injury, and fibrosis. Consistent with our findings here and previously, elevated salt intake was associated with reduced Lactobacilli species and enrichment in Prevotella bacteria (6).
Convincing evidence gathered for over 50 years links inflammation with hypertension (9, 10). T cells infiltrate the kidneys and perivascular space in response to hypertensive stimuli and release inflammatory cytokines that promote renal and vascular dysfunction, leading to elevated blood pressure (11–13). One important finding in our studies is that excess dietary salt depletes the gut of lactic acid–producing bacteria belonging to the order Lactobacillales, which exhibit immunomodulatory characteristics (35–42). A recent study by Mizoguchi et al. showed that oral administration of lactic acid–producing bacteria attenuates atherosclerosis by inducing tolerogenic DCs (43). Moreover, treatment of mice with Lactobacillus murinus prevented salt-sensitive hypertension (19). Our results confirm these findings and further provide a potential mechanism by which T cells are activated in response to an altered gut microbiome.
Alterations in gut microbiota composition may impair gut barrier function, allowing infiltration of microbial products into mesenteric fat and triggering an immune response and subsequent proinflammatory cytokine production. We found that a high-salt diet increased DC infiltration into the mesenteric arterial arcade. These DCs showed increased expression of B7 ligand and maturation/activation marker CD86, which was previously implicated in the genesis of hypertension (44). Evidence reported here that high dietary salt induces formation of IsoLG protein adducts in DCs infiltrating the mesentery supports our prior work in which we found that IsoLG-adducted proteins accumulate in DCs, which become immunogenic and promote inflammation and hypertension (9, 23). One limitation of our study is that, while germ-free mice provide a powerful tool for studying the causative impact of the gut microbiome to disease, their immune responses to pathological insults are considered naive to the “education” provided by the microorganisms present in the conventionally housed mice (1). We therefore took precaution to limit exposure of the germ-free mice to extreme stress and potential exposure to any pathogenic microorganisms by measuring blood pressure using the tail-cuff method instead of the state-of-the-art telemetry. A recent study found that while the tail-cuff method systematically underestimates central blood pressure as recorded by telemetry simultaneously in the same mouse, tail-cuff recordings are similar to those obtained by telemetry in undisturbed mice (2). Second, stress due to changes in housing could potentially influence blood pressure in addition to the microbiota. Despite these limitations, we found that germ-free mice that received FMT from high-salt diet–fed mice developed a significantly higher blood pressure in response to a low suppressor dose of angiotensin II when compared with mice that received FMT from normal salt-fed mice. In addition, germ-free mice that received FMT from high-salt diet–fed mice had higher levels of IL-17 and IL-6. In previous studies, we found that DCs that accumulate IsoLGs produce elevated levels of IL-6 and induce production of IL-17 by T cells, promoting an autoimmune-like state and hypertension (9). Our results reveal a potentially novel pathway by which excess dietary salt promotes inflammation and hypertension by altering the gut microbiome. These findings may guide development of therapeutic approaches tailored to reduce hypertension and attendant end-organ damage.
Methods
Human study population.
We recruited 135 healthy volunteers (nonpregnant/nonlactating women and men, aged 18–50) for a single study visit at the University of Pennsylvania from 2012 to 2014, as part of the ABO Glycoproteomics in Platelets and Endothelial Cells (ABO) Study. Stool samples were collected as part of a microbiome-focused substudy. Exclusion criteria included history of organ transplant, tobacco, and prescription medication use (except oral contraceptives). Participants were instructed to avoid over-the-counter medications, dietary supplements, and vitamins for 2 weeks prior to the sample collection.
Human dietary sodium estimation.
Dietary Na+ intake was estimated from self-reported dietary intake. Subjects completed validated 3-day food records prior to the study visit, including on the day directly before the visit and a weekend day (high-quality records were available for n = 132; ref. 45). Nutrient composition from food records was analyzed using Food Processor 8.1 (ESHA Research). For our study, we consider these data to represent short-term dietary intake. All subjects also completed a Food Frequency Questionnaire (FFQ) to assess habitual dietary intake. This questionnaire prompted subjects to report frequency of consumption and serving size of 134 food items over the previous year (the National Cancer Institute’s Diet History Questionnaire [DHQ I]; ref. 46). Completed subject responses were analyzed using Diet*Calc version 1.5.1. For our study, we consider these FFQ data to reflect long-term dietary intake. Self-reported dietary intake was typical of the Philadelphia region, with the majority of subjects eating omnivorous diets with macronutrient consumptions consistent with the Standard American Diet (51% energy from carbohydrates, 34% energy from fat, 15% energy from protein). The American Heart Association recently issued dietary recommendations to maintain sodium intake <2.3 g/d. We thus grouped individuals into normal (<2.3 g sodium/d) or high (≥2.3 g sodium/d) sodium intake based on the sodium estimates from short-term and long-term dietary reports.
Human sample processing, DNA extraction, and sequencing.
Subjects collected a stool sample within 24 hours prior to the study visit using a provided kit (Commode Specimen Collection System, Fisher Scientific). Samples were stored at 4°C and aliquots (~400 mg each) made within 36 hours of collection. Samples were stored at –80°C prior to nucleic acid extraction. DNA was isolated using the PSP Spin Stool DNA Plus Kit (Stratec). DNA was quantified to ensure equal DNA input across samples for amplification and sequencing. The 16S rRNA gene region was amplified using barcoded primers (Eurofins Genomics; primer sequences were from Caporaso, et al.; ref. 47), and DNA libraries were purified using a MinElute PCR Purification kit (Qiagen) prior to quantification and pooling. Pooled DNA libraries were sequenced using the MiSeq platform, 300-bp paired-end reads, at an average depth of 158,000 reads/sample (Illumina Inc.). Samples were extracted and sequenced in 2 batches, one at the University of Pennsylvania Next-Generation Sequencing Center (UPenn NGSC) and the other at the Vanderbilt Technologies for Advanced Genomics (VANTAGE) core. There were minor differences in microbiome profiles by batch (P = 0.04), but no differences in dietary sodium intake or other variables. Analysis by batch confirmed that the conclusions were not altered by batch effects, and thus all subjects were included in the analysis.
Animals.
Three-month-old C57Bl/6 male mice purchased from The Jackson Laboratory were fed a high-salt (8% NaCl) diet + 1% NaCl water or regular chow and water ad libitum for 3 weeks, as described previously (48). Osmotic minipumps (Alzet, model 2002) were then implanted in mice anesthetized with xylazine/ketamine for infusion of low-dose angiotensin II (140 ng/kg/min) over a 2-week period as previously described (9). Blood pressure was monitored by radiotelemetry. After telemetry implantation, mice were allowed to recover for 10 days before implantation of osmotic minipumps. Mice were housed in individual cages and were randomized to either high-salt or normal salt feeding for the duration of the entire experiment. The high-salt and normal salt diets were obtained from the same company (Research Diets Inc.) and were custom-made in such a way that only the concentration of NaCl was different between the diets. All the experiments and data analyses were performed in a blinded fashion.
Gut microbiota characterization.
Mouse cecal samples were aseptically collected at sacrifice and stored at –80°C until processing. Microbial DNA was extracted using the QIAamp DNA Stool Mini Kit (Qiagen, catalog 51504) according to the manufacturer’s instructions. 16S rRNA gene amplicons were generated using a method reported by the Schloss laboratory (49). That protocol uses PCR with dual-indexed primers targeting the V4 region of the 16S rRNA gene and including Illumina sequencing adapters, allowing for sequencing directly after PCR cleanup. Sequencing was performed on the Illumina MiSeq using V2 2X250 BP chemistry at the VANTAGE core facility.
Isolation of immune cells from the mouse gut tissue.
Single-cell suspensions of Peyer’s patches, colon, and mesenteric lymph nodes were prepared, with some modifications as described previously (50). Briefly, mice were perfused with PBS, and 4 lymph nodes located closest to the cecum were collected. Ten centimeters of small intestines were cut below the pyloric sphincter, and large intestines were removed and separated. Peyer’s patches (4 per mice) were isolated from the small intestine. Both small and large intestines were completely cleaned of mesenteric fat and intestinal content with PBS and placed in 5 mL of HBSS/10 mM HEPES, 8% FBS, and 0.1 mg/mL collagenase D. Intestinal pieces were mechanically dissociated using with scissors for 2 minutes and digested while rotating at 7 g and 37°C for 20 minutes. Intestinal pieces were filtered using a 70-μm cell strainer and washed with cold RPMI 1640 medium. Lymph nodes were gently dissociating through a 70-μm cell strainer using the plunger of a 3-mL syringe. Samples were centrifuged at 400 g for 5 minutes at 4°C. Small intestines and colon were resuspend in 6 mL of 44% Percoll solution at room temperature and underlaid with 3 mL of room temperature 67% Percoll solution. Samples were centrifuge at 1600 g for 20 minutes at room temperature without using the brake. Buffy coats at the 44%–67% interface were collected, and flow cytometry staining was performed.
Flow cytometry.
Single-cell suspensions of aorta, mesentery, colon, mesenteric lymph nodes, Peyer’s patches, kidney, and spleen were prepared, as described previously (24). In brief, the aorta and mesenteric arteries plus surrounding perivascular fat were minced with fine scissors and digested with 1 mg/mL collagenase A and 1 mg/ml collagenase B in phenol-free RPMI 1640 medium with 5% FBS for 30 minutes at 37°C, with intermittent agitation. Kidneys were similarly dissociated mechanically and then digested with collagenase D (1 mg/ml) and DNase I (100μg/ml) in RPMI 1640 medium supplemented with 5% FBS. Mechanical dissociation was performed using a semiautomated dissociater device (Miltenyi) according to the manufacturer’s instructions followed by enzymatic dissociation for 20 minutes at 37°C.
Cell viability was evaluated using a LIVE/DEAD Fixable Violet Dead Cell Stain Kit (Thermo Fisher, L34955). The following antibodies were used for flow cytometry: APC anti-CD45, APC-Cy7 anti-F4/80, PE-Cy7 anti-CD11c, Pacific Blue anti-CD86, BV510 anti-CD19, PE anti-CD3e, PerCP-Cy5.5 anti-CD4 and FITC anti-CD8a. IsoLG protein adducts were detected by intracellular staining with the single-chain antibody D-11 labeled with a fluorochrome using the APEX Alexa Fluor 488 Antibody Labeling kit (Invitrogen). Cells were fixed and permeabilized for intracellular IsoLG detection using a cell permeabilization kit (Invitrogen). For each experiment, we performed flow minus one controls for each fluorophore to establish gates. Data were analyzed using FlowJo software (Tree Star Inc.).
Analysis of cytokine production by T cells using intracellular staining.
Splenocytes (1 × 10⁶) were suspended in 1 mL RPMI supplemented with 5% FBS and stimulated with 2 μl/mL BD Leukocyte Activation Cocktail (ionomycin and phorbol myristic acetate plus the Golgi inhibitor brefeldin A) at 37°C for 5 hours. Dead cells were excluded using a Fixable Violet Dead Cell Stain kit (Thermo Fisher Scientific). The following antibodies were employed to stain cell surface proteins of T cells: PerCP-Cy5.5 anti-CD45 (BD Pharmigen, clone 30-F11), PE anti-CD3 (Biolegend, clone 145-2C11), PE-Cy7 anti-CD4 (Biolegend, clone GK1.5), and APC-H7 anti-CD8 (BD Bioscience, clone 53-6.7). Intracellular staining was then performed using APC anti-IL17A and FITC anti-IFN-γ antibodies (eBioscience) and a Cytofix/Cytoperm Plus fixation/permeabilization solution kit (BD Biosciences).
Histology.
All histology processing and immunohistochemistry staining for immune cells were performed as previously described (51). IsoLG protein adducts were analyzed by immunofluorescence using a D11 ScFv antibody that identifies IsoLG-lysine adducts independent of the protein backbone as previously described (22) and quantified using the NIH ImageJ software. The human tissue samples were provided by the NCI Cooperative Human Tissue Network. Other investigators may have received specimens from the same tissue specimens.
FMT.
Conventionally housed 3-month-old C57Bl/6 male mice were fed a high-salt diet or regular chow for 3 weeks. Fecal pellets were harvested and transported to Taconic on dry ice for fecal transfer into recipient germ-free mice over a period of 7 days. The recipient mice were transferred to Vanderbilt, where they were housed conventionally and implanted with osmotic minipumps (Alzet, model 2002) for infusion of low-dose angiotensin II (140 ng/kg/min) over a 2-week period. Blood pressure was monitored by tail cuff.
Availability of data and material.
The data sets used and/or analyzed during the current study are available in the Sequence Read Archive (accession SRP153041) and Figshare (https://figshare.com/articles/16S_Mouse_data/6845525).
Statistics.
Continuous data are expressed as mean ± SEM. Normality of distribution of continuous data was accessed by Shapiro-Wilk test. Comparisons made between 2 continuous variables were performed using 2-tailed unpaired Student’s t tests or Mann-Whitney according to the distribution. Two-way repeated-measures ANOVA was used to compare changes in blood pressure over time followed by Bonferroni multiple comparison test. Relationships between continuous variables were assessed by Pearson correlation. Statistical analyses were performed by GraphPad Prism 5.00 and SigmaPlot 12.0. For 16S sequence analysis, DNA sequences in Fastq files were assembled, clustered, and phylogenetically classified using the Mothur pipeline (52). Phylogenetic classification was performed against the Silva V123 16S database. Mothur was run using standard cutoffs, creating OTU clusters at 97% identity. For 16S rRNA gene abundance analysis, OTU tables generated from Mothur were analyzed using 2 R packages: Phyloseq (53) and MGSAT (https://bitbucket.org/andreyto/mgsat [commit ID cf60252]). A type-I error rate of 0.05 was set to infer statistical significance. Statistical analysis controlling for age, sex, BMI, race, and sodium was conducted in R software. Log2 transformation was performed on bacteria with highly skewed data distribution. Multiple imputation was performed to impute missing data with Hmisc package in R. Linear regression was used to analyze the relationship between blood pressure and the bacteria. Age, sex, BMI, race, and sodium were also included in the regression model.
Study approvals.
All human subjects provided written informed consent. The study was approved by the Institutional Review Boards of the University of Pennsylvania and Vanderbilt University. Animal studies were approved by the Institutional Animal Care and Use Committee at Vanderbilt University. The Vanderbilt Animal Care and Use Program is registered with the United States Department of Agriculture (USDA registration63-R-0129) and operates under a Public Health Service Animal Welfare Assurance Statement (PHS assurance A3227-01) in AAALAC-accredited facilities.
Author contributions
JFF, LAA, NRB, JPVB, LX, SK, AJS, CW, LP, LEH, MKW, FLR, and AK performed the experiments. JFF, NRB, MBS, ZT, SZ, and GC performed expert statistical analysis. JFF and AK conceived the research program, designed experiments, and wrote the manuscript. JFF, MPR, and AK edited and approved the manuscript. JFF and AK obtained funding for the manuscript.
Supplementary Material
Acknowledgments
This work was supported by American Heart Association grants 16POST29090001 (to NRB) and 15SDG24890015 (to JFF) and NIH grants K01HL130497 (to AK) and U01HL108636 (to MPR) as well as Venture Pilot Funding (to AK) from Vanderbilt Microbiome Initiative and Vanderbilt Institute for Infection, Immunology, and Inflammation (VI4) and a P&F award (to JFF) from Vanderbilt University Medical Center’s Digestive Disease Research Center supported by NIH grant P30DK058404.
Version 1. 06/04/2019
In-Press Preview
Version 2. 07/11/2019
Electronic publication
Footnotes
Conflict of interest: The authors have declared that no conflict of interest exists.
Copyright: © 2019 American Society for Clinical Investigation
Reference information: JCI Insight. 2019;4(13):e126241. https://doi.org/10.1172/jci.insight.126241.
Contributor Information
Jane F. Ferguson, Email: jane.f.ferguson@vanderbilt.edu.
Luul A. Aden, Email: luul.a.aden@vanderbilt.edu.
Natalia R. Barbaro, Email: natalia.rbarbaro@gmail.com.
Justin P. Van Beusecum, Email: justin.van.beusecum@vanderbilt.edu.
Liang Xiao, Email: liang.xiao@vanderbilt.edu.
Cassandra Warden, Email: cassandra.warden@vumc.org.
Lejla Pasic, Email: lejla.pasic.1@vanderbilt.edu.
Lauren E. Himmel, Email: lauren.himmel@vumc.org.
Mary K. Washington, Email: Kay.Washington@vanderbilt.edu.
Frank L. Revetta, Email: frank.revetta@Vanderbilt.Edu.
Shilin Zhao, Email: shilin.zhao.1@vanderbilt.edu.
Shivani Kumaresan, Email: shivani.kumaresan@gmail.com.
Matthew B. Scholz, Email: matthew.b.scholz@vumc.org.
Zhengzheng Tang, Email: ztang2@wisc.edu.
Guanhua Chen, Email: gchen25@wisc.edu.
Muredach P. Reilly, Email: mpr2144@cumc.columbia.edu.
Annet Kirabo, Email: annet.kirabo@vumc.org.
References
- 1.Whelton PK, et al. 2017 ACC/AHA/AAPA/ABC/ACPM/AGS/APhA/ASH/ASPC/NMA/PCNA Guideline for the Prevention, Detection, Evaluation, and Management of High Blood Pressure in Adults: Executive Summary: A Report of the American College of Cardiology/American Heart Association Task Force on Clinical Practice Guidelines. Hypertension. 2018;71(6):1269–1324. doi: 10.1161/HYP.0000000000000066. [DOI] [PubMed] [Google Scholar]
- 2.Kearney PM, Whelton M, Reynolds K, Muntner P, Whelton PK, He J. Global burden of hypertension: analysis of worldwide data. Lancet. 2005;365(9455):217–223. doi: 10.1016/S0140-6736(05)17741-1. [DOI] [PubMed] [Google Scholar]
- 3.Murray CJ, Lopez AD. Measuring the global burden of disease. N Engl J Med. 2013;369(5):448–457. doi: 10.1056/NEJMra1201534. [DOI] [PubMed] [Google Scholar]
- 4.Lev-Ran A, Porta M. Salt and hypertension: a phylogenetic perspective. Diabetes Metab Res Rev. 2005;21(2):118–131. doi: 10.1002/dmrr.539. [DOI] [PubMed] [Google Scholar]
- 5.Weinberger MH, Fineberg NS, Fineberg SE, Weinberger M. Salt sensitivity, pulse pressure, and death in normal and hypertensive humans. Hypertension. 2001;37(2 Pt 2):429–432. doi: 10.1161/01.hyp.37.2.429. [DOI] [PubMed] [Google Scholar]
- 6.Frisoli TM, Schmieder RE, Grodzicki T, Messerli FH. Salt and hypertension: is salt dietary reduction worth the effort? Am J Med. 2012;125(5):433–439. doi: 10.1016/j.amjmed.2011.10.023. [DOI] [PubMed] [Google Scholar]
- 7.Dixon KB, Davies SS, Kirabo A. Dendritic cells and isolevuglandins in immunity, inflammation, and hypertension. Am J Physiol Heart Circ Physiol. 2017;312(3):H368–H374. doi: 10.1152/ajpheart.00603.2016. [DOI] [PMC free article] [PubMed] [Google Scholar]
- 8.Mattson DL. Infiltrating immune cells in the kidney in salt-sensitive hypertension and renal injury. Am J Physiol Renal Physiol. 2014;307(5):F499–F508. doi: 10.1152/ajprenal.00258.2014. [DOI] [PMC free article] [PubMed] [Google Scholar]
- 9.Kirabo A, et al. DC isoketal-modified proteins activate T cells and promote hypertension. J Clin Invest. 2014;124(10):4642–4656. doi: 10.1172/JCI74084. [DOI] [PMC free article] [PubMed] [Google Scholar]
- 10.McMaster WG, Kirabo A, Madhur MS, Harrison DG. Inflammation, immunity, and hypertensive end-organ damage. Circ Res. 2015;116(6):1022–1033. doi: 10.1161/CIRCRESAHA.116.303697. [DOI] [PMC free article] [PubMed] [Google Scholar]
- 11.Guzik TJ, et al. Role of the T cell in the genesis of angiotensin II induced hypertension and vascular dysfunction. J Exp Med. 2007;204(10):2449–2460. doi: 10.1084/jem.20070657. [DOI] [PMC free article] [PubMed] [Google Scholar]
- 12.Madhur MS, et al. Interleukin 17 promotes angiotensin II-induced hypertension and vascular dysfunction. Hypertension. 2010;55(2):500–507. doi: 10.1161/HYPERTENSIONAHA.109.145094. [DOI] [PMC free article] [PubMed] [Google Scholar]
- 13.Mattson DL, Lund H, Guo C, Rudemiller N, Geurts AM, Jacob H. Genetic mutation of recombination activating gene 1 in Dahl salt-sensitive rats attenuates hypertension and renal damage. Am J Physiol Regul Integr Comp Physiol. 2013;304(6):R407–R414. doi: 10.1152/ajpregu.00304.2012. [DOI] [PMC free article] [PubMed] [Google Scholar]
- 14.Itani HA, et al. CD70 Exacerbates Blood Pressure Elevation and Renal Damage in Response to Repeated Hypertensive Stimuli. Circ Res. 2016;118(8):1233–1243. doi: 10.1161/CIRCRESAHA.115.308111. [DOI] [PMC free article] [PubMed] [Google Scholar]
- 15.Wu J, et al. Immune activation caused by vascular oxidation promotes fibrosis and hypertension. J Clin Invest. 2016;126(1):50–67. doi: 10.1172/JCI80761. [DOI] [PMC free article] [PubMed] [Google Scholar]
- 16.Wu J, et al. Inflammation and mechanical stretch promote aortic stiffening in hypertension through activation of p38 mitogen-activated protein kinase. Circ Res. 2014;114(4):616–625. doi: 10.1161/CIRCRESAHA.114.302157. [DOI] [PMC free article] [PubMed] [Google Scholar]
- 17.Xiao L, et al. Renal Denervation Prevents Immune Cell Activation and Renal Inflammation in Angiotensin II-Induced Hypertension. Circ Res. 2015;117(6):547–557. doi: 10.1161/CIRCRESAHA.115.306010. [DOI] [PMC free article] [PubMed] [Google Scholar]
- 18.Mell B, et al. Evidence for a link between gut microbiota and hypertension in the Dahl rat. Physiol Genomics. 2015;47(6):187–197. doi: 10.1152/physiolgenomics.00136.2014. [DOI] [PMC free article] [PubMed] [Google Scholar]
- 19.Wilck N, et al. Salt-responsive gut commensal modulates T. Nature. 2017;551(7682):585–589. doi: 10.1038/nature24628. [DOI] [PMC free article] [PubMed] [Google Scholar]
- 20.Kameyama K, Itoh K. Intestinal colonization by a Lachnospiraceae bacterium contributes to the development of diabetes in obese mice. Microbes Environ. 2014;29(4):427–430. doi: 10.1264/jsme2.ME14054. [DOI] [PMC free article] [PubMed] [Google Scholar]
- 21.Tanaka S, et al. The relationship of Prevotella intermedia, Prevotella nigrescens and Prevotella melaninogenica in the supragingival plaque of children, caries and oral malodor. J Clin Pediatr Dent. 2008;32(3):195–200. doi: 10.17796/jcpd.32.3.vp657177815618l1. [DOI] [PubMed] [Google Scholar]
- 22.Scher JU, et al. Expansion of intestinal Prevotella copri correlates with enhanced susceptibility to arthritis. Elife. 2013;2:e01202. doi: 10.7554/eLife.01202. [DOI] [PMC free article] [PubMed] [Google Scholar]
- 23.Barbaro NR, et al. Dendritic cell amiloride-sensitive channels mediate sodium-induced inflammation and hypertension. Cell Rep. 2017;21(4):1009–1020. doi: 10.1016/j.celrep.2017.10.002. [DOI] [PMC free article] [PubMed] [Google Scholar]
- 24.Saleh MA, et al. Lymphocyte adaptor protein LNK deficiency exacerbates hypertension and end-organ inflammation. J Clin Invest. 2015;125(3):1189–1202. doi: 10.1172/JCI76327. [DOI] [PMC free article] [PubMed] [Google Scholar]
- 25.He FJ, Li J, Macgregor GA. Effect of longer term modest salt reduction on blood pressure: Cochrane systematic review and meta-analysis of randomised trials. BMJ. 2013;346:f1325. doi: 10.1136/bmj.f1325. [DOI] [PubMed] [Google Scholar]
- 26.Kirabo A. A new paradigm of sodium regulation in inflammation and hypertension. Am J Physiol Regul Integr Comp Physiol. 2017;313(6):R706–R710. doi: 10.1152/ajpregu.00250.2017. [DOI] [PMC free article] [PubMed] [Google Scholar]
- 27.Lau K, et al. Bridging the Gap between Gut Microbial Dysbiosis and Cardiovascular Diseases. Nutrients. 2017;9(8):859. doi: 10.3390/nu9080859. [DOI] [PMC free article] [PubMed] [Google Scholar]
- 28.Tang WH, Kitai T, Hazen SL. Gut Microbiota in Cardiovascular Health and Disease. Circ Res. 2017;120(7):1183–1196. doi: 10.1161/CIRCRESAHA.117.309715. [DOI] [PMC free article] [PubMed] [Google Scholar]
- 29.Karbach SH, et al. Gut Microbiota Promote Angiotensin II-Induced Arterial Hypertension and Vascular Dysfunction. J Am Heart Assoc. 2016;5(9):e003698. doi: 10.1161/JAHA.116.003698. [DOI] [PMC free article] [PubMed] [Google Scholar]
- 30.Li J, et al. Gut microbiota dysbiosis contributes to the development of hypertension. Microbiome. 2017;5(1):14. doi: 10.1186/s40168-016-0222-x. [DOI] [PMC free article] [PubMed] [Google Scholar]
- 31.Yang T, et al. Gut dysbiosis is linked to hypertension. Hypertension. 2015;65(6):1331–1340. doi: 10.1161/HYPERTENSIONAHA.115.05315. [DOI] [PMC free article] [PubMed] [Google Scholar]
- 32.Festi D, Schiumerini R, Eusebi LH, Marasco G, Taddia M, Colecchia A. Gut microbiota and metabolic syndrome. World J Gastroenterol. 2014;20(43):16079–16094. doi: 10.3748/wjg.v20.i43.16079. [DOI] [PMC free article] [PubMed] [Google Scholar]
- 33.Ley RE, Bäckhed F, Turnbaugh P, Lozupone CA, Knight RD, Gordon JI. Obesity alters gut microbial ecology. Proc Natl Acad Sci USA. 2005;102(31):11070–11075. doi: 10.1073/pnas.0504978102. [DOI] [PMC free article] [PubMed] [Google Scholar]
- 34.Lukens JR, et al. Dietary modulation of the microbiome affects autoinflammatory disease. Nature. 2014;516(7530):246–249. doi: 10.1038/nature13788. [DOI] [PMC free article] [PubMed] [Google Scholar]
- 35.de Moreno de Leblanc A, Matar C, Farnworth E, Perdigón G. Study of immune cells involved in the antitumor effect of kefir in a murine breast cancer model. J Dairy Sci. 2007;90(4):1920–1928. doi: 10.3168/jds.2006-079. [DOI] [PubMed] [Google Scholar]
- 36.Vinderola G, Perdigón G, Duarte J, Farnworth E, Matar C. Effects of the oral administration of the exopolysaccharide produced by Lactobacillus kefiranofaciens on the gut mucosal immunity. Cytokine. 2006;36(5-6):254–260. doi: 10.1016/j.cyto.2007.01.003. [DOI] [PubMed] [Google Scholar]
- 37.Vinderola G, Perdigón G, Duarte J, Farnworth E, Matar C. Effects of the oral administration of the products derived from milk fermentation by kefir microflora on immune stimulation. J Dairy Res. 2006;73(4):472–479. doi: 10.1017/S002202990600197X. [DOI] [PubMed] [Google Scholar]
- 38.de Moreno de LeBlanc A, Matar C, Farnworth E, Perdigon G. Study of cytokines involved in the prevention of a murine experimental breast cancer by kefir. Cytokine. 2006;34(1-2):1–8. doi: 10.1016/j.cyto.2006.03.008. [DOI] [PubMed] [Google Scholar]
- 39.Vinderola G, Perdigon G, Duarte J, Thangavel D, Farnworth E, Matar C. Effects of kefir fractions on innate immunity. Immunobiology. 2006;211(3):149–156. doi: 10.1016/j.imbio.2005.08.005. [DOI] [PubMed] [Google Scholar]
- 40.Mainville I, Robert N, Lee B, Farnworth ER. Polyphasic characterization of the lactic acid bacteria in kefir. Syst Appl Microbiol. 2006;29(1):59–68. doi: 10.1016/j.syapm.2005.07.001. [DOI] [PubMed] [Google Scholar]
- 41.Vinderola CG, Duarte J, Thangavel D, Perdigón G, Farnworth E, Matar C. Immunomodulating capacity of kefir. J Dairy Res. 2005;72(2):195–202. doi: 10.1017/S0022029905000828. [DOI] [PubMed] [Google Scholar]
- 42.Mainville I, Arcand Y, Farnworth ER. A dynamic model that simulates the human upper gastrointestinal tract for the study of probiotics. Int J Food Microbiol. 2005;99(3):287–296. doi: 10.1016/j.ijfoodmicro.2004.08.020. [DOI] [PubMed] [Google Scholar]
- 43.Mizoguchi T, et al. Oral administration of the lactic acid bacterium Pediococcus acidilactici attenuates atherosclerosis in mice by inducing tolerogenic dendritic cells. Heart Vessels. 2017;32(6):768–776. doi: 10.1007/s00380-017-0949-8. [DOI] [PubMed] [Google Scholar]
- 44.Vinh A, et al. Inhibition and genetic ablation of the B7/CD28 T-cell costimulation axis prevents experimental hypertension. Circulation. 2010;122(24):2529–2537. doi: 10.1161/CIRCULATIONAHA.109.930446. [DOI] [PMC free article] [PubMed] [Google Scholar]
- 45.Trabulsi J, Schoeller DA. Evaluation of dietary assessment instruments against doubly labeled water, a biomarker of habitual energy intake. Am J Physiol Endocrinol Metab. 2001;281(5):E891–E899. doi: 10.1152/ajpendo.2001.281.5.E891. [DOI] [PubMed] [Google Scholar]
- 46.Subar AF, et al. Comparative validation of the Block, Willett, and National Cancer Institute food frequency questionnaires: the Eating at America’s Table Study. Am J Epidemiol. 2001;154(12):1089–1099. doi: 10.1093/aje/154.12.1089. [DOI] [PubMed] [Google Scholar]
- 47.Caporaso JG, et al. Ultra-high-throughput microbial community analysis on the Illumina HiSeq and MiSeq platforms. ISME J. 2012;6(8):1621–1624. doi: 10.1038/ismej.2012.8. [DOI] [PMC free article] [PubMed] [Google Scholar]
- 48.McCormick JA, Nelson JH, Yang CL, Curry JN, Ellison DH. Overexpression of the sodium chloride cotransporter is not sufficient to cause familial hyperkalemic hypertension. Hypertension. 2011;58(5):888–894. doi: 10.1161/HYPERTENSIONAHA.110.167809. [DOI] [PMC free article] [PubMed] [Google Scholar]
- 49.Kozich JJ, Westcott SL, Baxter NT, Highlander SK, Schloss PD. Development of a dual-index sequencing strategy and curation pipeline for analyzing amplicon sequence data on the MiSeq Illumina sequencing platform. Appl Environ Microbiol. 2013;79(17):5112–5120. doi: 10.1128/AEM.01043-13. [DOI] [PMC free article] [PubMed] [Google Scholar]
- 50.Qiu Z, Sheridan BS. Isolating Lymphocytes from the Mouse Small Intestinal Immune System. J Vis Exp. 2018;(132):57281. doi: 10.3791/57281. [DOI] [PMC free article] [PubMed] [Google Scholar]
- 51.Kirabo A, et al. Vascular smooth muscle Jak2 mediates angiotensin II-induced hypertension via increased levels of reactive oxygen species. Cardiovasc Res. 2011;91(1):171–179. doi: 10.1093/cvr/cvr059. [DOI] [PMC free article] [PubMed] [Google Scholar]
- 52.Schloss PD, et al. Introducing mothur: open-source, platform-independent, community-supported software for describing and comparing microbial communities. Appl Environ Microbiol. 2009;75(23):7537–7541. doi: 10.1128/AEM.01541-09. [DOI] [PMC free article] [PubMed] [Google Scholar]
- 53.McMurdie PJ, Holmes S. phyloseq: an R package for reproducible interactive analysis and graphics of microbiome census data. PLoS One. 2013;8(4):e61217. doi: 10.1371/journal.pone.0061217. [DOI] [PMC free article] [PubMed] [Google Scholar]
Associated Data
This section collects any data citations, data availability statements, or supplementary materials included in this article.


