. 2019 Jul 2;8:e47145. doi: 10.7554/eLife.47145

Figure 2. Similarities between the high- and low-affinity states of the cytoplasmic dynein-1 MTBD.

(A) A comparison between the newly refined cytoplasmic dynein-1 MTBD model (pink) and the low-affinity state crystal structure (PDB 3ERR, docked to the same density, white). CC1 and H1 (highlighted in magenta and grey for high- and low-affinity states respectively) rise in the high-affinity state to solve a steric clash with the microtubule (α-tubulin in green, β-tubulin in blue) (B) Orthogonal view of A, highlighting the similarity between the two models away from CC1/H1. Cartoon displays organisation of H2-H5 as visibile in the model. (C) A comparison the previous 9.7 Å cryo-EM microtubule-bound model (gold, PDB 3J1T) and the low-affinity state crystal structure (white, 3ERR). There is a larger movement up and to the side in CC1 and H1 (orange and grey for 3J1t and 3ERR respectively) in 3J1T compared to the new model. (D) Orthogonal view of C, showing H2, H3 and H4 all in different conformations relative to the microtubule in 9.7 Å model.

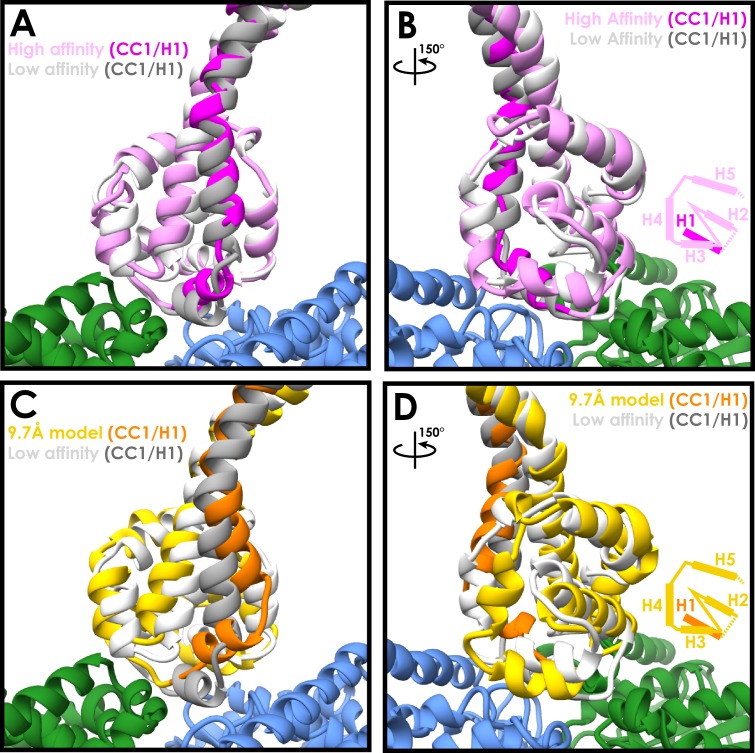
Figure 2.

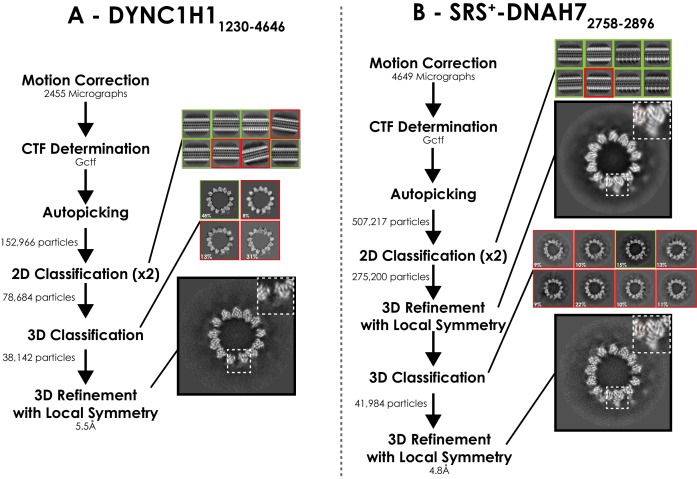
Figure 2—figure supplement 1. Processing pipeline for DYNC1H11230-4646 and SRS+-DNAH7 2758-2896 structures.

Figure 2—figure supplement 1.

(A) Processing pipeline for DYNC1H11230-4646 structure. (B) Processing pipeline for SRS+-DNAH72758-2896 structure. 3D classification directly after 2D classification did not result in a good class. 3D refinement was performed, and these orientations were used for 3D classification. This good class was taken forwards for 3D refinement, creating the final DNAH7 structure.
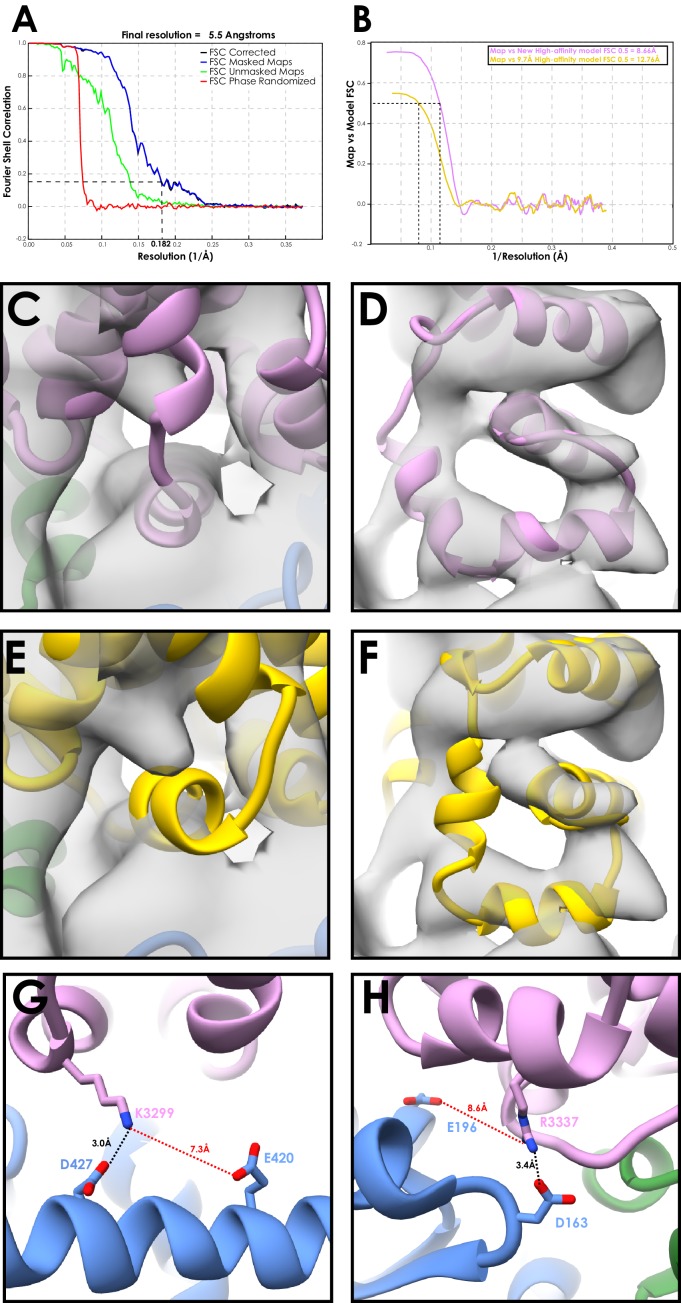
Figure 2—figure supplement 2. Validation of the SRS-DYNC1H13260-3427 model with the dynein motor domain.

Figure 2—figure supplement 2.

(A) FSC curve for the DYNC1H11230-4646 decorated microtubule structure (FSC0.143 cut-off, gold-standard). (B) Model to map FSC curves for our new high-affinity cytoplasmic dynein-1 model or the previous 9.7 Å high-affinity model (3J1T) docked into the DYNC1H11230-4646 map (C) Our newly refined cytoplasmic dynein-1 high-affinity model (Figure 1D/E) docked into the DYNC1H11230-4646 map (filtered to 8 Å), viewing CC1 and H1 (D) Orthogonal view of C, viewing H2-H4 (E) Equivalent to C, but with the previous 9.7 Å cryo-EM MTBD model docked. H1 is now fully outside the density, compared to a good fit in B F) - Orthogonal view of E, showing most of H2, H3 and H4 outside the density, compared to good fits in C G) - The 4.1 Å resolution density does not show side-chain positions for most of the MTBD. However, based on our model and all possible rotamer conformations, a number of interactions between the MTBD and the microtubule identified previously (Redwine et al., 2012) are too far apart in the new model. The tubulin residue interacting K3299 was suggested to be E420, but this is now too far to interact, and we suggest that D427 is the more likely partner. (H) - Similarly, R3337 is now more likely to interact with D163 than E196.