Summary
Hippocampal place cells are spatially tuned neurons that serve as elements of a “cognitive map” in the mammalian brain1. To detect the animal’s location, place cells are thought to rely upon two interacting mechanisms: sensing the animal’s position relative to familiar landmarks2,3 and measuring the distance and direction that the animal has traveled from previously occupied locations4–7. The latter mechanism, known as path integration, requires a finely tuned gain factor that relates the animal’s self-movement to the updating of position on the internal cognitive map, with external landmarks necessary to correct positional error that accumulates8,9. Path-integration-based models of hippocampal place cells and entorhinal grid cells treat the path integration gain as a constant9–14, but behavioral evidence in humans suggests that the gain is modifiable15. Here we show physiological evidence from hippocampal place cells that the path integration gain is indeed a highly plastic variable that can be altered by persistent conflict between self-motion cues and feedback from external landmarks. In a novel, augmented reality system, visual landmarks were moved in proportion to the animal’s movement on a circular track, creating continuous conflict with path integration. Sustained exposure to this cue conflict resulted in predictable and prolonged recalibration of the path integration gain, as estimated from the place cells after the landmarks were extinguished. We propose that this rapid plasticity keeps the positional update in register with the animal’s movement in the external world over behavioral timescales. These results also demonstrate that visual landmarks not only provide a signal to correct cumulative error in the path integration system4,8,16–19, but also rapidly fine-tune the integration computation itself.
Path integration is an evolutionarily conserved strategy that allows an organism to maintain an internal representation of its current location by integrating over time a movement vector representing distance and direction traveled4–7. Place cells and entorhinal grid cells have been implicated as key components of a path integration system in the mammalian brain20–22. We recorded place cells from area CA1 (Extended Data Fig. 1) in 5 rats as they ran laps on a 1.5 m diameter circular track. The track was enclosed within a planetarium-style dome where an array of three visual landmarks was projected onto the interior surface to create an augmented reality environment (Fig. 1a,b). In contemporary virtual reality systems3,23–25, head- or body-fixed rats fictively locomote on a stationary air-cushioned ball or treadmill. Notwithstanding the flexibility of these systems to manipulate the visual experience of the animal, we built the dome apparatus to instead more completely preserve natural self-motion cues, such as vestibular, proprioceptive, and motor efference copy. This system enabled us to test the a priori hypothesis that manipulating the animal’s perceived movement speed relative to the landmarks results in a predictable recalibration of the path integration gain.
Figure 1|. Dome apparatus, experimental procedure, and sample data.
a, Semi-transparent illustration of the dome apparatus. b, Photo of the apparatus. The dome is raised to allow visualization of the interior, but it is lowered as in (a) for the experiment. c, Illustration of experimental gain G. From the same initial positions of the landmarks and rat, three gain conditions are shown, in both lab (top) and landmark (bottom) frames of reference. In each case, the rat runs 90° in the lab frame. d, Profile of gain change and epochs during a typical session. An annular ring is always projected at the top of the dome (as shown in (a)) for illumination purposes, and is not turned off even in Epoch 4. e, Representative firing rate maps for five different units from five separate gain manipulation sessions, shown in the lab frame (top, middle rows) and landmark frame (bottom row) during Epoch 3 (constant experimental gain). Plots in the top row are color scaled to their own individual maximum firing rates; middle and bottom row plots are color scaled to the maximum firing rate of the bottom plot of each pair.
To create the visual illusion that the animal was running faster or slower, the array of landmarks was rotated coherently as a function of the animal’s movement speed. Movement of the landmarks was controlled by an experimental gain, G, which set the ratio between the rat’s travel distance with respect to the landmarks (landmark reference frame) and its travel distance along the stationary circular track (laboratory reference frame) (Fig. 1c). Recording sessions began with G = 1 (Epoch 1), a control condition with landmarks held stationary, so that the rat traveled the same distance in both the landmark and lab frames (Fig. 1d). The gain was then ramped over the course of multiple laps (Epoch 2) to values less than or greater than one. For G < 1, the landmarks moved at a speed proportional to (but slower than) the rat in the same direction; hence, the rat ran a shorter distance in the landmark frame than in the lab frame. For G > 1, the landmarks moved in the opposite direction; hence, the rat ran a greater distance in the landmark frame than in the lab frame. In Epoch 3, G was held at a steady-state target value (Gfinal). In some sessions, the landmarks were then extinguished (Epoch 4) to assess whether the effects of gain adjustment persisted in the absence of the landmarks.
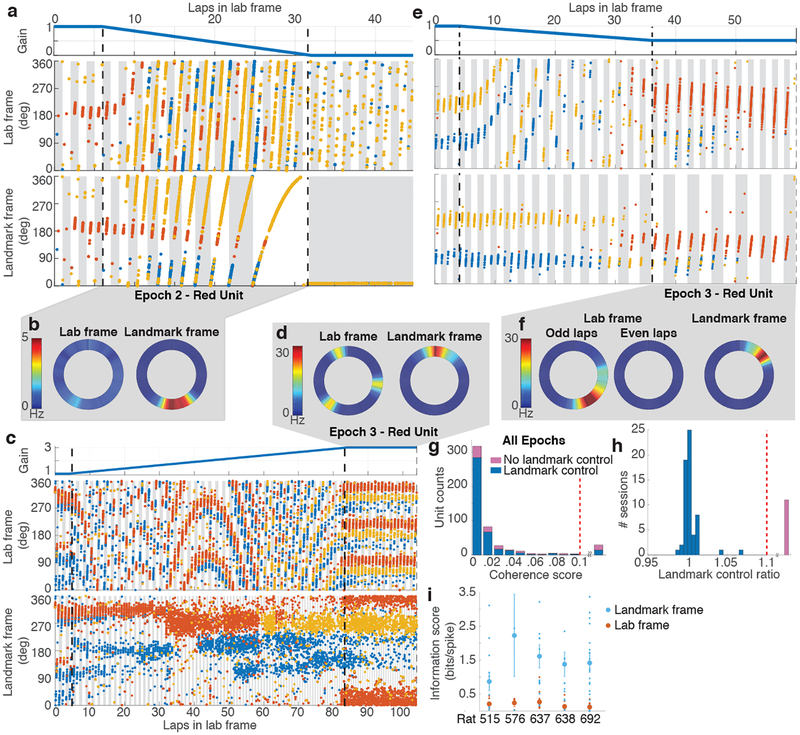
Under gain-adjusted conditions, CA1 units (mean 7.2 ± 5.8 S.D. units/session) tended to fire in normal, spatially specific place fields when the firing was plotted in the landmark frame, but not when plotted in the lab frame (Fig. 1e). The strength and continuity of visual cue control over the place fields is highlighted by special cases of G (Fig. 2). As G was ramped down to 0, the place fields became increasingly large in the lab frame, eventually spanning multiple laps (Fig. 2a; Supplementary Video 1), but they maintained normal spatial selectivity in the landmark frame (Fig. 2b). At G = 0, the animal’s position became locked to the landmark frame, as the landmarks moved in precise register with the rat. Consequently, a unit that was active at that moment would typically remain active throughout Epoch 3, (e.g. yellow unit, Fig. 2a); in contrast, a unit that was inactive at that moment would typically remain silent throughout Epoch 3 (e.g. red unit, Fig 2a). When G was clamped at integer ratios such as 3/1 (Fig. 2c) or 1/2 (Fig. 2e), the units maintained the typical pattern of one field/lap in the landmark frame, while firing at the expected periodicity such as 3 times per lap (Fig. 2d) or every other lap (Fig. 2f) in the lab frame. Remapping events sometimes caused different populations of place cells to be active at different times. For example, place cells active during the initial part of the session sometimes went silent (loss of field; Fig. 2e, yellow unit), and place cells silent during the initial part of the session sometimes began firing at a preferred location (gain of field; Fig. 2e, red unit). The remapped cells exhibited normal place fields only in the landmark frame. These examples illustrate that the landmark array exercised robust control over the place fields, outweighing any subtle, local cues on the apparatus as well as nonvisual path integration cues, such as vestibular or proprioceptive cues.
Figure 2 |. Control of place fields by landmarks.
a, (top) Profile of experimental gain, G, for Epochs 1–3 of a session where Gfinal was 0. (middle) Colored dots show the location of the rat in the lab frame (y axis) as a function of cumulative distance traveled on the track (x axis) when spikes from 3 units (red, blue, yellow) were recorded. Alternate gray and white bars indicate laps in this frame. (bottom) The same spikes in the landmark frame. Alternate gray and white bars indicate laps in this frame. The yellow unit fired weakly during the first 8 laps, became stronger on laps 9–10, and maintained the strong field in the landmark frame throughout the remainder of the session. During the last landmark-frame lap, the unit fired in a field that spanned ~1080° (3 laps) in the lab frame (middle). b, Rate maps of the red unit in lab and landmark frames for Epoch 2 of the trial shown in (a). The firing rate is low and diffusely distributed (on average) in the lab frame, whereas there is a well-defined place field in the landmark frame. c, Epochs 1–3 of a session where the Gfinal was 2 (same format as (a)). In Epoch 3, all three units maintain normal spatial firing in the landmark reference frame, but they have 3 fields/lap, separated by 120°, in the lab frame. d, Rate maps of the red unit for Epoch 3 of the trial shown in (c). e, Epochs 1–3 of a session where the Gfinal was 0.5. Remapping occurred near the transition between Epoch 2 and Epoch 3, as the previously silent red unit became active and maintained a stable place field in the landmark frame. In the lab frame, however, the unit fired every other lap, (i.e., it was active on the gray laps and silent on the intervening white laps). f, Rate maps for the red unit for Epoch 3 of the trial shown in (e). Separate rate maps are shown for the odd- and even-numbered laps in the lab frame. g, Coherence of the population response. The n = 500 units acted as a coherent population in sessions with (blue, 411/500) and without (pink, 89/500) landmark control (see panel h). Units with coherence score above 0.1 (range 0.12 – 0.47) were combined in a single bin (29/500 units). These cells generally displayed poor spatial tuning and therefore did not admit a reliable estimate of hippocampal gain. h, Landmark control ratio. In most sessions (blue, 60/72), the landmark control ratio was ~ 1. Sessions with gain ratio above 1.1 (range 1.16 – 4.02) were combined in a single bin (pink, 12/72). i, Spatial information scores in the lab and landmark frames for each rat (sessions with n = 12, 3, 17, 15, 29 units) are significantly different (two-sided paired t-test, n = 5 rats, t4 = 6.213, p = 0.0034). Small dots represent scores from individual units. Mean (large dots) ± s.e.m. are shown.
To quantify the degree of landmark control over the population of recorded place cells, we developed a novel decoding algorithm that was robust to the remapping events described above. We estimated the gain, Hi, for each individual unit, i, by measuring its spatial frequency (i.e., the frequency of repetition of its spatially periodic firing pattern). The median value of Hi over all simultaneously recorded active units during a given set of laps was taken as a population estimate of the hippocampal gain, H, for those laps. Just as G quantifies the ratio between the rat’s travel distance in the landmark frame versus lab frame, H quantifies the ratio between the rat’s travel distance in the internal hippocampal “cognitive map” frame1 versus the lab frame. An ensemble coherence score for each unit was computed as the mean value over the session of | 1 - Hi / H |, measuring the deviation of Hi from H (Methods). The distribution of coherence scores (Fig. 2g) shows that Hi was within 2% of H for 80% (399/500) of individual units, and deviations greater than 5% were rare. Even when individual cells remapped, they still exhibited spatial periodicity at gain factors Hi that were close to H (see red and yellow units in Fig. 2c). Hence, the population of place cells acted as a rigidly coordinated ensemble from which a precise estimate of H could reliably be computed, despite occasional remapping by some place cells.
The degree of cue control in each session was quantified by the mean ratio H/G for Epochs 1–3 of a session; a ratio close to 1 indicates that the cognitive map was anchored to the landmark frame (i.e., G = H). The majority of sessions (83.33%) exhibited H/G near 1, but the rest showed substantially larger ratios (H/G > 1.1) indicating loss of landmark control (Fig. 2h; Extended Data Fig. 2). For sessions with H/G < 1.1, the spatial information per spike in the landmark frame far exceeded that in the lab frame (Fig. 2i). Further quantitative analyses was restricted to these sessions demonstrating ‘landmark control’. These results indicate that the augmented reality dome was successful in producing the desired illusion by strongly controlling the spatial firing patterns of the hippocampal cells in the majority of sessions (Extended Data Figs. 3, 4).
Despite strong cue control in the majority of sessions, place fields nonetheless tended to drift systematically by a small amount against the landmark frame on each successive lap (Extended Data Fig. 5; also visible in Figs. 2a,c,e and 3a,b) leading to total drifts of up to ~80° over the course of a session. The direction of this bias was consistent with a continuous conflict between the dynamic landmark reference frame and a path-integration-based estimate of position (although we cannot rule out the possible contribution of subtle uncontrolled external cues on the track or in the laboratory). That is, when path integration presumably undershot the landmark-defined location systematically (G < 1), the place fields shifted slightly backwards in the landmark frame; conversely, when path integration overshot the landmarks (G > 1), the place fields shifted forward. The shift may reflect a conflict resolution that is weighted heavily, but not completely, in the direction predicted by the landmark frame.
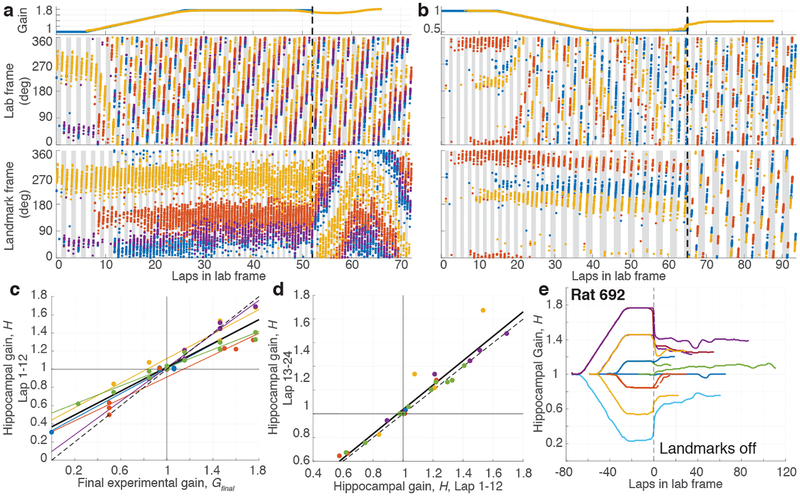
Figure 3 |. Recalibration of place fields by landmarks.
a, Example of positive recalibration. (top) Experimental gain, G (blue) and hippocampal gain, H (yellow) for Epochs 1–3 of a session in which the Gfinal was 1.769. (middle) Spikes from three putative pyramidal cells (blue, red and yellow dots) in the lab frame. (bottom) The same spikes in the landmark frame. When the landmarks were turned off (dashed line, Epoch 4), H remained close to Gfinal, shown by the slower drift of the place fields in the landmark frame compared to the lab frame. (During Epoch 4, the landmark frame was defined assuming the gain was Gfinal even though landmarks were off.). Note that the traces of H (yellow) deviate from G (blue) prior to the landmarks turning off; this is an artifact of the sliding window used in the spectrogram and does not affect the conclusions (see Methods, Visualizing H). b, Example of negative recalibration. The Gfinal was 0.539. c, Recalibration of place fields. The x-axis is Gfinal and the y-axis is H computed using the first 12 laps (i.e., the value of H at lap 6) after the landmarks were turned off. Linear fits for each animal (color) and for the whole data set (black) are shown (n = 45 sessions, Pearson’s r43 = 0.94, p = 3.4 × 10⁻²¹), along with the perfect recalibration line (dashed line, black). Note that the linear fit passes close to the origin, showing that H≈1 when the landmarks were extinguished after baseline control experiments. d, Stability of recalibration. Comparison of H during laps 1–12 vs. H during laps 13–24. The linear fit is shown in black. (n = 27 sessions, Pearson’s r25 = 0.96, p = 1.16 × 10⁻¹⁵) e, Complete gain dynamics for one animal. For all sessions from one rat, H is plotted as a function of laps run in the lab frame. All the sessions are aligned to the instant when the landmarks were turned off (lap 0). The recalibrated H was maintained for as many as 50 laps or more.
Given the apparent influence of path integration on place cells, revealed by systematic place-field drift despite strong landmark control, we tested whether anchoring of the cognitive map to the gain-altered landmark frame induced a recalibration of the path integrator that persisted in the absence of landmarks. Such recalibration would be evidenced by a predictable change in the hippocampal gain H when visual landmarks were extinguished (Fig. 1d, Epoch 4). The baseline hippocampal gain H was measured for each animal after extinguishing landmarks in sessions where the rat ran ~30 laps with stationary landmarks (G = 1). As expected, the baseline value of H was close to 1 (range 0.997 – 1.036). In subsequent gain manipulation sessions, if the path integrator circuit were unaltered, one would expect the place fields to revert to the lab frame (H ≈ 1) when landmarks were extinguished, as in the baseline sessions. Alternatively, if the path integrator gain were recalibrated perfectly, one would expect that the place fields would continue to fire as if the landmarks were still present and rotating at the final experimental gain (i.e., H ≈ Gfinal). We found that the hippocampal representation during Epoch 4 was intermediate between these extremes (Fig. 3a,b; Supplementary Video 2): there was a clear, linear relationship between Gfinal and the hippocampal gain H estimated during the first 12 laps after the landmarks were turned off (Fig. 3c). Moreover, this linear relationship was maintained when H was estimated during the next 12 laps Extended Data Fig. 6f). The values of H for the first and second 12 laps were highly correlated (Fig. 3d) with a slope near 1 (1.03). Thus, H was stable over at least 18 laps (i.e., the middle of the second estimation window). Despite this overall stability, there were still fluctuations in H in the absence of landmarks (Fig. 3e, Extended Data. Fig. 6). We tested whether changes in behavior could account for the hippocampal gain recalibration by computing several behavioral measures for each epoch (Extended Data, Behavioral Analysis). Multiple regression analysis showed that Gfinal strongly predicted H, whereas the behavioral variables had negligible influences on H (Extended Data Table 1).
Using a novel augmented reality dome apparatus, we show here that the path integration system employs a modifiable gain factor that can be recalibrated to a new value that can remain stable for at least several minutes in the absence of salient landmarks. Recalibration of this nature has been described extensively in other systems. The cerebellum plays a key role in recalibration of feedforward motor commands26. Similarly, the gain of the vestibulo-ocular reflex adapts to changes in the magnitude of retinal slip caused by magnifying glasses, an effect that persists even after the glasses are removed27. As with our own results, the recalibration is not perfect in these motor adaptation tasks; i.e., the gain measured after the training trials are biased towards, but not precisely the same as, the experimental gain implemented during the training trials. To our knowledge, such gain recalibration has not been demonstrated physiologically in cognitive phenomena such as spatial representation and path integration (but see15). The lack of complete recalibration may be due to an insufficient number of training laps during Epoch 3, or may reflect inherent limits on the plasticity of the path integrator gain variable.
It is widely accepted that visual landmarks provide a signal to correct error that accumulates during path integration28. The results in this paper demonstrate physiological evidence for a role of vision in the path integration computation itself by providing an error signal analogous to retinal slip in the VOR27. Specifically, this error signal fine-tunes the gain of the path integrator15, minimizing the accumulation of error in the first place. Although recalibration of the path integrator gain may be expected over developmental time scales, these results indicate that the path integration gain is fine-tuned even at behavioral time scales. This fine-tuning may be required to (a) maintain accuracy of the path integration signal under different behavioral conditions (e.g., locomotion on different surfaces that provide varying degrees of slip and cause alterations in the self-motion inputs to the path integrator); (b) synchronize the different types of self-motion signals (e.g., vestibular, optic flow, motor copy, or proprioception) thought to underlie path integration; and (c) coordinate the discrete set of different path integration gains thought to underlie the expansion of grid scales along the dorsal-ventral axis of the medial entorhinal cortex12,29,30. The recalibration might be implemented by changes to the head direction31 or speed32,33 signals that provide input to a path integration circuit. Alternatively, these representations may be unaltered and the gain changes are implemented by changing the synaptic weights between the inputs and putative attractor networks that perform the path integration9–11,13. The augmented reality system described here will allow the investigation of mechanisms underlying the interaction between external sensory input and the internal neural dynamics at the core of the path integration system.
Extended Data
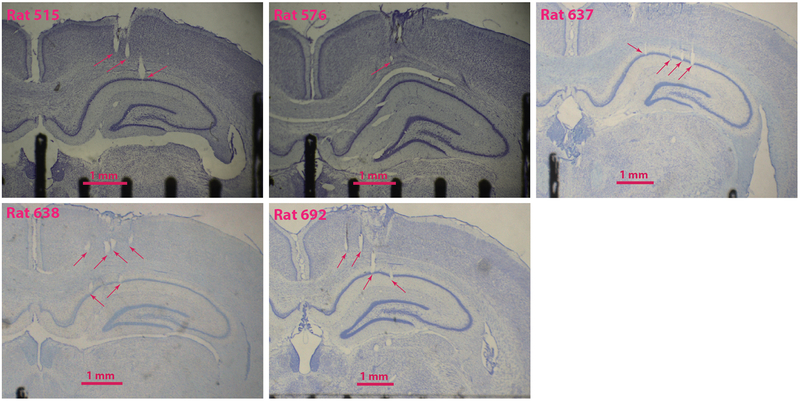
Extended Data Figure 1: Representative histology.
Coronal slices from the five rats used in this study. Arrows point to tetrode tracks in different stages of advancement towards CA1. Note that these are not always the termination of these tetrodes, simply one section along their tracks. In one animal (Rat 576), the histology was inconclusive due to poor fixation and slice quality; however, we determined that the tetrodes were correctly placed in CA1 by the medio-lateral placement of the bundle, tracks in the few sections that we could analyze, and features in the EEG signals observed during recording (e.g., sharp wave/ripples). In one animal, (Rat 638), two of the most medial tetrodes (not shown) appeared to record from the fasciola cinereum, rather than CA1.
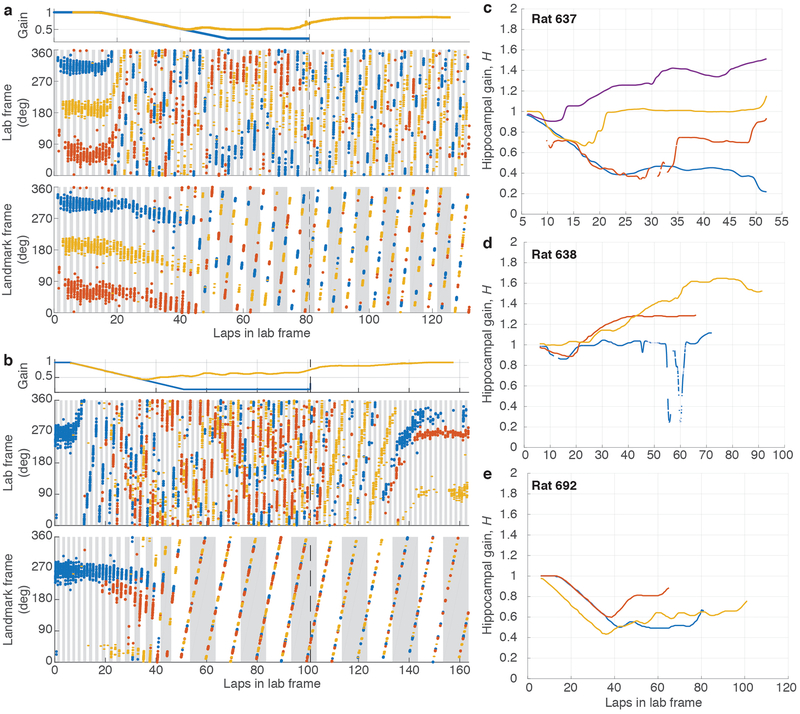
Extended Data Figure 2: Examples of failure of landmark control.
a, (top) Experimental gain, G (blue), and hippocampal gain, H (yellow), for Epochs 1–3 of a session where Gfinal was 0.231. Note that the two curves overlap until ~lap 40, when they start to diverge. (middle) Spikes from three putative pyramidal cells (colored dots) in the lab frame. Alternate gray and white bars indicate laps in the lab frame. (bottom) The same spikes in the landmark frame. At the point of landmark control failure, the place cells stop firing at a particular location in the landmark frame, and instead start drifting in both lab and landmark frames. Alternating gray and white bars indicate laps in the landmark frame. b, Second example, from a different animal, for a session where Gfinal was 0.1 (same format as (a)). c-e, Trajectory of hippocampal gain, H, for three rats for all sessions where landmark control failed. The hippocampal gain generally starts near 1 and then diverges from the experimental gain trajectory (not shown) during the session.
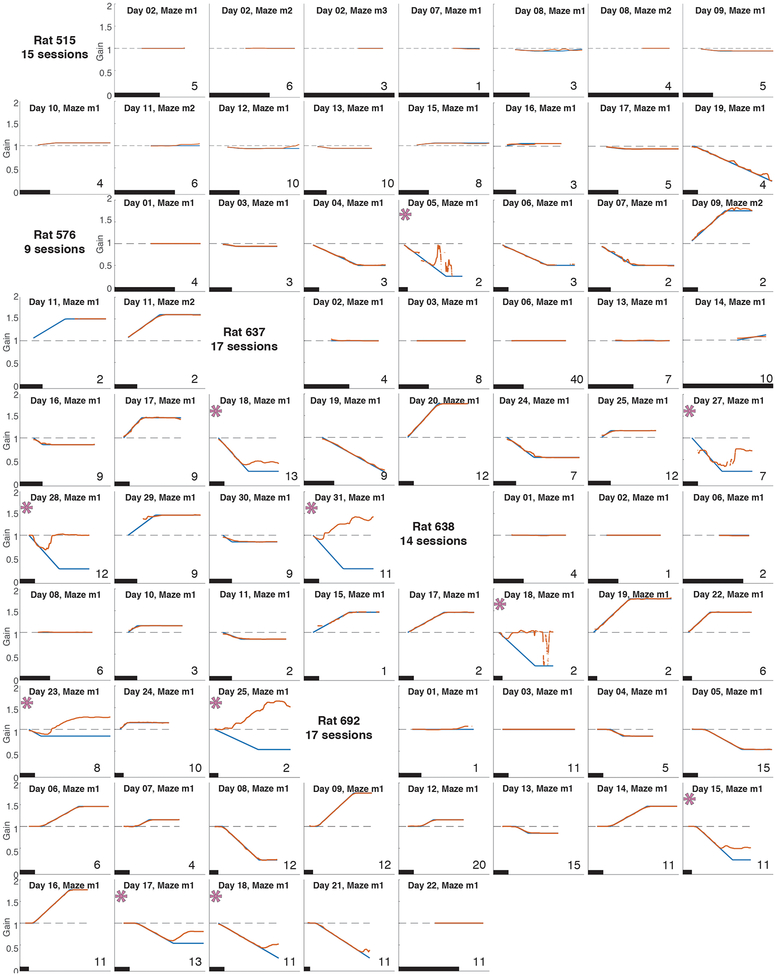
Extended Data Figure 3: Gain dynamics during each experiment.
Each plot represents data from a single experiment. The x-axis is the laps that the rat ran in the lab frame (on the table) and the y-axis is gain. The black scale bar in each plot indicates 10 laps. The applied experimental gain (blue) is plotted with the hippocampal gain estimate (red). The ramp rate, length of epochs and final experimental gain for each session can be observed from the curves. An asterisk indicates experiments with loss of landmark control (gain ratio greater than 1.1; see Fig. 2h). In the other plots, the blue and red curves overlap indicating control of landmarks over the place fields. Number of units that passed acceptance criteria (Methods) in each session is indicated in the bottom right hand corner of each plot.
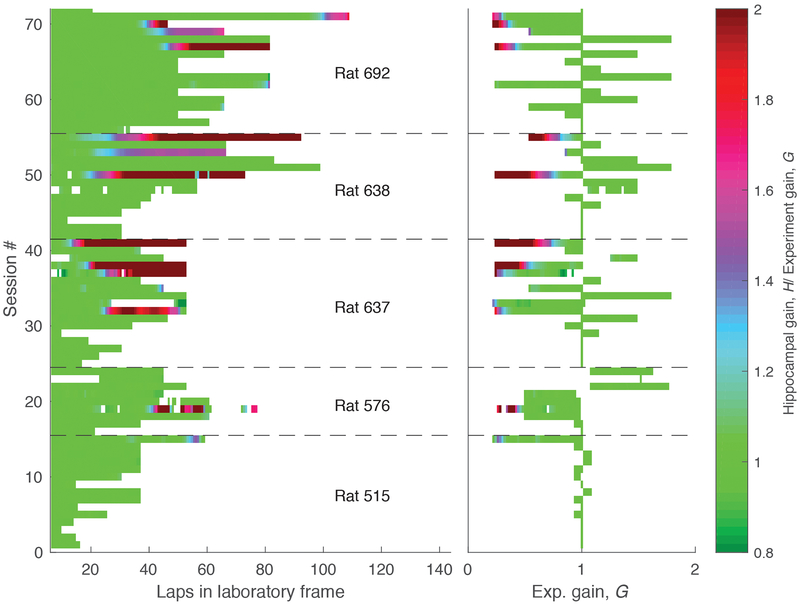
Extended Data Figure 4: Summary of dataset.
Each row indicates one of the 72 sessions composing the dataset during the period when the landmarks were on. In the left plot, the x-axis is laps in the lab frame. In the right plot the x-axis is experimental gain, G. The sessions are chronologically ordered (bottom to top). Sessions from different animals are separated by dashed lines. In all rats, we typically performed smaller manipulations in G first, since initial landmark failure tended to occur at larger manipulations of G. Once landmark control failed, it tended to fail more frequently. The color represents the ratio between hippocampal and experimental gains (H/G, color bar, right). Green (H/G = 1) indicates landmark control. Four of the rats (576, 637, 638, 692) experienced landmark failure (red portions of trials). Failures only happened when the G was less than one (i.e., the landmarks moved in the same direction as the rat) and generally occurred at low values of G (less than 0.5) and after rats had experienced multiple gain manipulation sessions over days. The asymmetry in landmark control between G < 1 and G > 1 is similar to a study of medial entorhinal cortex by Campbell and colleagues41. In this study, mice ran on a VR linear track controlled by a stationary treadmill, and the authors manipulated the gain factor between distance traveled on the treadmill versus the VR track. Grid cells showed asymmetric responses to increases versus decreases of the gain. Gain increases (i.e., G > 1) caused phase shifts in the spatial firing patterns but gain decreases (i.e., G < 1) caused changes in the spatial scales. These results were elegantly explained by a model of how grid cells respond to conflicts between self-motion and landmark cues. Although this paper did not address the issues of path integration gain recalibration as in the current study, its results may provide a causal explanation for the asymmetric responses of place cells to the landmark manipulations seen in the present study.
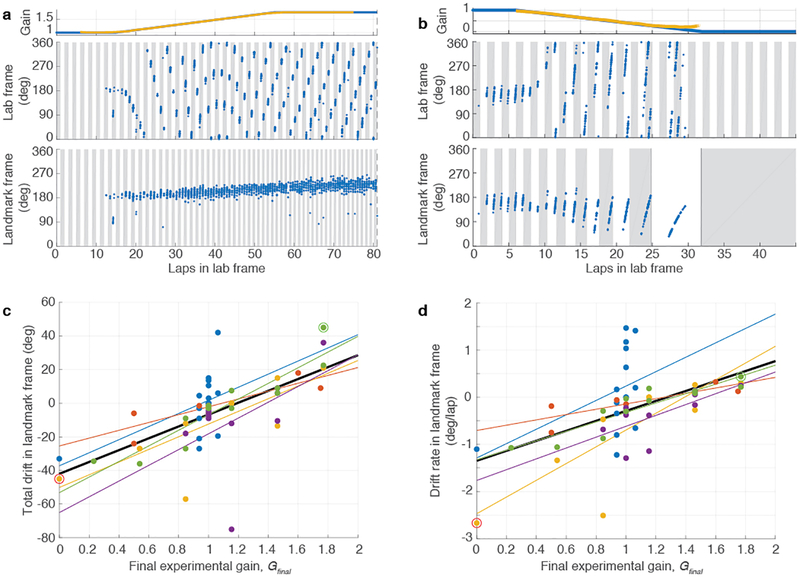
Extended Data Figure 5: Slow drift of place fields against landmarks.
a, Example of positive drift. (top) Experimental gain, G (blue), and hippocampal gain, H (yellow), for Epochs 1–3 of a session in which Gfinal was 1.769. There is no H (yellow) in the first or last 6 laps due to the 12-lap sliding window. (middle) Spikes from one putative pyramidal cell (blue dots) in the lab frame. Figure format is the same as in Figure 2. (bottom) The same spikes in the landmark frame. The unit was silent for the first 12 laps but developed a strong place field in the landmark frame that slowly drifted in the same direction as the animal’s movement over the course of the session. b, Example of negative drift from a session in which the Gfinal was 0. In the landmark frame, the slow drift was in the direction opposite to the animal’s movement direction. Note that the unit was completely silent in Epoch 3, because the rat was not in the place field of the unit as G reached 0. c, Drift over the entire session vs. Gfinal. Each point represents an experimental session. Linear fits are shown for each individual rat (colored lines) and for the combined data (black line; n = 55 sessions, Pearson’s r53 = 0.64, p = 1.5 × 10⁻⁷). The two example sessions of (a) and (b) are shown with the circled markers. d, Drift rate vs. Gfinal. Although the magnitude of drift is correlated with the final experimental gain (Gfinal), as shown in (c), a confound is present because the ramp duration in Epoch 2 depends on the value of Gfinal (e.g., for G > 1, the larger Gfinal is, the more laps required to ramp G up to that value). It is thus possible that the correlation between the total drift and Gfinal is due to the differences in Epoch 2 duration (and, in some experiments, Epoch 3 duration) rather than due to different rates of drift that depend on G. To control for the effect of trial duration, we calculated drift rate by dividing the total drift by the total number of laps in the landmark frame over which the drift was computed. Linear fits are shown for each individual rat (colored lines) and for the combined data (black line; n = 55 sessions, Pearson’s r53 = 0.54, p = 1.9 × 10⁻⁵). The two example sessions of (a) and (b) are shown with the circled markers. These results show that the drift rate was related to the value of Gfinal.
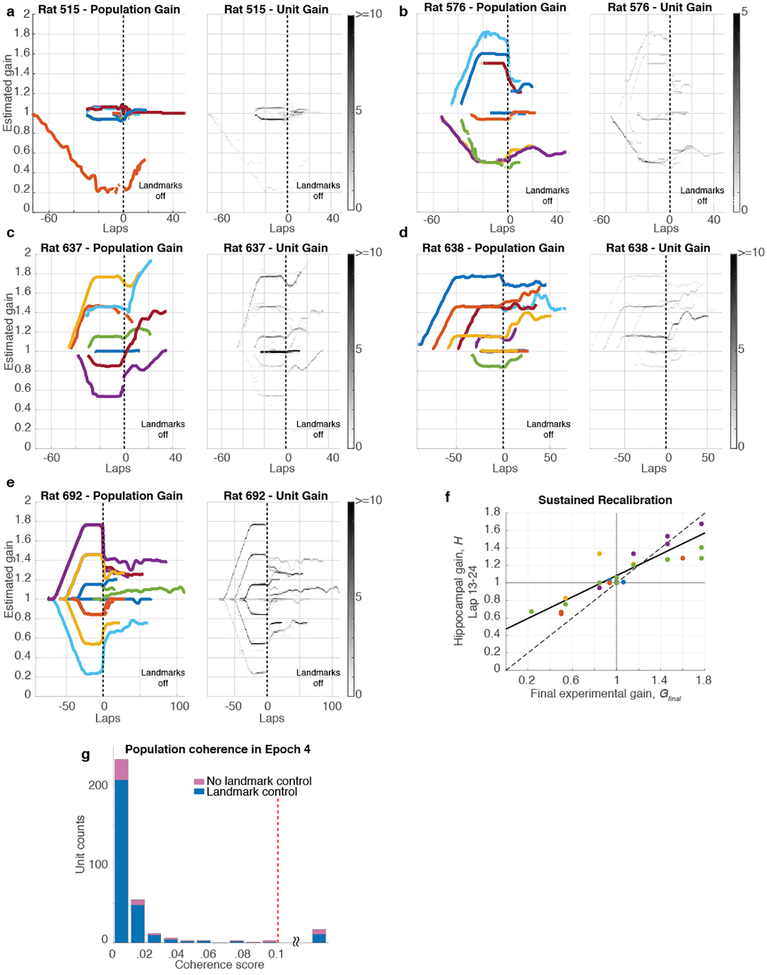
Extended Data Figure 6: Dynamics of recalibration.
a-e. The complete hippocampal gain (H) dynamics for all 5 rats for trials that exhibited landmark control. (The gain dynamics for Rat 692 is also shown in the main text, Fig. 3e.) In the left panels for each rat (color), H is plotted as a function of laps run in the lab frame. Sessions are aligned to the instant when the landmarks were turned off (denoted as lap 0). In the presence of landmarks, (before lap 0), the hippocampal gain tracked the experimental gain profiles during a given session (not shown). After the landmarks turned off, the traces largely maintained their recalibrated gain, while also showing some variable drift across experiments. Note that for each rat, for experiments in which G = 1 (i.e., the landmarks did not move), the value of H was close to 1 when the landmarks were extinguished. The right panels for each rat show the gain trajectories of all the units in the dataset. The gray scale represents the number of active cells with gains falling in a given bin (bin size is 5° for laps axis and 0.01 for gain axis). These graphs demonstrate the high degree of coherence of the hippocampal population, as almost all cells shared the same gain with minimal deviation. The light-colored lines that occasionally deviate from the main trajectories arise from the small number of cells with poor spatial tuning or from cells that remapped. In the latter case, because our spectral gain analysis used a window of 12 laps, these remapped cells continued to show artefactual values for the limited number of laps that fall in this window but during which the cell was silent. As can be seen, these exceptions had negligible influence on the median population gain values. f, Sustained recalibration. Comparison of Gfinal (x-axis) and H computed using laps 13–24 (i.e., the value of H at lap 18) after the landmarks were turned off (y-axis). Sessions for each rat are plotted in different colors, along with the perfect recalibration line (dashed line, black) and a linear fit (solid line, black; n = 27 sessions, Pearson’s r25 = 0.85, p = 2.04 × 10⁻⁸). The number of data points is lower than in Fig. 3c because some experiments ended prior to lap 24. g. Histogram of coherence scores (same format as Fig. 2g) for units firing during Epoch 4 (landmarks off). The shape of the histogram is very similar to Fig. 2g. Almost all units had a coherence score below 0.1, indicating that the place fields acted as a coherent population in sessions with (blue) and without (pink) landmark control in Epochs 1–3, even after landmarks were turned off. Units with coherence score above 0.1 (range 0.11 – 0.41) were combined in a single bin (17/336 units).
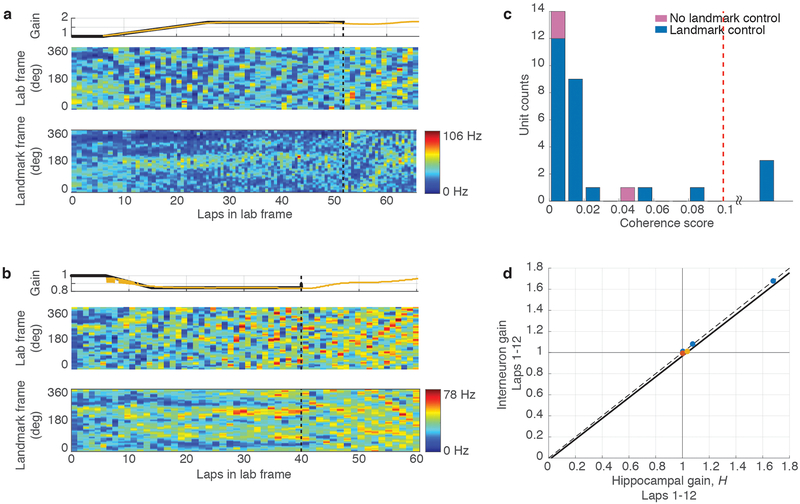
Extended Data Figure 7: Path integration gain recalibration is also demonstrated by hippocampal interneurons.
a, (top) Experimental gain, G (black) and hippocampal gain, H (yellow) for Epochs 1–4 of a session where the Gfinal was 1.769. H was computed as usual from putative pyramidal cells (Methods, Estimation of Hippocampal Gain). In Epoch 4, landmarks are off and hence there is no G. (middle) Spatiotemporal rate map of one putative interneuron in the lab frame. Due to the high firing rate of interneurons, rate maps are more illustrative than the spike plots used in place cell examples. Each horizontal bin represents a lap in the lab frame, similar to the alternating gray and white vertical bands in the place cell examples (e.g. Fig. 2 a,c,e). Each vertical bin spans 3° in the lab frame. (bottom) Rate map of the same unit in the landmark frame. Each horizontal bin represents a lap in landmark frame, and each vertical band spans 3° in landmark frame. Note that the firing pattern is preserved across laps until Epoch 4, when the landmarks turn off. b, Example of putative interneuron in a session where Gfinal was 0.846. Same format as (a). c, Histogram of coherence score between interneurons and putative pyramidal cells, as in Fig. 2g. The score for each putative interneuron is computed as the mean value of | 1 – I / H | over the entire session, where I is the spectral gain estimated from the interneuron, and H is the hippocampal gain computed as usual from putative pyramidal cells. Units with coherence score above 0.1 (range 0.15–0.24) were combined in a single bin. d, H estimated using the first 12 laps after landmarks were turned off, using the median of estimates from putative pyramidal cells compared to the median of estimates from putative interneurons. There are only 5 data points since these are the subset of sessions in Fig. 3c with simultaneously recorded putative interneurons and place cells.
Extended Data Figure 8: Illustration of spectral decoding scheme.
In the dome, as visual landmarks are presented and moved at an experimental gain G, the rat encounters a particular landmark every 1/G laps (the spatial period). If the place fields fire at the same location in the landmark reference frame, the cell’s firing rate exhibits a spatial frequency of G fields/lap. a, Illustration of place field firing for three values of hippocampal gain, H. b, Data from a session in which G was gradually increased from 1 to 3 (top) as in Epoch 2 of our experiments. The spectrogram of one unit is shown at the bottom, with the color denoting the power at a given position and frequency. A clear set of peaks in the spectrogram emerges at spatial frequencies corresponding to the experimental gain and at its harmonics. We use a custom algorithm to trace these peaks (Methods, Estimation of Hippocampal gain) and estimate the gain for each unit. The hippocampal gain, H, is estimated by taking the median spatial frequency across all isolated units (Hi for the ith unit) for a given session. Note that this method does not require that cells display single, sharply tuned place fields, as it works for cells with multiple fields as well as for interneurons (Extended Data Fig. 7). c, Reproduction of Fig. 3b, along with addition panel at the bottom that represents the same spikes in the “hippocampal frame;” that is, the spikes were plotted in the frame of the landmarks as if they were rotating at the calculated gain of the place cell map (the hippocampal gain, H). The shaded vertical bars denote each lap in the hippocampal frame. Fields from all three units are horizontally aligned in this panel during all epochs, indicating that the spectral decoding technique was successful and that the place fields acted as a coherent spatial representation within the hippocampal frame. d, Reproduction of Extended Data Fig. 2a, along with additional hippocampal gain panel at bottom. In this dataset, it can be seen that even after ‘failure’ of landmark control of place fields, the fields are still coherently firing at the same hippocampal gain, which we are able to estimate using spectral decoding.
Extended Data Table 1:
Results of behavioral analyses
| Mean vel (°/sec) | Pauses/lap | Pause Duration (s) | Interpause Interval (s) | Interpause Distance (°) | Gfinal | |
|---|---|---|---|---|---|---|
| Mean (S.E.M.) | ||||||
| Epoch 1 | 24.6 (0.7) | 0.9 (0.2) | 8.8 (1.0) | 55.8 (8.2) | 887 (136) | -- |
| Epoch 2 | 25.2 (0.9) | 1.0 (0.1) | 6.5 (0.5) | 61.8 (18.0) | 1119 (399) | -- |
| Epoch 3 | 25.0 (1.0) | 1.5 (0.2) | 8.8 (1.0) | 26.3 (3.5) | 461 (79) | -- |
| Epoch 4 | 24.2 (1.0) | 1.5 (0.3) | 9.2 (0.8) | 34.9 (9.4) | 531 (125) | -- |
| Epochs 3–1 | 0.4 (0.5) | *0.5 (0.2) | 0(1.5) | *−29.6 (7.9) | *−426 (121) | -- |
| Epochs 4–3 | −0.8 (0.4) | 0.1 (0.2) | 0.3 (1.3) | 8.6 (9.8) | 69 (134) | -- |
| Multiple regression | ||||||
| EDOCh 4 - EDOCh 3 | ||||||
| β | −0.01 | 0 | 0 | 0 | 0 | 0.65 |
| S.E. | 0.01 | 0.02 | 0 | 0 | 0 | 0.05 |
| EDOCh 3 - Epoch 1 | ||||||
| β | 0.01 | −0.01 | 0.01 | 0 | 0 | 0.66 |
| S.E. | 0.01 | 0.03 | 0 | 0 | 0 | 0.05 |
Two-sided Wilcoxon Signed Rank tests were performed on the differences between values in Epochs 3 and 1 and Epochs 4 and 3 with null hypothesis that the difference = 0. Pauses/lap (n = 37 sessions; p = 0.035); Interpause Interval (n = 37 sessions; p = 0.001); Interpause Distance (n = 37 sessions; p = 0.003). All other tests for Epochs 3–1 and Epochs 4–3 were not significant
Supplementary Material
Acknowledgments.
We thank Bill Nash and Bill Quinlan for assistance with constructing the apparatus; Marissa Ferreyros, Macauley Breault, Nick Lukish, Jeremy Johnson, Balazs Vagvolgyi and Douglas GoodSmith for technical assistance in running experiments; Geeta Rao, Vyash Puliyadi, Cheng Wang, Heekyung Lee, Robert Nickl, Adrian Haith and Jonathan Bohren for discussions and technical advice. This research was supported by NIH grants R01 MH079511 (HTB, JJK), R21 NS095075 (NJC, JJK), and R01 NS102537 (NJC, JJK, FS), a JHU Discovery Award (NJC, JJK), a JHU Science of Learning Institute Award (JJK, NJC), a JHU Kavli NDI Postdoctoral Distinguished Fellowship (MSM) and a JHU Mechanical Engineering Departmental Fellowship (RPJ).
Footnotes
The authors declare that they have no competing financial or non-financial interests.
References
- 1.O’Keefe J & Nadel L The Hippocampus as a Cognitive Map (Oxford University Press, 1978). [Google Scholar]
- 2.Acharya L et al. Causal Influence of Visual Cues on Hippocampal Article Causal Influence of Visual Cues on Hippocampal Directional Selectivity. Cell 164, 197–207 (2016). [DOI] [PubMed] [Google Scholar]
- 3.Chen G, King J a, Burgess, N. & O’Keefe, J. How vision and movement combine in the hippocampal place code. Proc. Natl. Acad. Sci. U. S. A 110, 378–83 (2013). [DOI] [PMC free article] [PubMed] [Google Scholar]
- 4.Etienne AS & Jeffery KJ Path integration in mammals - Etienne - 2004 - Hippocampus - Wiley Online Library. Hippocampus (2004). at <http://onlinelibrary.wiley.com/doi/10.1002/hipo.10173/full%5Cnpapers2://publication/uuid/BE99CA4B-E84A-4A34-A3F6-D924E35CA5B6> [DOI] [PubMed] [Google Scholar]
- 5.Wehner R & Menzel R Do Insects Have Cognitive Maps? Annu. Rev. Neurosci 13, 403–414 (1990). [DOI] [PubMed] [Google Scholar]
- 6.Wittlinger M, Wehner R & Wolf H The ant odometer: Stepping on stilts and stumps. Science (80-.) 312, 1965–1967 (2006). [DOI] [PubMed] [Google Scholar]
- 7.Mittelstaedt ML & Mittelstaedt H Homing by path integration in a mammal. Naturwissenschaften 67, 566–567 (1980). [Google Scholar]
- 8.Gallistel CR The organization of learning Cambridge: Bradford Books / MIT Press; (1990). [Google Scholar]
- 9.Samsonovich a & McNaughton BL. Path integration and cognitive mapping in a continuous attractor neural network model. J. Neurosci 17, 5900–5920 (1997). [DOI] [PMC free article] [PubMed] [Google Scholar]
- 10.Fuhs MC & Touretzky DS A spin glass model of path integration in rat medial entorhinal cortex. J. Neurosci 26, 4266–4276 (2006). [DOI] [PMC free article] [PubMed] [Google Scholar]
- 11.McNaughton BL, Battaglia FP, Jensen O, Moser EI & Moser MB Path integration and the neural basis of the ‘cognitive map’. Nat Rev Neurosci 7, 663–78 (2006). [DOI] [PubMed] [Google Scholar]
- 12.Hasselmo ME, Giocomo LM & Zilli EA Grid cell firing may arise from interference of theta frequency membrane potential oscillations in single neurons. Hippocampus 17, 1252–1271 (2007). [DOI] [PMC free article] [PubMed] [Google Scholar]
- 13.Blair HT, Gupta K & Zhang K Conversion of a phase- to a rate-coded position signal by a three-stage model of theta cells, grid cells, and place cells. Hippocampus 18, 1239–55 (2008). [DOI] [PMC free article] [PubMed] [Google Scholar]
- 14.Burgess N, Barry C & O’Keefe J An oscillatory interference model of grid cell firing. Hippocampus 812, 801–812 (2007). [DOI] [PMC free article] [PubMed] [Google Scholar]
- 15.Tcheang L, Bulthoff HH & Burgess N Visual influence on path integration in darkness indicates a multimodal representation of large-scale space. Proc. Natl. Acad. Sci 108, 1152–1157 (2011). [DOI] [PMC free article] [PubMed] [Google Scholar]
- 16.Knierim JJ, Kudrimoti HS & McNaughton BL Interactions Between Idiothetic Cues and External Landmarks in the Control of Place Cells and Head Direction Cells. J. Neurophysiol 80, 425–446 (1998). [DOI] [PubMed] [Google Scholar]
- 17.Zugaro MB, Arleo A, Berthoz A & Wiener SI Rapid spatial reorientation and head direction cells. J. Neurosci 23, 3478–3482 (2003). [DOI] [PMC free article] [PubMed] [Google Scholar]
- 18.Hardcastle K, Ganguli S & Giocomo LM Environmental Boundaries as an Error Correction Mechanism for Grid Cells. Neuron 86, 827–839 (2015). [DOI] [PubMed] [Google Scholar]
- 19.Etienne AS, Maurer R & Séguinot V Path integration in mammals and its interaction with visual landmarks. J. Exp. Biol 199, 201–209 (1996). [DOI] [PubMed] [Google Scholar]
- 20.Moser EI, Moser M-B & McNaughton BL Spatial representation in the hippocampal formation: a history. Nat. Neurosci 20, 1448–1464 (2017). [DOI] [PubMed] [Google Scholar]
- 21.Gil M et al. Impaired path integration in mice with disrupted grid cell firing. Nat. Neurosci 21, 81–93 (2018). [DOI] [PubMed] [Google Scholar]
- 22.Tennant SA et al. Stellate Cells in the Medial Entorhinal Cortex Are Required for Spatial Learning. Cell Rep 22, 1313–1324 (2018). [DOI] [PMC free article] [PubMed] [Google Scholar]
- 23.Hölscher C, Schnee A, Dahmen H, Setia L & Mallot HA Rats are able to navigate in virtual environments. J. Exp. Biol 208, 561–9 (2005). [DOI] [PubMed] [Google Scholar]
- 24.Harvey CD, Collman F, Dombeck DA & Tank DW Intracellular dynamics of hippocampal place cells during virtual navigation. Nature 461, 941–946 (2009). [DOI] [PMC free article] [PubMed] [Google Scholar]
- 25.Ravassard P et al. Multisensory Control of Hippocampal Spatiotemporal Selectivity. Science 1–7 (2013). doi: 10.1126/science.1232655 [DOI] [PMC free article] [PubMed] [Google Scholar]
- 26.Bastian AJ Learning to predict the future: the cerebellum adapts feedforward movement control. Curr. Opin. Neurobiol 16, 645–649 (2006). [DOI] [PubMed] [Google Scholar]
- 27.Miles FA & Lisberger SG Plasticity in the vestibulo-ocular reflex: a new hypothesis. Annu. Rev. Neurosci 4, 273–99 (1981). [DOI] [PubMed] [Google Scholar]
- 28.Etienne a S., Maurer R & Séguinot V. Path integration in mammals and its interaction with visual landmarks. J. Exp. Biol 199, 201–9 (1996). [DOI] [PubMed] [Google Scholar]
- 29.Terrazas A et al. Self-motion and the hippocampal spatial metric. J. Neurosci 25, 8085–96 (2005). [DOI] [PMC free article] [PubMed] [Google Scholar]
- 30.Maurer AP, VanRhoads SR, Sutherland GR, Lipa P & McNaughton BL Self-motion and the origin of differential spatial scaling along the septo-temporal axis of the hippocampus. Hippocampus 15, 841–852 (2005). [DOI] [PubMed] [Google Scholar]
- 31.Cullen KE & Taube JS Our sense of direction: Progress, controversies and challenges. Nat. Neurosci 20, 1465–1473 (2017). [DOI] [PMC free article] [PubMed] [Google Scholar]
- 32.Kropff E, Carmichael JE, Moser M-B & Moser EI Speed cells in the medial entorhinal cortex. Nature 523, 419–424 (2015). [DOI] [PubMed] [Google Scholar]
- 33.Hinman JR, Brandon MP, Climer JR, Chapman GW & Hasselmo ME Multiple Running Speed Signals in Medial Entorhinal Cortex. Neuron 91, 666–679 (2016). [DOI] [PMC free article] [PubMed] [Google Scholar]
Associated Data
This section collects any data citations, data availability statements, or supplementary materials included in this article.


