

Abstract
This study explored distinct perceptual and decisional contributions to spam email mental construal. Participants classified spam emails according to pairings of three stimulus features – presence or absence of awkward prose, abnormal message structure, and implausible premise. We examined dimensional interactions within general recognition theory (GRT; a multidimensional extension of signal detection theory). Classification accuracy was highest for categories containing either two non-normal dimension levels (e.g., awkward prose and implausible premise) or two normal dimension levels (e.g., normal prose and plausible premise). Modelling indicated both perceptual and decisional contributions to classification responding. In most cases perceptual discriminability was higher along one dimension when stimuli contained a non-normal level of the paired dimension (e.g., prose discriminability was higher with abnormal structure). Similarly, decision criteria along one dimension were biased in favour of the non-normal response when stimuli contained a non-normal level of the paired dimension. Potential applications for training are discussed.
Keywords: spam email, spam features, spam judgment, spam attention, phishing judgment
Practitioner Summary:
We applied general recognition theory (i.e., multivariate signal detection theory) to spam email classification at low or high levels of three stimulus dimensions: premise plausibility, prose quality, and email structure. Relevant to training, this approach helped identify perceptual and decisional biases that could be leveraged to individualise training.
Introduction
Email users commonly sort through dozens of messages a day, judging legitimacy based on observable features. Emails often have a variety of characteristics that make them more or less difficult to classify as problematic (Chandrasekaran, Narayanan, and Upadhyaya 2006; Downs, Holbrook, and Cranor 2006). Features like clickable links or company logos can influence whether a user sends an email to their junk folder or leaves it in their inbox where it has potential for harm. Subjective qualities, such as whether the premise of a message seems plausible, may also play a role in determining which emails are considered illegitimate. For example, an email from a stranger asking for money to save their business in a foreign country seems less plausible than an email from a sibling asking to borrow a car (although it is important to note that low premise plausibility is sometimes deliberately used as a strategy to filter all but the most credulous email users, e.g., Herley 2012).
The current research focused on the psychological basis for classifying spam or phishing emails. Spam is commonly defined as unsolicited bulk emails. Phishing is more insidious, often including overt or covert requests for data which can lead to theft. As statistical filters improve, spammers learn techniques to circumvent them, thus leaving some of the burden on email recipients. Lowd and Meek (2005) assessed the effectiveness of filters against ‘good word’ attacks, or spam messages loaded with extra words common to legitimate emails. They show frequent retraining is the only way to keep filters viable. Other researchers have focused on machine learning in their efforts to support cybersecurity (Hayden 2015; Wu et al. 2005; Youn and McLeod 2007). However, filters – thorough as they may be – will not catch every spam email. Users must have their own understanding of spam in order to combat the issue.
Robila and Ragucci (2006) focused on spam and phishing education as they taught students about illegitimate email characteristics. Their research indicates teaching undergraduate students to recognise illegitimate emails improves ability to correctly identify spam and phishing in an ecologically valid setting. Jagatic et al. (2007) also focused on education after they investigated how social networks could be used as a hook for phishing. They targeted students using publicly available social networking information about those students. Most students were lured in by the phishing scheme, which prompted the researchers to provide education on how to detect phishing emails. Ferguson (2005) conducted an experiment to show how fraudulent emails are a problem even for trained individuals. Cadets at West Point had training to detect illegitimate emails as part of their student requirements, but this did not prevent them from falling victim to phishing emails. Aside from offline training, a common approach to increase vigilance and provide continuous learning reinforcement is the use of online services for embedded training that sends simulated phishing emails, providing recipients with error feedback in real-time if they respond inappropriately to these lures. For example, Kumaraguru et al.(2010) found that embedded training led to significantly higher accuracy at identifying phishing emails compared to non-embedded training, and that this difference persisted over time (at least a week).
Surveys conducted by Grimes, Hough, and Signorella (2007) indicate there is little action users are willing or able to take against the problem. Though some users are quick to move illegitimate emails to their junk folder, many do not even take this small step. This may be caused by unwillingness to interact with the email, perhaps due to uncertainty regarding predictive spam and phishing features.
In order to improve cybercrime prevention training, an understanding of the mental construal of spam email features by recipients would be valuable. To what extent are recipients influenced by individual features? In what ways might multiple features interact in the minds of observers? To explore these questions, we factorially combined the presence or absence of three features typical of spam emails in order to see how their interaction might influence assessment. The qualities were presence or absence of awkward prose, abnormal structure, or implausible premise. These dimensions were selected because they are commonly found in spam email messages, but also because they are well-suited to exploration within our model-based approach to research (detailed below). A large number of spam email features have appeared in the cybersecurity research literature and could have been selected for study. Examples include messages urging a quick response, use of company logos, the presence of links for downloading content, collection of personal information, warnings about threat to security or account suspension, and spelling or grammatical errors, to name a few. The dimensions evaluated here are not meant to represent these other common features. Rather, our goal was to select features that are known to characterise many spam email messages in order to examine the potential of our analytic approach to provide new insights into spam email judgements.
Psychological Dimensions of Spam
Awkward Prose
Awkward prose is defined as any text that does not fit standard grammatical and lexical forms (e.g., Figure 1, top). Awkward prose is not unique but can be a hallmark of spam emails. Spam filters often identify grammatical or lexical errors or search for particular words (Bergholz et al. 2010). However, text searches are often only useful for spam and not phishing (Fette, Sadeh, and Tomasic 2007). Moreover, human observers tend to be better than machines at discerning whether prose is awkward or not. Although subjective, such a determination is based on aspects of the text appearing in an email message and thus likely produce relatively consistent judgements of awkwardness among observers.
Figure 1.


Sample email messages displaying at least one non-normal dimension. Top: awkward prose; Middle: abnormal structure; Bottom: implausible premise.
Abnormal Structure
Abnormal structure is represented by both the visible shape of email and by text formatting (e.g., oddly shaped blocks of text, overly long lines, too many indentations, overly brief emails; e.g., Figure 1, middle). For example, a normal advertisement email will typically look like a digital flyer, while an email with abnormal structure may contain too many indentations or be unusually brief. Abnormal structure may provide a cue to be suspicious of legitimacy.
Premise Plausibility
Legitimate emails tend to have a plausible premise, which can be as simple as an advertisement or as elaborate as a personal letter. Phishers often keep their premises plausible by emulating messages from financial organisations (Drake, Oliver, and Koontz 2004). An implausible premise is easily identifiable when the email contains a wildly unlikely situation (e.g., see Figure 1, bottom), such as an anonymous person claiming to be a prince in jeopardy who needs financial support (although even this premise has been known to fool recipients). Again, determining a premise is plausible or not is a subjective determination on the part of the email recipient. However, there is likely to be a high degree of consistency among observers in the interpretation of plausibility of scenarios presented in an email message.
Urgency to respond and extreme benefit to the recipient are also common ploys used by phishers, which can reduce premise plausibility (e.g., Figure 1, bottom), especially when keywords common to phishers are used (Chandrasekaran, Narayanan, and Upadhyaya 2006). Vishwanath et al. 2011 provided evidence that urgency may increase susceptibility by distracting attention from other plausibility-reducing features. We consider this possibility in more detail in the Discussion.
Examining Psychological Representation with General Recognition Theory
In the current study, we examined psychological representation of emails along the dimensions summarised above: prose (awkward or not), structure (abnormal or not), and premise plausibility (implausible or not). Specifically, we examined perceptual (in terms of mental construal) and decisional interactions of these dimensions within a popular theory of categorisation known as general recognition theory.
General recognition theory (GRT; Ashby and Townsend 1986) extends signal detection theory (SDT; Macmillan and Creelman 2004) to the multivariate case. Both theories account for the psychological representation of stimuli that underlies choice behaviour. Traditional SDT collapses information about stimulus dimensions onto a single psychological scale, which is then used to make determinations about category discriminability (d’) and decision response bias (β) toward one category response or other. For example, in cybersecurity research, signal detection theory has been used to identify difference between detecting versus taking action on ability to discriminate between phishing and non-phishing emails, and to examine individual differences in decision bias (Canfield, Fischhoff, and Davis 2016; Mayhorn and Nyeste, 2012; Parsons, McCormac, Pattinson, Butavicius, & Jerram, 2013).
By modelling variation along multiple distinct stimulus dimensions GRT provides additional insight into interactions in terms of perception and decision rule adoption. A common approach to GRT research is to examine interactions between two stimulus dimensions (e.g., tone pitch and volume), by having participants learn to distinguish between four categories derived from factorial combination of two levels along each dimension (see Figure 2). For example, GRT has been applied to study interaction between stimulus dimensions related to sexual interest cues in photographs (Farris, Viken, and Treat 2010), combination of data types in sensor fusion images (McCarley and Krebs 2006), and between facial features and emotional expression in relation to racial bias judgements (Kleider-Offutt et al. 2018).
Figure 2.
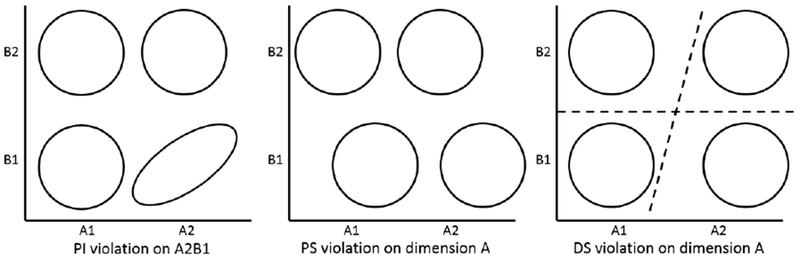
Hypothetical contours of equal likelihood from factorial combination of features along two dimensions.
The left panel shows a violation of PI because there is a nonzero covariance within a category. The middle panel shows a violation of PS along the A dimension due to a difference in perceptual effects at levels B1 and B2. The right panel depicts a violation of DS along dimension A since the decision bound is not orthogonal to the coordinate axes.
Interaction between dimensions can be evaluated at the level of individual categories or across several categories. There are three primary measures of interaction in GRT. Two of these pertain to perception or psychological representation of the categories and one pertains to categorisation decisions based on this psychological representation. The ellipses in Figure 2 illustrate how categories are perceived along two stimulus dimensions. The width of each ellipse represents variability in the perception of the category. In each panel, four categories result from factorial combination of two levels of each dimension. For example, the horizontal dimension (A) could represent perception of a low or high pitch tone, while the vertical dimension (B) could represent perception of low or high stimulus volume. In the left panel of Figure 2, the noncircular ellipse shows a positive correlation between pitch and volume perception within one category. For the remaining categories, the circular contours imply perceptual independence (PI). Within these three categories perceived pitch and volume do not interact.
In the middle panel of Figure 2, PI holds for each individual category. But there is perceptual interaction between dimensions across categories. Specifically, perceived values along dimension A are higher when paired with the lower level of dimension B. Continuing the previous example, this would indicate that pitch is perceived as higher in frequency when paired with lower levels of dimension B. This sort of perceptual interaction is termed a violation of perceptual separability (PS). In the middle panel of Figure 2, PS is violated along dimension A (perception of A depends on level of B) but PS holds (is not violated) along dimension B.
Finally, decisional separability (DS) refers to interactions between dimensions in terms of the decision bounds separating the space into response regions. This is the multivariate analogue of the decision criterion, β, in signal detection theory. DS holds when the criterion used to separate categories along one dimension is the same at both levels of the other dimension (in the 2D case). Figure 2 (right panel) shows a violation of DS along dimension A, while DS holds along dimension B. In this example, although there is no perceptual interaction at all between the dimensions pitch and volume, classification responding would be biased toward the A2 response (high pitch) for stimuli presented at B1 (low volume), and responding would favour the A1 response at B2. This dimensional interaction is reflected in the angle of the decision bound on dimension A, indicating that response bias is the result of decisions about the stimulus categories rather than perception of the stimulus categories.
Current Study
The intent of the current study was to apply GRT to participants’ classification of spam emails. These emails varied systematically along dimensions of prose awkwardness, abnormality of email structure, and plausibility of email premise. Testing for dimensional interactions at perceptual and decisional levels with these categories provides insight into how individuals mentally construe threat cues in email.
We generated three sets of spam email categories. Each set contained four categories created by factorially combining binary levels of two stimulus dimensions (e.g., low/high premise plausibility by normal/abnormal structure). Although these features can appear in legitimate emails, the task required classifying emails according to these stimulus dimensions in order to facilitate model-based understanding of feature interactions (rather than classifying stimuli as spam or not-spam). We included only spam emails to focus participants’ attention to this aspect of email processing. Our findings should be corroborated in future work that includes non-spam emails as well.
Each participant completed three blocks of classification (without training feedback), each block containing categories generated from a different pairing of dimensions. Our research goal was largely exploratory, using GRT analysis to examine how dimensions interact at perceptual and decisional levels, and whether systematic differences were observable under different dimension pairings. Note that by ‘perception,’ in this study we are referring to psychometrically ordered (e.g., low or high) mental representation along subjective dimensions like premise plausibility (as is common in signal detection studies).
Method
Participants
Participants consisted of 111 University of Central Florida undergraduate students (another six participants failed to finish the study). All of the students received course credit and self-identified their age (Range = 18-48; Mean = 20.2; Median = 19 years), gender (66 female, 44 male), and race (48 Caucasian, 32 Hispanic, 31 other race). Participants were recruited from undergraduate psychology courses and completed the study online, using Qualtrics (Qualtrics, Provo, UT). The median time to complete the experiment was 56 minutes.
Stimuli
The stimuli were assembled from the researchers’ spam folders or obtained via web search. An initial set of 200 spam emails was created, including both hazardous (e.g., phishing) and benign (non-phishing) messages. The emails were representative of a typical inbox, comprising advertisements, social media, banking, personal, and shipping confirmations.
Each email was given a binary rating (0=absent, 1=present) along the dimensions ‘implausible premise,’ ‘awkward prose,’ and ‘abnormal structure’ by two raters (DS and JL) from our laboratory (other dimensions were rated but were not a part of the current study). When the raters disagreed they discussed the email to see if they could agree, and if not they assigned a rating of .5 for that feature. Categories generally included stimuli with 0 or 1 ratings along each dimension. However, due to the limited number of stimuli the plausible premise/normal structure category included 11 stimuli rated .5 (instead of 0) on structure. The normal prose/normal structure category contained one stimulus rated .5 (instead of 0) on structure, and the implausible premise/awkward prose category contained two stimuli rated .5 (instead of 1) on prose. This did not appear to influence our results, as indicated by the consistent pattern appearing across blocks in terms of classification accuracy and model-based conclusions (e.g., see Figure 3 and Table 1).
Figure 3.

Classification accuracy on each category from the dimension pairings used in the experiment.
Error bars show standard error of the mean.
Table 1.
Summary of GRT results (~ indicates a violation of PS, DS, or PI)
| Prose x Structure |
| ~PS Prose: Prose levels more discriminable with abnormal structure |
| ~PS Structure: Structure levels more discriminable with awkward prose |
| ~DS Prose: ‘Awkward prose’ response more likely with abnormal structure |
| ~DS Structure: ‘Abnormal structure’ response more likely with awkward prose |
| PI: dimensions not significantly correlated within categories |
| Premise x Prose |
| ~PS Premise: Premise levels more discriminable with awkward prose |
| ~PS Prose: Prose level discriminability not affected by implausible premise |
| ~DS Premise: ‘Implausible premise’ response more likely with awkward prose |
| ~DS Prose: ‘Awkward prose’ response more likely with implausible premise |
| ~PI: In ‘Normal Prose’-level categories, positive correlation between perceived premise implausibility and prose awkwardness |
| Premise x Structure |
| ~PS Premise: Premise levels more discriminable with abnormal structure |
| ~PS Structure: Structure levels more discriminable with implausible premise |
| ~DS Premise: ‘Implausible premise’ response more likely with abnormal structure |
| ~DS Structure: ‘Abnormal structure’ response more likely with implausible premise |
| ~PI: Positive correlation between perceived premise implausibility and structure abnormality |
The three dimensions used in the current study were selected because they were subjective in nature (to foster variability in participants’ mental construal). Furthermore, two dimensions – premise plausibility and awkward prose – had precedent in the literature (as discussed in the Introduction). The third dimension used – abnormal structure – has (to our knowledge) not been discussed in the literature but rather was a recurring dimension noticed by our raters (see description in Introduction). Figure 1 contains examples of the non-normal level for each dimension.
In the current study, prose, structure, and premise-plausibility were factorially combined with each other to form three sets of 4 categories each. Each category contained twenty images, resulting in eighty total images per dimension pairing. Images could re-occur across dimension pairings (e.g., an image with awkward prose and normal structure could also be a member of a category with normal structure and plausible premise). We attempted to evenly distribute emails across the third (unexamined) dimension for each pairing. For the prose and structure pairing, premise plausibility was rated as ‘implausible’ in 34 cases, ‘plausible’ in 35 cases, and ‘undecided’ in 11 cases. For the premise and prose pairing, structure was rated as ‘normal,’ ‘abnormal,’ or ‘undecided’ in 21, 43, and 16 cases, respectively. For the premise and structure pairing, prose was rated as ‘normal,’ ‘awkward,’ or ‘undecided’ in 33, 33, and 14 cases.
Procedure
After providing informed consent, participants completed the experiment online using their own computer and at their own pace. They were instructed to complete the study in one sitting and to make decisions carefully.
Each participant completed three blocks of categorisation trials, with each block reflecting the dimension pairings described above. The order of the blocks was the same for each participant, as described above. The order of the 80 stimuli (20 per category) within each block were randomised, and this randomisation was used for all participants.
A typical trial consisted of the presentation of an image and two questions. Questions in the first block were ‘Is the prose in this email awkward? Yes/No’ and ‘Does this email have an abnormal structure? Yes/No.’ In the second block, the questions were ‘Does this email have a plausible premise? Yes/No’ and ‘Is the prose in this email awkward? Yes/No.’ In the third block, the questions were ‘Does this email have a plausible premise? Yes/No’ and ‘Does this email have an abnormal structure? Yes/No.’ Participants had as long as they wished to select each response. There was no feedback provided after responses. Rather, the screen containing the email and the two response options was immediately replaced by the next email and response options, indicating that the experiment had advanced to the next trial. We opted not to provide accuracy feedback so as to understand participants’ unaltered perception of the stimuli.
Data Analysis
GRT analysis was carried out in R/RStudio (R Core Team 2016; RStudio Team 2016) using the grtools package developed by Soto et al. (2017). We used a recently developed method called GRT with individual differences (GRT-wIND) that accounts for each participant’s classification responses by estimating model parameters describing the underlying perceptual distributions and decision bounds that predict categorisation response rates.
The model estimates parameters to approximate a mental representation for each category (two means, two variances, and one covariance per category; see Figure 2) assumed to be shared by all participants. Individual differences in mental representation are captured with two additional parameters that are estimated for each participant, i. The first parameter, κi, is a global scaling parameter that stretches or shrinks all estimated category variances for each individual participant (κi > 0). This scaled space reflects the degree of attention that the participant paid to the task, with larger values of κi corresponding to smaller variance on all categories and thus higher discriminability between categories. The second individual difference parameter, λi, scales the variances along each dimension to reflect relative weighting of the two stimulus dimensions (0 < λi < 1). For example, values of λi > .5 reflect higher discriminability along the horizontal-axis dimension than along the vertical axis dimension (see Figure 2). Finally, individual differences in decision bound placement are modelled by estimating two slope and two intercept parameters; one each to describe the vertical and horizontal bounds used by each participant.
Several versions of the model are fit to the data, each predicting classification responses by placing different constraints on the parameters to reflect violations of DS, PS, and/or PI. Likelihood ratio tests based on the fit values for each model indicate the most parsimonious account of responding. Additional technical details related to GRT-wIND analysis can be found in Soto et al. (2015).
Results
Inclusion Criteria and Time on Task
Participants’ data were included in analysis based on the following criteria (inclusion was determined separately for each block). First, the participant had to have given each of the four category responses at least once. This eliminated participants who repeatedly pressed the same key, which suggests a lack of attentiveness to the task. Second, overall classification accuracy had to be greater than 25%. This is the accuracy rate that would occur if the participant were responding randomly. Random responding would be indicative of a lack of effort in the task and would convey no useful information for our model-based analysis. Although the current study was not a training study (i.e., no feedback was provided), the results below clearly indicate that most participants responded well above chance accuracy. These criteria were selected a priori, so data not meeting these requirements were not analysed. As a result, accuracy and GRT analysis were conducted for 98, 82, and 88 (88%, 74%, and 79% of total participants, respectively) data sets in the prose/structure, premise/prose, and premise/structure dimensional pairings, respectively.
Participants got faster at the classification task as they progressed through the three blocks of trials, F(2,100) = 14.18, p < .001, η2p = .22. Average time per trial in block one (M = 21.65 seconds, SD = 22.23) was greater than in block two (M = 11.28 seconds, SD = 6.04), t(50) = 3.10, p < .005, and average time per trial in block two was greater than in block three (M = 8.66 seconds, SD = 4.39), t(50) = 4.70, p < .001. Outliers (defined as average trial duration greater than 2 SD above the mean for each block) were omitted (two, four, and four participants from blocks one to three, respectively) from this analysis of time on task. However, because they otherwise met our inclusion criteria, these participants were retained for all remaining analyses.
Classification Accuracy
Average classification accuracy for each pairing of dimensions is summarised in Figure 3. A classification response was considered correct if it matched the category label assigned to that stimulus based on the rating task described in the Stimulus section. Accuracy rates reflect the proportion of responses matching the category label for the 20 stimuli comprising each category.
For each pair of dimensions, we conducted a within-factor ANOVA with two levels (normal, non-normal) of each independent variable (prose, structure, premise-plausibility), and with accuracy as the dependent variable. Each pairing resulted in a significant interaction: prose-by-structure: F(1, 97) = 11.94, p < .001, η2p = .80; premise-by-prose: F(1, 81) = 162.90, p < .001, η2p = .67; premise-by-structure: F(1, 87) = 173.68, p < .001, η2p = .67. In every case, accuracy was highest when either both dimensions were at the normal (e.g., normal prose, normal structure) or non-normal level (e.g., awkward prose, abnormal structure). Accuracy was consistently lower whenever a normal-level feature was paired with a non-normal feature (e.g., normal prose, abnormal structure).
There was only one significant main effect. When collapsed over levels of structure (normal, abnormal), accuracy was significantly higher for classification of awkward prose (M = 36%, SD = 12%) than for normal prose (M = 32%, SD = 12%), F(1, 97) = 5.77, p = .02, η2p = .06. All other p-values > .07. There was no evidence of fatigue or vigilance decrement in the task, as indicated by the similar average accuracy over blocks, F(2,220) = .72, p = .49, η2p = .006 (see Figure 3).
GRT Analysis
We fit the GRT-wIND model to the classification response frequencies for each category separately for the prose/structure, premise/prose, and premise/structure dimension pairings. In each case the model fit the data well, accounting for 89%, 93%, and 91% of classification responses, respectively (based on model R2 values). Table 1 summarises the major trends detailed below.
The median κi parameter estimate was 2.05, 1.87, and 1.76, and the median λi estimate was .56, .37, and .52, respectively across blocks. There was no significant difference in κi values across blocks, F(2,128) = .54, p = .58, η2p = .01. The difference between λi values across blocks approached significance, F(2,128) = 2.90, p = .06, η2p = .04, due to the difference between blocks one (prose/structure) and two (premise/prose), t(64) = 2.20, p = .09. However, we were less interested in the size of λi parameter estimates than in the proportion of participants characterised by values larger or smaller than .5 (which reflects equal weighting of stimulus dimensions). Based on Χ2 tests, the only significant dimension-weighting bias was in the premise/prose pairing, where more participants attended to the awkward prose dimension (n = 50) than to the premise plausibility dimension (n = 32), Χ2(1) = 3.95, p < .05 (all other Χ2 p-values > .23).
Prose and Structure
For the prose-by-structure categories, PS was violated along both dimensions. In terms of distance between category means (see Figure 4), perceptual discriminability was higher for prose awkwardness (horizontal brackets) in the abnormal structure categories, Χ2(4) = 512.49, p < .001, and discriminability was higher for structure abnormality (vertical brackets) when prose was awkward, Χ2(4) = 239.96, p < .001.
Figure 4.

Best-fitting configuration of perceptual distributions from block 1 (Prose x Structure) trials.
Ellipses are contours of equal likelihood. Symbols represent category means, and brackets indicate distance between category means within perceptual space. NL = normal, AW = awkward, AB = abnormal. In the legend, the dimension on the x-axis (prose) is listed first in the ordered pairs. The dimension on the y-axis (structure) is listed second in the ordered pairs. Filled shapes represent a higher (non-normal) level on the y-axis, while triangles represent a higher (non-normal) level on the x-axis.
There was also a violation of DS along both dimensions when prose and structure were paired. When deciding if stimuli contained normal or awkward prose, participants were more likely to give the ‘awkward’ response for stimuli from the abnormal structure categories, Χ2(98) = 1746.53, p < .001 (average decision bound slope was 12 degrees counterclockwise from vertical). When deciding if stimuli contained normal or abnormal structure, participants were more likely to give the ‘abnormal’ response for stimuli from the awkward prose categories, Χ2(98) = 2085.23, p < .001 (average slope was 18 degrees clockwise from horizontal).
Within the structure-by-prose categories, covariances were not significantly different from zero, Χ2(4) = 8.44, p = .08. Thus, PI held for this dimension pairing.
Premise and Prose
For the premise-by-prose categories, PS was again violated along both dimensions. In terms of distance between category means (see Figure 5), perceptual discriminability was higher for premise plausibility (horizontal brackets) in the awkward prose categories, Χ2(4) = 36.46, p < .001. Along the prose dimension, discriminability did not differ across levels of premise plausibility. However, as shown by the upward shift in category means on the right side of Figure 5, the perception of prose awkwardness was higher when paired with an implausible premise – even for stimuli drawn from a ‘normal’ prose category, Χ2(4) = 38.58, p < .001.
Figure 5.

Best-fitting configuration of perceptual distributions from block 2 (Premise x Prose) trials.
Ellipses are contours of equal likelihood. Symbols represent category means, and brackets indicate distance between category means within perceptual space. NL = normal, IM = implausible, AW = awkward. In the legend, the dimension on the x-axis (premise) is listed first in the ordered pairs. The dimension on the y-axis (prose) is listed second in the ordered pairs. Filled shapes represent a higher (non-normal) level on the y-axis, while triangles represent a higher (non-normal) level on the x-axis.
There was a violation of DS along both dimensions when premise and prose were paired. When deciding if stimuli contained a plausible or implausible premise, participants were more likely to give the ‘implausible’ response for stimuli from the awkward prose categories, Χ2(82) = 732.12, p < .001 (average decision bound slope was 17 degrees counterclockwise from vertical). When deciding if stimuli contained normal or awkward prose, participants were more likely to give the ‘awkward’ response for stimuli from the implausible premise categories, Χ2(82) = 1269.54, p < .001 (average slope was 21 degrees clockwise from horizontal).
Within the individual categories, covariance between the premise plausibility and prose dimensions differed significantly from zero. In particular, within the normal prose categories, the more implausible a premise appeared to be the more prose was construed as awkward. This is illustrated by the rightward tilt of the contours for the normal prose categories, reflecting a significant violation of PI, Χ2(4) =13.84, p < .001.
Premise and Structure
For the premise-by-structure categories, PS was violated along both dimensions. In terms of distance between category means (see Figure 6), perceptual discriminability was higher for premise plausibility (horizontal brackets) in the abnormal structure categories, Χ2(4) = 87.60, p < .001, and discriminability was higher for structure abnormality (vertical brackets) when premises were implausible, Χ2(4) = 18.39, p < .001.
Figure 6.

Best-fitting configuration of perceptual distributions from block 3 (Premise x Structure) trials.
Ellipses are contours of equal likelihood. Symbols represent category means, and brackets indicate distance between category means within perceptual space. NL = normal, IM = implausible, AB = abnormal. In the legend, the dimension on the x-axis (premise) is listed first in the ordered pairs. The dimension on the y-axis (structure) is listed second in the ordered pairs. Filled shapes represent a higher (non-normal) level on the y-axis, while triangles represent a higher (non-normal) level on the x-axis.
There was also a violation of DS along both dimensions when premise and structure were paired. When deciding if stimuli contained a plausible or implausible premise, participants were more likely to give the ‘implausible’ response for stimuli from the abnormal structure categories, Χ2(88) = 918.84, p < .001 (average decision bound slope was 7 degrees counterclockwise from vertical). When deciding if stimuli contained normal or abnormal structure, participants were more likely to give the ‘abnormal’ response for stimuli from the implausible premise categories, Χ2(88) = 889.55, p < .001 (average slope was 22 degrees clockwise from horizontal).
Within the individual categories, covariance between the premise plausibility and structure dimensions differed significantly from zero, indicating violation of PI, Χ2(4) = 14.11, p < .001. In general, the more implausible the premise of an email, the more structure was construed as being abnormal.
Discussion
Our goal was to understand distinct perceptual and decisional aspects of spam email mental construal. Using categories pairing presence or absence of three stimulus features – awkward prose, abnormal structure, and implausible premise – we examined dimensional interactions within the general recognition theory framework. This is the first study to apply GRT – which is a multivariate generalisation of signal detection theory – to describe dimensional interactions underlying mental processing of spam emails.
For all three dimension pairings, classification accuracy was higher when stimuli contained either two ‘normal’ features (e.g., normal prose and structure) or two ‘non-normal’ features (e.g., awkward prose and implausible premise). Accuracy was much lower when only one non-normal feature was present. GRT modelling revealed both perceptual and decisional contributions to this pattern. In general, perceptual discriminability between the normal and non-normal level of each dimension was higher when appearing with the non-normal level of the paired dimension (the only exception being prose discriminability when co-varied with premise plausibility). A similar pattern emerged for decision bound placement along each dimension. The slope of each decision bound was such that the ‘non-normal’ response along one dimension was more likely for stimuli that also exhibited the non-normal level on the paired dimension.
Examining spam email processing in the GRT framework has both theoretical and practical significance. One goal was to examine what this method could uncover about subjective mental representation of high-dimensional real world stimuli. To measure mental representation along each dimension, we adopted a subjective-rating method used in previous GRT research to provide an ordinal-level scaling of the stimuli along each dimension (Farris, Viken, and Treat 2010; Kleider-Offutt et al. 2018). Like many applications of signal detection, we make the simplifying assumption that the normal distribution is a reasonable model of mental representation. The extent to the current dimensions can be treated as ‘perceptual’ dimensions and the extent to which they meet the model assumptions is an important question. Future studies could further test these assumptions by starting with a much larger initial set of stimuli from which to generate categories, and by collecting subjective dimension ratings from a very large sample of participants (see Farris et al. 2006, for an example).
From a practical standpoint, application of GRT can help determine which stimulus features exert influence over email perception, decision making, or both (as in the current study). Perceptual influence suggest that classification training would benefit from exposure to many examples to reduce variance (thus increasing discriminability). Decisional influence of a stimulus feature suggests classification performance could be improved through overt instructions to make the decision bound more or less conservative.
Another potential benefit of GRT is the possibility of identifying individual differences in susceptibility to different spam email cues. Such information could inform personalised training emphasizing features that need particular attention. This might be particularly valuable for embedded training systems that present phishing emails periodically in a real-world setting.
In future studies, we hope to expand on our current findings by examining interactions in other contexts. For example, the current study asked participants to classify stimuli, but all the stimuli were considered spam of some type. The same features can appear in legitimate emails, so it would be worthwhile to see if classifying stimuli as spam or not might be influenced by combinations of the dimensions studied here. Also, although our stimulus set included phishing emails, they were of a generic nature. Our results might change given more personalised phishing attempts. For example, the ability to perceptually discriminate between presence and absence of our subjective stimulus features may be lower in this situation. Finally, GRT has a neuropsychological implementation positing multiple learning-system contributions to classification, making it applicable to testing theoretical predictions about automatic and controlled processing of spam emails (Ashby & Maddox, 2011; Vishwanath, Harrison, & Ng, 2016). In addition, GRT seems ideally suited to provide deeper insight into issues raised in the literature, such as why urgency has the influence that it does on observers’ interpretation of premise plausibility (e.g., Vishwanath, et al 2011). Do people fail to notice cues suggesting that a premise is implausible? Or, having noticed a cue to premise implausibility, do observers use a different decision criterion when urgency prompts are present? Research within the GRT framework could manipulate urgency to see which of these aspects of performance change as a result, which may suggest different mitigation strategies. For example, if the decision criterion shifts due to urgency, then a simple reminder to be sceptical about urgency cues might improve performance. But if the effect of urgency influences the features noticed by observers in the first place, then mitigation might require a different strategy (e.g., extended training).
Despite these questions, we consider the current research as a first step in a larger exploration into the mental representation of spam email messages. Efforts to improve cybersecurity should benefit from increased insight into psychological representations at the heart of these decisions.
Funding acknowledgement:
This work was supported by the National Institutes of Health under Grant R15AG045821 and the Office of Naval Research under Grant N00014-15-1-2243
Footnotes
Disclosure statement: No potential conflict of interest was reported by the authors
References
- Ashby FG, and Townsend JT. 1986. “Varieties of Perceptual Independence.” Psychological Review 93 (2): 154. [PubMed] [Google Scholar]
- Ashby FG, & Maddox WT (2011). Human category learning 2.0. Annals of the New York Academy of Sciences 1224(1), 147–161. [DOI] [PMC free article] [PubMed] [Google Scholar]
- Bergholz A, De Beer J, Glahn S, Moens M, Paaß G, and Strobel S. 2010. “New Filtering Approaches for Phishing Email.” Journal of Computer Security 18: 7–35. [Google Scholar]
- Canfield CI, Fischhoff B, and Davis A. 2016. “Quantifying Phishing Susceptibility for Detection and Behavior Decisions.” Human Factors 58 (8): 1158–1172. [DOI] [PubMed] [Google Scholar]
- Chandrasekaran M, Narayanan K, and Upadhyaya S. 2006. “Phishing Email Detection Based on Structural Properties.” In New York State Cyber Security Conference. [Google Scholar]
- Drake CE, Oliver JJ, and Koontz EJ. 2004. “Anatomy of a Phishing Email.” In Proceedings of the Second Conference on Email and Anti-Spam (CEAS). [Google Scholar]
- Downs JS, Holbrook MB, and Cranor LF. 2006. “Decision Strategies and Susceptibility to Phishing.” In Proceedings of the Second Symposium on Usable Privacy and Security: 79–90. [Google Scholar]
- Farris C, Viken RJ, Treat TA, and McFall RM. 2006. “Heterosocial Perceptual Organization: Application of the Choice Model to Sexual Coercion.” Psychological Science 17 (10): 869–875. [DOI] [PubMed] [Google Scholar]
- Farris C, Viken RJ, and Treat TA. 2010. “Perceived Association between Diagnostic and Non-diagnostic Cues of Women’s Sexual Interest: General Recognition Theory Predictors of Risk for Sexual Coercion.” Journal of Mathematical Psychology 54 (1): 137–149. [DOI] [PMC free article] [PubMed] [Google Scholar]
- Ferguson AJ 2005. “Fostering Email Security Awareness: The West Point Carronade.” Educause Quarterly 1: 55–57. [Google Scholar]
- Fette I, Sadeh N, and Tomasic A. 2007. “Learning to Detect Phishing Emails.” In Proceedings of the 16th International Conference on World Wide Web. [Google Scholar]
- Grimes GA, Hough MG, and Signorella ML. 2007. “Email End Users and Spam: Relations of Gender and Age Group to Attitudes and Actions.” Computers in Human Behavior 23: 318–332. [Google Scholar]
- Hayden EC 2015. “Cybercrime Fight Targets User Error.” Nature 518: 282–283. [DOI] [PubMed] [Google Scholar]
- Herley C 2012. “Why do Nigerian Scammers Say They are from Nigeria?” In Proceedings of the Workshop on the Economics of Information Security. [Google Scholar]
- Jagatic TN, Johnson NA, Jakobsson M, and Menczer F. 2007. “Social Phishing.” Communications of the ACM 50 (10): 94–100. [Google Scholar]
- Kleider-Offutt HM, Bond AD, Williams SE, and Bohil CJ. 2018. “When a Face Type is Perceived as Threatening: Using General Recognition Theory to Understand Biased Categorization of Afrocentric Faces.” Memory and Cognition: 1–13. [DOI] [PubMed] [Google Scholar]
- Kumaraguru P, Sheng S, Acquisti A, Cranor LF, and Hong J. 2010. “Teaching Johnny Not to Fall for Phish.” In ACM Transactions on Internet Technology (TOIT) 10 (2): 7. [Google Scholar]
- Lowd D and Meek C. 2005. “Good Word Attacks on Statistical Spam Filters.” In Proceedings of the Second Conference on Email and Anti-Spam (CEAS). [Google Scholar]
- Macmillan NA, and Creelman CD. 2004. “Detection Theory: A User’s Guide.” Psychology press. [Google Scholar]
- Mayhorn CB, & Nyeste PG (2012). Training users to counteract phishing. Work, 41(Supplement 1), 3549–3552. [DOI] [PubMed] [Google Scholar]
- McCarley JS, and Krebs WK. 2006. “The Psychophysics of Sensor Fusion: A Multidimensional Signal Detection Analysis.” In Proceedings of the Human Factors and Ergonomics Society Annual Meeting 50 (17): 2094–2098. [Google Scholar]
- Parsons K, McCormac A, Pattinson M, Butavicius M, & Jerram C (2013, July). Phishing for the truth: A scenario-based experiment of users’ behavioural response to emails. In IFIP International Information Security Conference (pp. 366–378). Springer, Berlin, Heidelberg. [Google Scholar]
- R Core Team. 2016. R: A language and environment for statistical computing. R Foundation for Statistical Computing, Vienna, Austria: Retrieved from http://www.R-project.org/ [Google Scholar]
- Robila SA, and Ragucci JW. 2006. “Don’t Be a Phish: Steps in User Education.” Proceedings of the 11th annual SIGCSE conference on Innovation and technology in computer science education. [Google Scholar]
- RStudio Team. 2016. RStudio: Integrated Development for R. RStudio, Inc., Boston, MA: Retrieved from http://www.rstudio.com/ [Google Scholar]
- Soto FA, Vucovich L, Musgrave R, and Ashby FG. 2015. “General Recognition Theory with Individual Differences: A New Method for Examining Perceptual and Decisional Interactions with an Application to Face Perception.” Psychonomic Bulletin and Review 22 (1): 88–111. [DOI] [PMC free article] [PubMed] [Google Scholar]
- Soto FA, Zheng E, Fonseca J, and Ashby FG. 2017. “Testing Separability and Independence of Perceptual Dimensions with General Recognition Theory: A Tutorial and New R Package (grtools).” Frontiers in Psychology. [DOI] [PMC free article] [PubMed] [Google Scholar]
- Youn S and McLeod D. 2007. “A Comparative Study for Email Classification.” Computing Sciences and Software Engineering, 387–391. [Google Scholar]
- Vishwanath A, Harrison B, & Ng YJ (2016). Suspicion, cognition, and automaticity model of phishing susceptibility. Communication Research, 0093650215627483. [Google Scholar]
- Vishwanath A, Herath T, Chen R, Wang J, and Rao HR (2011). “Why Do People Get Phished? Testing Individual Differences in Phishing Vulnerability within an Integrated, Information Processing Model.” Decision Support Systems 51 (3): 576–586. [Google Scholar]
- Wu C, Cheng K, Zhu Q, and Wu Y. 2005. “Using Visual Features for Anti-Spam Filtering.” In Proceedings of the IEEE International Conference on Image Processing. [Google Scholar]