Dear Editor,
Despite substantial advances in neonatal medicine, retinopathy of prematurity (ROP) continues to be a serious therapeutic challenge[1]. Visual acuity loss in patients with ROP has been associated with structural retinal abnormalities (including retinal detachment, retinal folds, and pigmentary retinopathy), cataract, glaucoma, and amblyopia due to refractive error or strabismus[2]. A subset of patients with ROP, either treated or untreated may develop temporal dragging of the fovea. The reported incidence of foveal dragging varies widely, but can be affected by retinal photocoagulation and the prematurity level of the infant. For example, a recent study reported an incidence of 7% in subjects that were treated for threshold ROP, but 0 in subjects with spontaneous regression[3]. In the Multicenter Trial of Cryotherapy for Retinopathy of Prematurity, the most common association with an unfavorable visual outcome despite a favorable anatomical outcome was foveal dragging as defined by the Reese cicatricial grading system[4]–[5]. These subjects have widely variable visual outcomes. The purpose of the current study is to illustrate various clinical and imaging findings associated with foveal dragging in subjects with a history of ROP.
An Institutional Review Board (IRB)-approved study was performed according to the Declaration of Helsinki. The Institutional Review Board waived the consenting process due to retrospective nature and minimal risk. A non-consecutive non-comparative case series of patients with clinical foveal dragging and history of ROP examined at a satellite office of a University Referral-Center was conducted. Data regarding gender, age at examination, medical history, best-corrected visual acuity (BCVA), fundus photography, and spectral domain optical coherence tomography (SD-OCT) OCT2 module with a wavelength 870 nm and scan rate of 85 000 Hz (Heidelberg Engineering, Heidelberg, Germany) were collected. All patients underwent the institutional standard foveal SD-OCT protocol using a raster line length of 6.0 mm. In addition, an 8.9-mm raster line length scan was also performed to evaluate the distance from the foveal center to the optic disc. The distance from the foveal center to the temporal optic disc and to the optic disc center were measured in the 8.9-mm raster line using commercially available software (Heidelberg Engineering, Heidelberg, Germany).
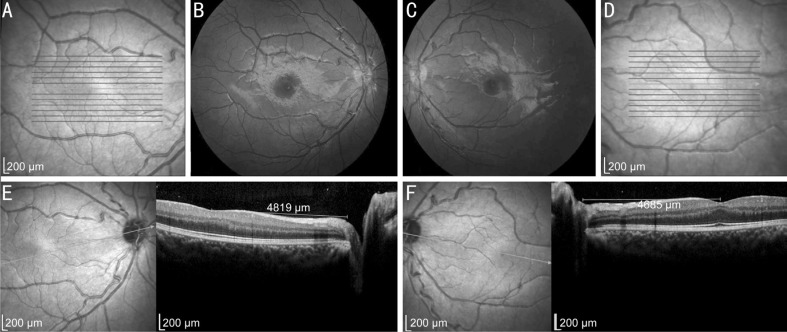
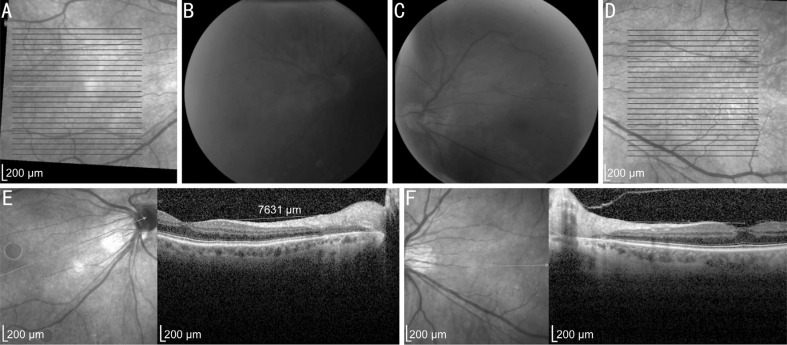
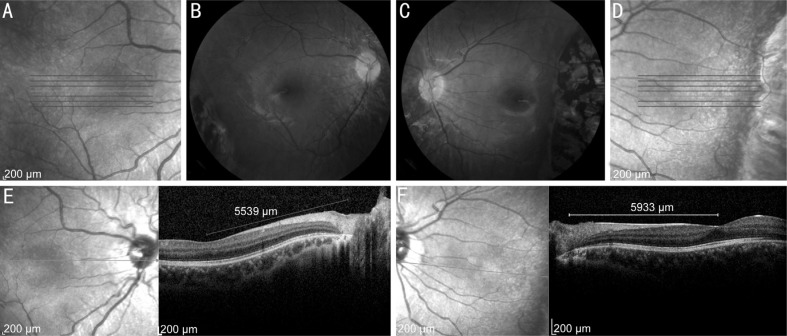
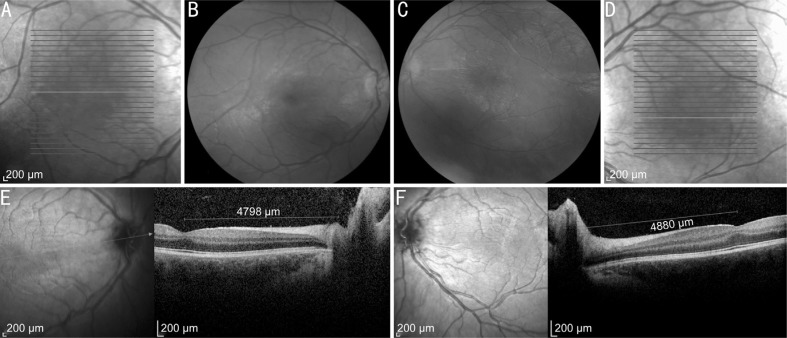
Table 1 summarizes the clinical and SD-OCT findings in the current series. Figures 1–6 show the imaging findings in each case.
Table 1. Clinical characteristics and optic disc to fovea distance as measured by spectral domain optical coherence tomography in the current series.
| Subject | Age (y) | Best-corrected visual acuity (OD) | Best-corrected visual acuity (OS) | Follow-up (y) | Other complications | Temporal disc edge to fovea distance (OD) | Temporal disc edge to fovea distance (OS) | Disc center to fovea distance (OD) | Disc center to fovea distance (OS) |
| 1 | 6 | 20/25 | 20/30 | 3 | Myopia | 4.819 | 4.886 | 5.723 | 5.430 |
| 2 | 6 | 20/30 | 20/30 | 3 | Myopia | 5.639 | 5.933 | 6.624 | 6.830 |
| 3 | 7 | 20/40 | 20/40 | 1 | Hyperopia, nystagmus | 4.798 | 4.880 | 5.356 | 5.458 |
| 4 | 9 | 20/25 | 20/30 | 5 | Myopia | 5.562 | 5.754 | 6.359 | 6.672 |
| 5 | 21 | 20/40 | 20/25 | 2 | Myopia, nystagmus, esotropia | 5.647 | 4.725 | 6.643 | 5.519 |
| 6 | 65 | 20/200 | 20/30 | 2 | Myopia, amblyopia | 7.531 | 5.986 | 8.186 | 6.824 |
mm
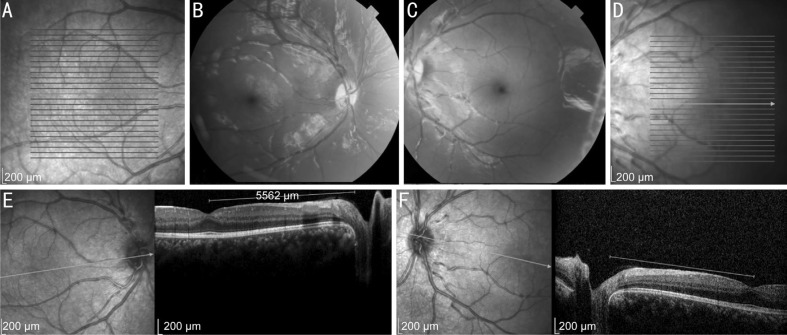
Figure 1. Multimodal imaging of subject 1.
A: Macular SD-OCT infrared image of the right eye using raster scan lengths of 6.0 mm; B: Fundus photography of right eye; C: Fundus photography of left eye; D: Macular SD-OCT infrared image of the left eye using raster scan lengths of 6.0 mm; E: Macular SD-OCT with infrared image of the right eye using raster scan length of 8.9 mm; F: Macular SD-OCT with infrared image of the left eye using raster scan length of 8.9 mm.
Figure 6. Multimodal imaging of subject 6.
A: Macular SD-OCT infrared image of the right eye using raster scan lengths of 6.0 mm; B: Fundus photography of right eye; C: Fundus photography of left eye; D: Macular SD-OCT infrared image of the left eye using raster scan lengths of 6.0 mm; E: Macular SD-OCT with infrared image of the right eye using raster scan length of 8.9 mm; F: Macular SD-OCT with infrared image of the left eye using raster scan length of 8.9 mm.
The majority of previous studies using SD-OCT to evaluate ROP subjects have focused on macular features such as retention of the inner retinal layers at the foveal center, presence of outer nuclear layer widening, photoreceptor elongation, macular cystoid changes, and abnormalities in foveal development[6]–[15]. Recent studies have also described macular schisis, inner retinal thickening, chorioretinal atrophy in subjects with a history of ROP[16]. However, the literature regarding the SD-OCT features present in subjects with a history of ROP and foveal dragging is limited. In the present series, 10/12 eyes had retention of the inner nuclear layers at the foveal center. All eyes had presence of outer nuclear layer widening with photoreceptor elongation.
The literature regarding the distance between the fovea and the optic disc in normal children and adults is scarce. Prior studies have had differences in measurement points; some studies measured the disc center-to-fovea distance and others have measured temporal disc edge-to-fovea distance[17]–[19]. This discrepancy in measurements could affect the results by about half a disc diameter (0.8 mm). A study of 3468 adults in China reported a mean disc center-to-fovea distance of 4.76±0.34 mm; this distance increased with increasing axial length, larger parapapillary alpha zone and parapapillary beta/gamma zone, and larger disc area[17]. A study performed in Finland in prematurely born children (aged 10-11y) reported the mean disc center-to-fovea distance to be 4.74±0.29 mm[18]. Another study performed in England that analyzed preterm and full-term infants reported a mean temporal disc edge-to-fovea distance of 4.4±0.4 mm, without difference between the preterm infants and the full-term infants[19]. This slightly lower mean in infants may be associated with shorter axial length. Based on the historical data, an SD-OCT infrared image with a raster line length of 6.0 mm should visualize the optic nerve in most normal subjects.
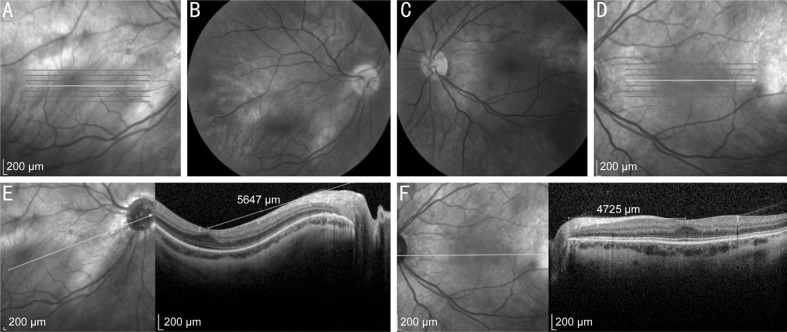
In the present series, all eyes were two standard deviations above historical controls when disc center-to-fovea distance and temporal disc edge-to-fovea distance were compared[17]–[19]. In 5/6 subjects, the ROP was treated with photocoagulation and in one ROP regressed spontaneously. The SD-OCT infrared image failed to visualize the optic nerve head in 11/12 eyes due to temporal foveal dragging; the exception was Subject 5 OS, in which only the temporal edge of the disc is visible. Failure to visualize the optic nerve head in the fundus map photo in the SD-OCT study may represent a quick test to identify foveal dragging.
The literature suggests a mean distance from the temporal disc margin to the fovea of approximately 4.4 mm in infants and approximately 4.75 mm in adults; for children aged 6-7y, perhaps an intermediate value would be appropriate. In the present series, 4 patients were aged 6-9y; of these, 2 had distances of about 4.8 mm in each eye and 2 had a distance greater than 5.6 mm in each eye. Also in the present series, there were 2 adult patients; in 1, distances were 4.7 mm in 1 eye and 5.6 mm in the other; in the other adult, distances were greater than 5.6 mm in each eye. In summary, all eyes in this series had disc-to-fovea distances greater than historical controls.
The cicatricial stage of ROP retinopathy can lead to lenticular myopia, temporal vitreoretinal fibrosis, dragging of the macula, and vitreoretinal folds. Therefore, cicatricial ROP may alter the normal fundus landmarks and may affect the results of the measurements carried out on fundus photographs[20]. Previous studies that have evaluated the disc-to-fovea distance have used fundus photography to estimate the distance[17]–[19]. However, the present study used SD-OCT to measure the distance using a raster line length of 8.9 mm. SD-OCT may allow for improved accuracy in measurements, especially in eyes with a posterior pole staphyloma.
In the current study, the standard foveal SD-OCT protocol uses a raster line length of 6.0 mm. Normally the optic nerve is visible in the infrared image centered on the fovea. The optic nerve was not completely visible in the infrared fundus image in any of the eyes reported in this study (Figures 1A, 1D, 2A, 2D, 3A, 3D, 4A, 4D, 5A, 5D, 6A, 6D). In one eye of subject 5, the fundus infrared image showed the temporal optic nerve head (Figure 5D).
Figure 2. Multimodal imaging of subject 2.
A: Macular SD-OCT infrared image of the right eye using raster scan lengths of 6.0 mm; B: Fundus photography of right eye; C: Fundus photography of left eye; D: Macular SD-OCT infrared image of the left eye using raster scan lengths of 6.0 mm; E: Macular SD-OCT with infrared image of the right eye using raster scan length of 8.9 mm; F: Macular SD-OCT with infrared image of the left eye using raster scan length of 8.9 mm.
Figure 3. Multimodal imaging of subject 3.
A: Macular SD-OCT infrared image of the right eye using raster scan lengths of 6.0 mm; B: Fundus photography of right eye; C: Fundus photography of left eye; D: Macular SD-OCT infrared image of the left eye using raster scan lengths of 6.0 mm; E: Macular SD-OCT with infrared image of the right eye using raster scan length of 8.9 mm; F: Macular SD-OCT with infrared image of the left eye using raster scan length of 8.9 mm.
Figure 4. Multimodal imaging of subject 4.
A: Macular SD-OCT infrared image of the right eye using raster scan lengths of 6.0 mm; B: Fundus photography of right eye; C: Fundus photography of left eye; D: Macular SD-OCT infrared image of the left eye using raster scan lengths of 6.0 mm; E: Macular SD-OCT with infrared image of the right eye using raster scan length of 8.9 mm; F: Macular SD-OCT with infrared image of the left eye using raster scan length of 8.9 mm.
Figure 5. Multimodal imaging of subject 5.
A: Macular SD-OCT infrared image of the right eye using raster scan lengths of 6.0 mm; B: Fundus photography of right eye; C: Fundus photography of left eye; D: Macular SD-OCT infrared image of the left eye using raster scan lengths of 6.0 mm; E: Macular SD-OCT with infrared image of the right eye using raster scan length of 8.9 mm; F: Macular SD-OCT with infrared image of the left eye using raster scan length of 8.9 mm.
The present study is limited by the retrospective and nonconsecutive nature of the case series, as well as selection bias because only patients that could cooperate for SD-OCT scans were included. Most patients in our series had mild clinical features of foveal dragging and it is likely that some patients with advanced foveal dragging and poor visual acuity could not undergo SD-OCT scanning, due to poor fixation or poor cooperation, and may have been missed by the study design. In addition, there is no specific ICD-10 code for foveal dragging, so it is very likely that other patients with this entity were not captured. This series is not comprehensive, but it does illustrate many pertinent features of this diagnosis. Larger series with age-matched controls may help identify the spectrum of foveal dragging distance that may be associated with variable clinical and visual outcomes.
In conclusion, some subjects with history of ROP may have an increased disc-to-fovea distance. SD-OCT can aid in the detection of this anomaly, and the distance may be measured using commercially available software. Further studies with longer follow up and larger cohorts may lead to a better understanding of this condition.
Acknowledgments
This manuscript was presented as a poster at the AAO 2017.
Foundations: Supported in part by the National Institute of Health, Bethesda, Maryland (Grant P30-EY014801); an unrestricted grant to the University of Miami from Research to Prevent Blindness, New York, New York, USA.
Conflicts of Interest: Villegas VM, None; Schwartz SG, Consultant: Alimera, Bausch and Lomb, Welch Allyn; Berrocal AM, Consultant: Dutch Ophthalmic Research Center, Visunex, Alcon; Murray TG, None; Flynn HW, None.
REFERENCES
- 1.Gilbert C. Changing challenges in the control of blindness in children. Eye (Lond) 2007;21(10):1338–1343. doi: 10.1038/sj.eye.6702841. [DOI] [PubMed] [Google Scholar]
- 2.Shah PK, Prabhu V, Karandikar SS, Ranjan R, Narendran V, Kalpana N. Retinopathy of prematurity: Past, present and future. World J Clin Pediatr. 2016;5(1):35–46. doi: 10.5409/wjcp.v5.i1.35. [DOI] [PMC free article] [PubMed] [Google Scholar]
- 3.Sahni J, Subhedar NV, Clark D. Treated threshold stage 3 versus spontaneously regressed subthreshold stage 3 retinopathy of prematurity: a study of motility, refractive, and anatomical outcomes at 6mo and 36mo. Br J Ophthalmol. 2005;89(2):154–159. doi: 10.1136/bjo.2004.045815. [DOI] [PMC free article] [PubMed] [Google Scholar]
- 4.Gilbert WS, Dobson V, Quinn GE, Reynolds J, Tung B, Flynn JT. The correlation of visual function with posterior retinal structure in severe retinopathy of prematurity. Cryotherapy for Retinopathy of Prematurity Cooperative Group. Arch Ophthalmol. 1992;110(5):625–631. doi: 10.1001/archopht.1992.01080170047022. [DOI] [PubMed] [Google Scholar]
- 5.Classification of retrolental fibroplasia. Am J Ophthalmol. 1953;36(10):1333–1335. [PubMed] [Google Scholar]
- 6.Villegas VM, Capó H, Cavuoto K, McKeown CA, Berrocal AM. Foveal Structure-Function correlation in children with history of retinopathy of prematurity. Am J Ophthalmol. 2014;158(3):508–512.e2. doi: 10.1016/j.ajo.2014.05.017. [DOI] [PubMed] [Google Scholar]
- 7.Dubis AM, Subramaniam CD, Godara P, Carroll J, Costakos DM. Subclinical macular findings in infants screened for retinopathy of prematurity with spectral-domain optical coherence tomography. Ophthalmology. 2013;120(8):1665–1671. doi: 10.1016/j.ophtha.2013.01.028. [DOI] [PMC free article] [PubMed] [Google Scholar]
- 8.Maldonado RS, O'Connell R, Ascher SB, Sarin N, Freedman SF, Wallace DK, Chiu SJ, Farsiu S, Cotten M, Toth CA. Spectral-domain optical coherence tomographic assessment of severity of cystoid macular edema in retinopathy of prematurity. Arch Ophthalmol. 2012;130(5):569–578. doi: 10.1001/archopthalmol.2011.1846. [DOI] [PMC free article] [PubMed] [Google Scholar]
- 9.Erol MK, Ozdemir O, Turgut Coban D, Bilgin AB, Dogan B, Sogutlu Sari E, Toslak D. Macular findings obtained by spectral domain optical coherence tomography in retinopathy of prematurity. J Ophthalmol. 2014;2014:468653. doi: 10.1155/2014/468653. [DOI] [PMC free article] [PubMed] [Google Scholar]
- 10.Joshi MM, Trese MT, Capone A., Jr Optical coherence tomography findings in stage 4A retinopathy of prematurity: a theory for visual variability. Ophthalmology. 2006;113(4):657–660. doi: 10.1016/j.ophtha.2006.01.007. [DOI] [PubMed] [Google Scholar]
- 11.Gursoy H, Bilgec MD, Erol N, Basmak H, Colak E. The macular findings on spectral-domain optical coherence tomography in premature infants with or without retinopathy of prematurity. Int Ophthalmol. 2016;36(4):591–600. doi: 10.1007/s10792-016-0176-9. [DOI] [PubMed] [Google Scholar]
- 12.Hammer DX, Iftimia NV, Ferguson RD, Bigelow CE, Ustun TE, Barnaby AM, Fulton AB. Foveal fine structure in retinopathy of prematurity: an adaptive optics Fourier domain optical coherence tomography study. Invest Ophthalmol Vis Sci. 2008;49(5):2061–2070. doi: 10.1167/iovs.07-1228. [DOI] [PMC free article] [PubMed] [Google Scholar]
- 13.Wu WC, Lin RI, Shih CP, Wang NK, Chen YP, Chao AN, Chen KJ, Chen TL, Hwang YS, Lai CC, Huang CY, Tsai S. Visual acuity, optical components, and macular abnormalities in patients with a history of retinopathy of prematurity. Ophthalmology. 2012;119(9):1907–1916. doi: 10.1016/j.ophtha.2012.02.040. [DOI] [PubMed] [Google Scholar]
- 14.Vinekar A, Avadhani K, Sivakumar M, Mahendradas P, Kurian M, Braganza S, Shetty R, Shetty BK. Understanding clinically undetected macular changes in early retinopathy of prematurity on spectral domain optical coherence tomography. Invest Ophthalmol Vis Sci. 2011;52(8):5183–5188. doi: 10.1167/iovs.10-7155. [DOI] [PubMed] [Google Scholar]
- 15.Muni RH, Kohly RP, Charonis AC, Lee TC. Retinoschisis detected with handheld spectral-domain optical coherence tomography in neonates with advanced retinopathy of prematurity. Arch Ophthalmol. 2010;128(1):57–62. doi: 10.1001/archophthalmol.2009.361. [DOI] [PubMed] [Google Scholar]
- 16.Thanos A, Yonekawa Y, Todorich B, Huang N, Drenser KA, Williams GA, Trese MT, Capone A., Jr Spectral-domain optical coherence tomography in older patients with history of retinopathy of prematurity. Ophthalmic Surg Lasers Imaging Retina. 2016;47(12):1086–1094. doi: 10.3928/23258160-20161130-02. [DOI] [PubMed] [Google Scholar]
- 17.Jonas RA, Wang YX, Yang H, Li JJ, Xu L, Panda-Jonas S, Jonas JB. Optic disc-fovea distance, axial length and parapapillary zones. The Beijing Eye Study 2011. PLoS One. 2015;10(9):e0138701. doi: 10.1371/journal.pone.0138701. [DOI] [PMC free article] [PubMed] [Google Scholar]
- 18.Knaapi L, Lehtonen T, Vesti E, Leinonen MT. Determining the size of retinal features in prematurely Born children by fundus photography. Acta Ophthalmol. 2015;93(4):339–341. doi: 10.1111/aos.12554. [DOI] [PubMed] [Google Scholar]
- 19.De Silva DJ, Cocker KD, Lau G, Clay ST, Fielder AR, Moseley MJ. Optic disk size and optic disk-to-fovea distance in preterm and full-term infants. Invest Ophthalmol Vis Sci. 2006;47(11):4683–4686. doi: 10.1167/iovs.06-0152. [DOI] [PubMed] [Google Scholar]
- 20.Rohrschneider K. Determination of the location of the fovea on the fundus. Invest Ophthalmol Vis Sci. 2004;45(9):3257–3258. doi: 10.1167/iovs.03-1157. [DOI] [PubMed] [Google Scholar]


