Abstract
Background:
Diffusion-weighted imaging (DWI) is useful for detecting and characterizing liver lesions but is sensitive to organ motion artifact, especially in the left lobe.
Purpose:
To assess the signal intensity (SI) loss in the left hepatic lobe on DWI depending on motion-proving gradient (MPG) pulse direction (preliminary study) and to evaluate the usefulness of modified signal averaging to reduce the SI loss on DWI (application study).
Methods:
About 48 (preliminary) and 35 (application) patients were included. In the preliminary study, DWI with four different MPG directions, only a single MPG pulse direction (x-, y-, or z-axis) and all three directions combined (standard DWI), were reconstructed from the original data. In the application study, we examined the usefulness of the weighted averaging number of excitations (wNEX) method, in which a larger weighting factor is applied to the higher signal in pixel-by-pixel NEX signal averaging by comparing four reconstruction methods. We assumed that true signals would be the same in both lobes. The SI and apparent diffusion coefficient (ADC) ratios for the left versus right lobe were calculated by dividing the SI/ADC of the right lobe by that of the left lobe.
Results:
In the preliminary study, the SI ratio was significantly lower on DWI using only the x-axis but was significantly higher on DWI using only the z-axis (both P < 0.0001) when compared with standard DWI. In the application study, the SI (mean, 1.15–1.17) and ADC (0.90–0.92) ratios on DWI with wNEX were closer to 1.0 than those on standard DWI (SI ratio, 1.32–1.38; ADC ratio 0.80–0.81); the differences were significant (all P < 0.0001).
Conclusion:
The MPG pulse along the z-axis caused signal loss in the left hepatic lobe. The wNEX reconstruction method effectively reduced signal loss in the left lobe on DWI.
Keywords: diffusion-weighted imaging, liver, motion-proving gradient pulse, number of excitations, weighted averaging
Introduction
Diffusion-weighted imaging (DWI) is considered a standard component of clinical MRI. DWI is useful for detecting and characterizing lesions in the liver,1–4 but is highly sensitive to organ motion artifact. Therefore, image quality is important to ensure appropriate patient care. Several studies have reported that cardiac motion decreases the signal intensity (SI) in the left hepatic lobe on high b value DWI, resulting in higher apparent diffusion coefficient (ADC) values in the left lobe than in the right lobe.5–7 This artifact has two fundamental features: 1) Cardiac motion that is most prominent along the z-axis (the heart moves the liver in the craniocaudal direction) and 2) artifact causing the signal loss. Typically, on the conventional DWI, the multiple number of excitations (NEX) is used to obtain an adequate signal-to-noise ratio without cardiac triggering. However, given their fundamental features, each NEX image in each motion-proving gradient (MPG) direction is expected to be affected differently by cardiac motion, which leads to a hypothesis that cardiac motion artifacts can be minimized by introduction of weighted averaging of signals or elimination of MPG pulses along the z-axis.
The aim of this two-part study was to assess the SI and ADC of the left hepatic lobe on DWI based on the MPG direction (preliminary study) and to evaluate the usefulness of modified averaging of the signal to reduce the signal loss in the left lobe, in addition to the investigation of the effect of eliminating of MPG along the z-axis (application study).
Materials and Methods
Patients
This single-center, retrospective, cross-sectional study was performed in accordance with the principles outlined in the Declaration of Helsinki and was approved by the relevant institutional Review Board. The requirement for written informed consent was waived.
First, 48 consecutive patients (33 men, 15 women; mean age, 67.8 ± 9.72 [range, 47–89] years) who underwent abdominal MRI for liver or pancreas screening were included in the preliminary study, which was performed between February and April 2017. About 42 patients had chronic hepatitis (hepatitis C [n = 30], hepatitis B [n = 9], alcoholic steatohepatitis [n = 3] and non-alcoholic steatohepatitis [n = 1]) whereas six patients had no chronic liver disease. About 16 patients had liver masses (hypervascular hepatocellular carcinoma [HCC] [n = 7], early HCC [n = 4], cyst [n = 2], liver metastasis [n = 1], hemangioma [n = 1], and focal nodular hyperplasia [FNH] [n = 1]). Nobody had massive ascites, dilation of intrahepatic bile duct, and acute hepatitis. Next, 35 consecutive patients (21 men, 14 women; mean age, 69.0 ± 10.0 [range, 35–86] years) who underwent abdominal MRI for liver or pancreas screening were included in the application study, which was performed in October 2017. About 11 patients had chronic hepatitis (hepatitis C [n = 4], hepatitis B [n = 3], and alcoholic steatohepatitis [n = 4]) whereas 24 patients had no chronic liver disease. About 12 patients had liver masses (cyst [n = 6], hypervascular HCC [n = 3], liver metastasis [n = 1], hemangioma [n = 1], and FNH [n = 1]). Two patients had dilation of intrahepatic bile duct. Nobody had massive ascites and acute hepatitis.
Diffusion-weighted imaging and wNEX reconstruction
Liver DWI was performed using Discovery MR750 3.0T (GE Healthcare, Waukesha, WI, USA)) with a 32-channel phased-array coil. The DWI sequence parameters are summarized in Table 1. In the preliminary study, four types of image reconstruction were retrospectively performed using the original signal data acquired on routine DWI to generate diffusion-weighted images with the respective x, y, and z MPG directions and all three directions combined (standard DWI). The SI of DWI with all three directions combined (Scmb) is calculated as shown in Eq. [1]:
| [1] |
where Sx, Sy, and Sz are the SI values on DWI using the MPG directions on the x-, y-, and z-axes, respectively. Normal NEX signal averaging was used in the preliminary study.
Table 1.
Sequence parameters of diffusion-weighted imaging
| Parameter | Value |
|---|---|
| Sequence | Spin-echo echo-planar imaging with water-selective excitation |
| Gating | Respiratory-triggering |
| Plane | Transverse |
| Repetition time (ms) | 3000–5700 |
| Echo time (ms) | 55–60 |
| Matrix | 128 × 192 |
| Field of view (cm) | 36 × 36 |
| Section thickness/intersection gap (mm) | 4/5 |
| Number of excitations (NEX) | 8 |
| Flip angle (°) | 90 |
| Acquisition time (s) | 150–180 |
| Parallel imaging | ASSET (acceleration factor 2) |
| Motion-proving gradient pulses | Three axes (x [RL], y [AP], and z [SI]) |
| b value (s/mm2) | 0, 500, and 1000 |
ASSET, array spatial sensitivity encoding technique.
In the application study, the weighted averaging number of excitations (wNEX) method was performed using a prototype reconstruction software by adjusting the weighting factor for each NEX image, w[i], in N-times NEX averaging using the following equation [2]:
| [2] |
where Sx[i], Sy[i], and Sz[i] indicates the SI of the i-th individual NEX image with the MPG pulse in the x-, y-, and z-directions, respectively.
The following four reconstruction methods were used: Method A, standard DWI (using all three MPG pulse directions); Method B, using only two MPG pulse directions (x and y); Method C, standard DWI with wNEX; and Method D, using two MPG pulse directions (x and y) with wNEX.
Image interpretation
In the preliminary study, one MR technologist (K.S.) who had 11 years of experience and was blinded to the clinical data performed a quantitative and qualitative DWI analysis. The SI of the DWI was measured from images with b = 1000 s/mm2. ADC maps were calculated from images with three b values (0, 500, and 1000 s/mm2). With the assumption that the true SI and ADC would be the same in the right and left lobes, the SI and ADC ratios were used as surrogates for unwanted signal loss in the left lobe and were calculated as in Eq. [3]:
| [3] |
Here, SIright and ADCright are the SI and the ADC value of the right lobe of the liver, respectively, and considered to be the same for the left lobe. For quantitative analysis through the MRI console, the largest possible regions of interest were placed on the right and left lobes away from large vessels or artifacts. The overall image quality was also assessed using a 3-point visual score [good (3 points), no artifact; moderate (2 points), slight artifact but could be used for diagnosis; poor (1 point), severe artifact and could not be used for diagnosis; Fig. 1].
Fig. 1.
Examples of images with different image quality. Overall image quality was visually assessed using a 3-point scale (good, no artifact; moderate, minor artifacts but the image is diagnostic; poor, major artifacts with the image being non-diagnostic).
In the application study, two radiologists (S.I. and S.F., with 11 and 3 years of radiology experience, respectively) who were blinded to the clinical data performed the quantitative analysis of DWI. Three oval ROIs were placed on the right and left lobes away from large vessels or artifacts, through four methods through a workstation (Synapse Vincent, Fujifilm Medical, Tokyo, Japan). The average SI and ADC values for the right and left lobes were obtained to calculate the SI and ADC ratios between the right/left lobes.
Statistical analysis
In the preliminary study, the SI ratio, the ADC values for the right and left hepatic lobes, and the visual assessment were compared between the four methods using the paired t-test or Wilcoxon’s signed-rank test with Bonferroni correction. The MPG pulses in all three directions (standard DWI) was used as the control for the comparison.
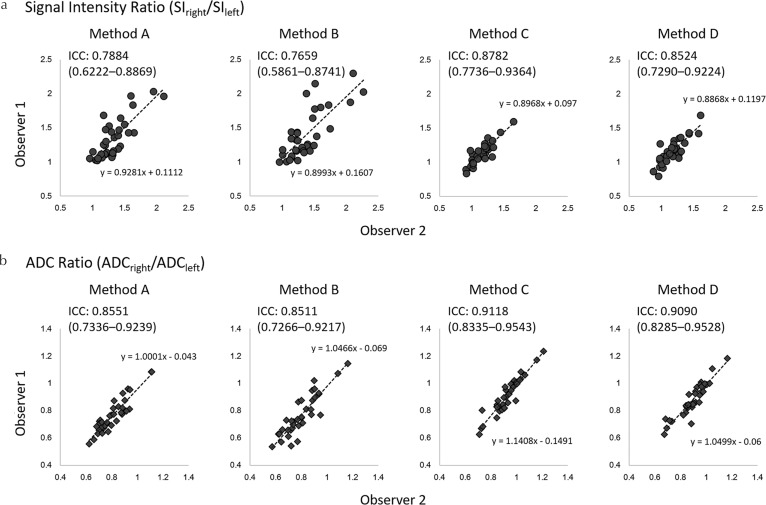
In the application study, the SI and ADC ratios and ADC values for the right and left hepatic lobes were compared between the four methods using the paired t-test with Bonferroni correction and the standard method (Method A) for the control. Intraclass correlation coefficients (ICCs) were calculated to assess inter-observer agreement. Agreement was considered excellent for ICC values (r) > 0.8, good for 0.6 < r ≤ 0.8, moderate for 0.4 < r ≤ 0.6, fair for 0.2 < r ≤ 0.4, and poor for r ≤ 0.2.
All statistical analyses were performed using JMP software (version 12; SAS Institute Inc., Cary, NC, USA). P values < 0.05 were considered statistically significant.
Results
Preliminary study
SI ratio between right and left hepatic lobes
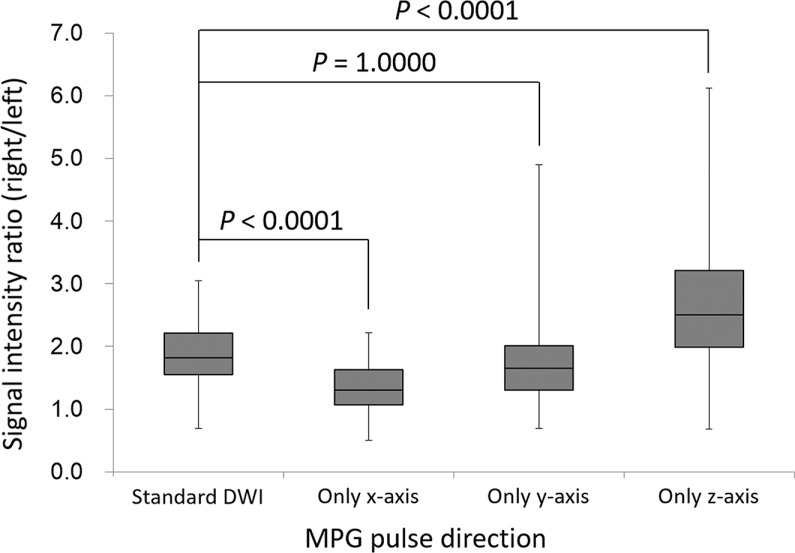
In the preliminary study, the average SI ratio of diffusion-weighted images acquired with MPG pulses in all directions (standard DWI) was 1.86 ± 0.54, indicating that the SI in the left lobe was decreased compared with that in the right lobe. Compared with the standard DWI, the SI ratio was significantly decreased in DWI with the x-axis only (1.37 ± 0.40, P < 0.0001), which showed the improved uniformity between the left and right lobes. However, the SI ratio was significantly increased in DWI with the z-axis only (2.68 ± 1.18, P < 0.0001). No significant differences were observed between the SI ratio of the MPG pulses in all directions and that of acquisition of the y-axis (1.86 ± 0.54 vs. 1.84 ± 0.84, P = 1.0000; Fig. 2).
Fig. 2.
Box plots representing the signal intensity ratio between the right and left lobes (right/left) in the preliminary study. The average signal intensity ratio decreased significantly when applying MPG pulses only along the x-axis, unlike when MPG pulses were applied in all directions. In contrast, the signal intensity ratio increased significantly when MPG pulses were applied along the z-axis. There was no significant difference in the signal intensity ratios between when MPG pulses were applied in all directions and when they were applied only along the y-axis. DWI, diffusion-weighted imaging; MPG, motion-providing gradient.
ADC values in the right and left hepatic lobes
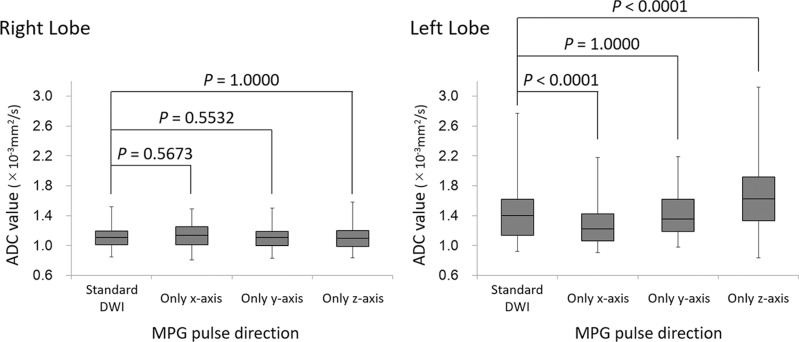
The ADC of the left hepatic lobe was significantly decreased on DWI with the x-axis only (1.30 ± 0.29 × 10⁻³ mm2/s, P < 0.0001) and significantly increased on DWI with the z-axis only (1.61 ± 0.47 × 10⁻³ mm2/s, P < 0.0001) when compared with the ADC of the standard DWI (1.44 ± 0.38 × 10⁻³ mm2/s). No significant difference was observed between the standard DWI and DWI with the y-axis (1.42 ± 0.31 × 10⁻³ mm2/s, P = 1.0000; Fig. 3). On the other hand, in the right hepatic lobe, no significant difference was observed in ADC values between the standard DWI and the other single directions (standard DWI, 1.12 ± 0.15 × 10⁻³ mm2/s; only x-axis, 1.14 ± 0.15 × 10⁻³ mm2/s; only y-axis, 1.10 ± 0.15 × 10⁻³ mm2/s; and only z-axis, 1.11 ± 0.17 × 10⁻³ mm2/s, P = 0.5532–1.0000; Fig. 3).
Fig. 3.
Box-plots of the ADC of the right and left lobes in the preliminary study. There was no significant difference in ADC between the four acquisitions based on the MPG pulse direction for the right lobe of the liver. However, the ADC for the left lobe of the liver decreased significantly during acquisition when the MPG pulse was along only the x-axis and increased significantly during acquisition when the MPG pulse was along only the z-axis. There was no significant difference in the ADC between the conditions where MPG pulses were applied in all directions and where it was applied only along the y-axis. ADC, apparent diffusion coefficient; DWI, diffusion-weighted imaging; MPG, motion-providing gradient.
Image quality in the right and left hepatic lobes
Regarding the image quality of the right hepatic lobe, no significant difference was observed between the standard DWI (mean score, 2.54 ± 0.85) and the other single directions (x-axis only, 2.58 ± 0.82, P = 1.0000; y-axis only, 2.54 ± 0.85, P = 1.0000; z-axis only, 2.46 ± 0.90, P = 0.6380). However, in the left hepatic lobe, the image quality was better in DWI with the x-axis (2.63 ± 0.49, P < 0.0001) and that with y-axis (2.33 ± 0.56, P = 0.0008) but worse in DWI with the z-axis (1.38 ± 0.57, P < 0.0001), when compared with the standard DWI (2.04 ± 0.41; Fig. 4).
Fig. 4.
Comparison of diffusion-weighted imaging findings with b = 1000 s/mm2 for the four motion-providing gradient pulse directions. One operator-defined region of interest (that was as large as possible) was placed on the right and left lobes of the liver away from large vessels or artifacts. The signal loss in the left lobe of the liver was the most prominent during acquisition along the z-axis only. Moreover, signal decrease of spinal cord was also observed during acquisition along the z-axis only. DWI, diffusion-weighted imaging.
Application study
Reconstructions with wNEX and only two MPG directions in x-and y-axes
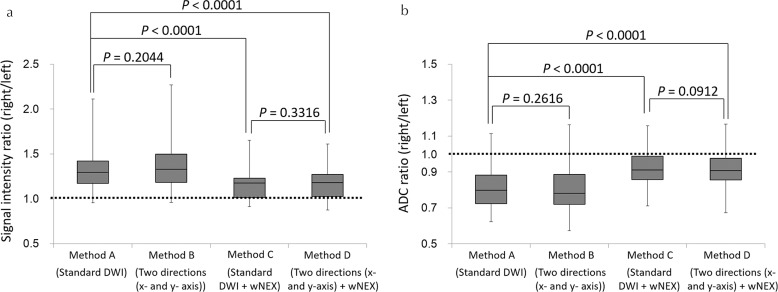
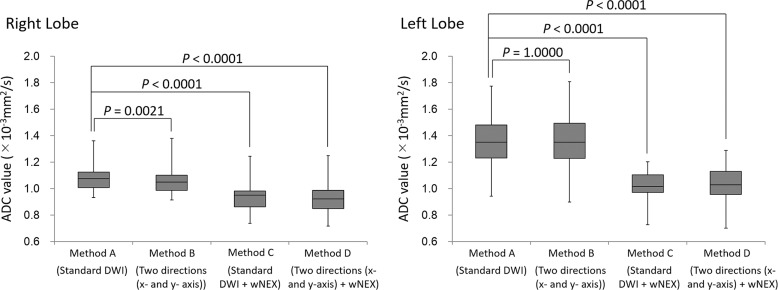
In the application study, the SI ratios of Methods C and D (mean, 1.15 ± 0.16 and 1.17 ± 0.17, respectively) were closer to 1.0 than those of Methods A and B (mean, 1.32 ± 0.25 and 1.38 ± 0.31, respectively). The SI ratios of Methods C and D were significantly lower than the SI ratio of Method A (both P < 0.0001), while no significant difference was observed in the SI ratio between Methods A and B (P = 0.2044) or between Methods C and D (P = 0.3316). The ADC ratios of Methods C and D (mean, 0.92 ± 0.10 and 0.91 ± 0.11, respectively) were closer to 1.0 than those of Methods A and B (mean, 0.81 ± 0.11 and 0.80 ± 0.13, respectively; Fig. 5a). The ADC ratios for Methods C and D were significantly higher than the ADC ratio for Method A (both P < 0.0001), while the ADC ratio was not significantly different between Methods A and B (P = 0.2616) or between Methods C and D (P = 0.0912; Fig. 5b). The ADC of the right lobe of the liver for Method A (mean, 1.08 ± 0.10) was significantly higher than those of other methods (mean, 1.06 ± 0.11 [Method B, P = 0.0021], 0.94 ± 0.11 [Method C, P < 0.0001], and 0.92 ± 0.11 [Method D, P < 0.0001], respectively; Fig. 6). The ADC of the left lobe of the liver for Methods C (mean, 1.02 ± 0.12) and D (mean, 1.03 ± 0.14) were significantly lower than that for Method A (mean, 1.34 ± 0.18, both P < 0.0001), while the ADC of the left lobe of the liver was not significantly different between Methods A and B (mean, 1.35 ± 0.20, P = 0.10000; Fig. 6). The inter-observer agreement for the measurement of the SI and ADC ratios was good to excellent (ICC 0.7659–0.9118; Figs. 7 and 8).
Fig. 5.
Box plots of the signal intensity (SI) ratio (a) and the ADC ratio (b) between the right and the left lobes (right/left) in the application study. The SI and ADC ratios associated with Methods C and D were closer to 1.0 than those associated with Methods A and B. The SI ratios associated with Methods C and D were significantly lower than those associated with Method A. There was no significant difference in the SI ratios between Methods A and B or between Methods C and D. The ADC ratios associated with Methods C and D were significantly higher than those associated with Method A; the ADC ratio associated with Method C was significantly higher than that associated with Method D. ADC, apparent diffusion coefficient; DWI, diffusion-weighted imaging.
Fig. 6.
Box-plots of the ADC of the right and left lobes in the application study. The ADC for the right lobe of the liver of Method A was significantly higher than those of other methods. The ADC for the left lobe of the liver decreased significantly during acquisition with weighted NEX (Methods C and D). There was no significant difference in the ADC between Methods A and B. ADC, apparent diffusion coefficient; DWI, diffusion-weighted imaging; wNEX, weighted averaging number of excitations.
Fig. 7.
The ICCs for measurements of the SI ratio (a) and the ADC ratio (b). The inter-observer ICCs for the measurement of the SI ratio were either good or excellent (0.7659–0.8524). The inter-observer ICCs for the measurement of the ADC ratio were all excellent (0.8511–0.9118). Those associated with Method C were the best. ADC, apparent diffusion coefficient; ICCs, inter-observer intraclass correlation coefficients; SI, signal intensity.
Fig. 8.
Comparison of DWI findings with b = 1000 s/mm2 for the four reconstruction methods. Three oval regions of interest were placed on the right and left lobes of the liver away from large vessels or artifact. The signal intensity in the left lobe of the liver using Methods C and D was higher than that using Methods A and B. DWI, diffusion-weighted imaging; MPG, motion-proving gradient; WA, weighted averaging; wNEX, weighted averaging number of excitations.
Discussion
Our present findings reveal that the SI of the left hepatic lobe was significantly lower than that of the right lobe on DWI with b = 1000 s/mm2, which resulted in the higher ADC in the left lobe than in the right lobe. According to our results for the effect of MPG pulse direction, the signal loss and increased ADC in the left hepatic lobe is probably related to cardiac motion particularly on the z-axis, which is consistent with a previous report.5 We used weighted averaging NEX reconstruction to overcome the signal loss in the left hepatic lobe caused by cardiac motion and showed that wNEX was more useful than eliminating the MPG pulse on the z-axis from the pulse sequence.
Quantitative DWI is clinically important in view of the increasing demand for objective diagnostic methods. Quantification of the ADC value using DWI has shown potential for predicting the grade for hepatocellular carcinoma and staging of liver fibrosis.8–11 DWI is commonly used in the clinic to detect and characterize liver lesions. However, cardiac motion artifacts could obscure focal lesions in the left hepatic lobe. There are some approaches that may overcome motion artifact in the liver. Cardiac gating could be a solution but requires an unrealistically long acquisition time if combined with respiratory triggering.12,13 A multiple NEX approach is usually applied to ensure the signal-to-noise ratio of the image. However, artifact remains in the left lobe because images with severe artifact would contribute to the final image by averaging.
Acquisition of DWI with respiratory triggering and without cardiac triggering is equivalent to selecting the cardiac phase at random in the data acquisition. However, the right lobe can withstand cardiac motion better than the left lobe. Taking these issues into account when performing multiple NEX acquisitions, the signal at the right lobe can be effectively averaged by the relatively robust high signals in the respective NEX images, while that at the left lobe is averaged less effectively because some of the signals at the left lobe in the respective NEX images can be low as a result of the random cardiac phase at the time of data acquisition. This indicates that the signal bias between the right and left lobes remains even when the number of NEX images averaged is increased. The wNEX introduced in this study could reduce the bias in the SI and ADC between the right and left lobes in the liver. The wNEX method utilizes the SI in the respective NEX images for calculation of the weighting factor so that a signal that is severely affected by cardiac motion at the left lobe contributes less to the final image with a low weighting factor. In the application study, it is shown in Fig. 5 that the wNEX method improves the bias between the left and right lobes better than the method combining two MPG directions (x- and y-axis). This indicates that the normal NEX averaging is still affected by the SI difference in the respective NEX images in the respective MPG directions even when z-axis direction was eliminated. On the other hand, the wNEX method corrected significantly the SI difference between the respective NEX images in each MPG direction, which also results in decreasing the bias between the respective MPG directions. Thus, the wNEX method can be useful for improving the uniformity of the SI and ADC in liver DWI. The wNEX method theoretically elevates the base signal level of the entire image and may be considered to potentially have a disadvantage that enhances artifacts that has positive SI, but there was no specific issue regarding the enhanced artifact found in this study.
Limitations
Our study has some limitations. First, we did not evaluate respiratory or diaphragm motion14 or restriction of abdominal wall motion.15 These might be a confounding factor affecting signal loss from the liver on DWI. Second, we only focused on SI, the ADC, and image quality. Further studies are necessary to reveal how our proposed method, i.e. wNEX, could improve the detection of lesions or quantification of diffusivity in the left lobe.
Conclusion
In conclusion, the MPG pulse in the z-axis caused a loss of signal in the left lobe of the liver. The weighted averaging NEX reconstruction method was useful for reducing the discrepancy in SI and ADC values between the left and right lobes caused by cardiac motion in liver DWI regardless of the directions of the MPG pulses.
Footnotes
Conflicts of Interest
We acknowledge a financial support from GE Healthcare on this project. Co-author, Tetsuya Wakayama, is an employee of GE Healthcare. The remaining authors have no other conflict of interest related to this submission personally.
References
- 1.Taron J, Johannink J, Bitzer M, Nikolaou K, Notohamiprodjo M, Hoffmann R. Added value of diffusion-weighted imaging in hepatic tumors and its impact on patient management. Cancer Imaging 2018; 18:10. [DOI] [PMC free article] [PubMed] [Google Scholar]
- 2.Lewis S, Besa C, Wagner M, et al. Prediction of the histopathologic findings of intrahepatic cholangiocarcinoma: qualitative and quantitative assessment of diffusion-weighted imaging. Eur Radiol 2018; 28:2047–2057. [DOI] [PubMed] [Google Scholar]
- 3.Kovač JD, Galun D, Đurić-Stefanović A, et al. Intrahepatic mass-forming cholangiocarcinoma and solitary hypovascular liver metastases: is the differential diagnosis using diffusion-weighted MRI possible? Acta Radiol 2017; 58:1417–1426. [DOI] [PubMed] [Google Scholar]
- 4.Nam SJ, Yu JS, Cho ES, Kim JH, Chung JJ. High-flow haemangiomas versus hypervascular hepatocellular carcinoma showing “pseudo-washout” on gadoxetic acid-enhanced hepatic MRI: value of diffusion-weighted imaging in the differential diagnosis of small lesions. Clin Radiol 2017; 72:247–254. [DOI] [PubMed] [Google Scholar]
- 5.Kwee TC, Takahara T, Niwa T, et al. Influence of cardiac motion on diffusion-weighted magnetic resonance imaging of the liver. MAGMA 2009; 22:319–325. [DOI] [PubMed] [Google Scholar]
- 6.Kandpal H, Sharma R, Madhusudhan KS, Kapoor KS. Respiratory-triggered versus breath-hold diffusion-weighted MRI of liver lesions: comparison of image quality and apparent diffusion coefficient values. AJR Am J Roentgenol 2009; 192:915–922. [DOI] [PubMed] [Google Scholar]
- 7.Han X, Dong Y, Xiu JJ, et al. Diffusion-weighted imaging for the left hepatic lobe has higher diagnostic accuracy for malignant focal liver lesions. Asian Pac J Cancer Prev 2014; 15:6155–6160. [DOI] [PubMed] [Google Scholar]
- 8.Koinuma M, Ohashi I, Hanafusa K, Shibuya H. Apparent diffusion coefficient measurements with diffusion-weighted magnetic resonance imaging for evaluation of hepatic fibrosis. J Magn Reson Imaging 2005; 22:80–85. [DOI] [PubMed] [Google Scholar]
- 9.Lewin M, Poujol-Robert A, Boëlle PY, et al. Diffusion-weighted magnetic resonance imaging for the assessment of fibrosis in chronic hepatitis C. Hepatology 2007; 46:658–665. [DOI] [PubMed] [Google Scholar]
- 10.Ogihara Y, Kitazume Y, Iwasa Y, et al. Prediction of histological grade of hepatocellular carcinoma using quantitative diffusion-weighted MRI: a retrospective multivendor study. Br J Radiol 2018; 91:20170728. [DOI] [PMC free article] [PubMed] [Google Scholar]
- 11.Jiang T, Xu JH, Zou Y, et al. Diffusion-weighted imaging (DWI) of hepatocellular carcinomas: a retrospective analysis of the correlation between qualitative and quantitative DWI and tumour grade. Clin Radiol 2017; 72:465–472. [DOI] [PubMed] [Google Scholar]
- 12.Mürtz P, Flacke S, Träber F, van den Brink JS, Gieseke J, Schild HH. Abdomen: diffusion-weighted MR imaging with pulse-triggered single-shot sequences. Radiology 2002; 224:258–264. [DOI] [PubMed] [Google Scholar]
- 13.Murphy P, Wolfson T, Gamst A, Sirlin C, Bydder M. Error model for reduction of cardiac and respiratory motion effects in quantitative liver DW-MRI. Magn Reson Med 2013; 70:1460–1469. [DOI] [PMC free article] [PubMed] [Google Scholar]
- 14.Nasu K, Kuroki Y, Fujii H, Minami M. Hepatic pseudo-anisotropy: a specific artifact in hepatic diffusion-weighted images obtained with respiratory triggering. MAGMA 2007; 20:205–211. [DOI] [PubMed] [Google Scholar]
- 15.Chen X, Qin L, Pan D, et al. Liver diffusion-weighted MR imaging: reproducibility comparison of ADC measurements obtained with multiple breath-hold, free-breathing, respiratory-triggered, and navigator-triggered techniques. Radiology 2014; 271:113–125. [DOI] [PubMed] [Google Scholar]


