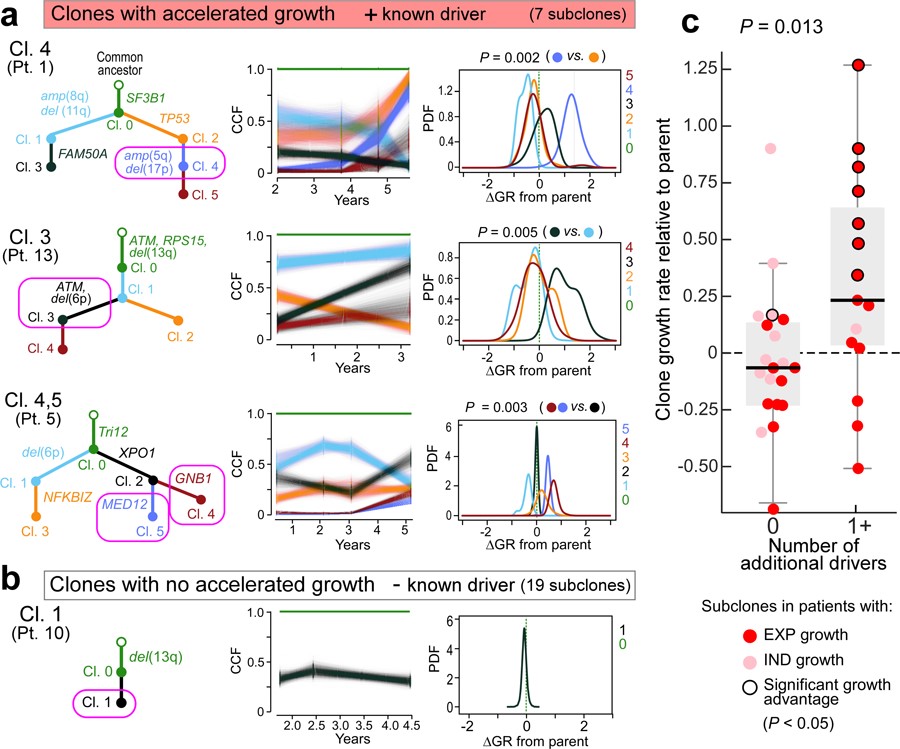
Figure 5. Selective growth advantage of subclones in CLL.

Examples for subclones (magenta circles) with a, significant growth advantage relative to their parent and known drivers and b, a subclone without driver and no growth acceleration. Results from PhylogicNDT analysis include: most likely phylogenetic tree (left); permutations of sSNVs during tree construction yielding posterior CCFs of the clusters (with 95% credible intervals) (middle); and growth rates relative to parental clones (right). Significance of differential growth rate (ΔGR>0) was estimated based on the MCMC. c, Linear mixed model for difference between clones without (n=20) and with (n=15) putative CLL drivers. Black outline - significant growth advantage. Horizontal black line indicates median values, with whiskers extending to minimum and maximum values on the boxplots.
