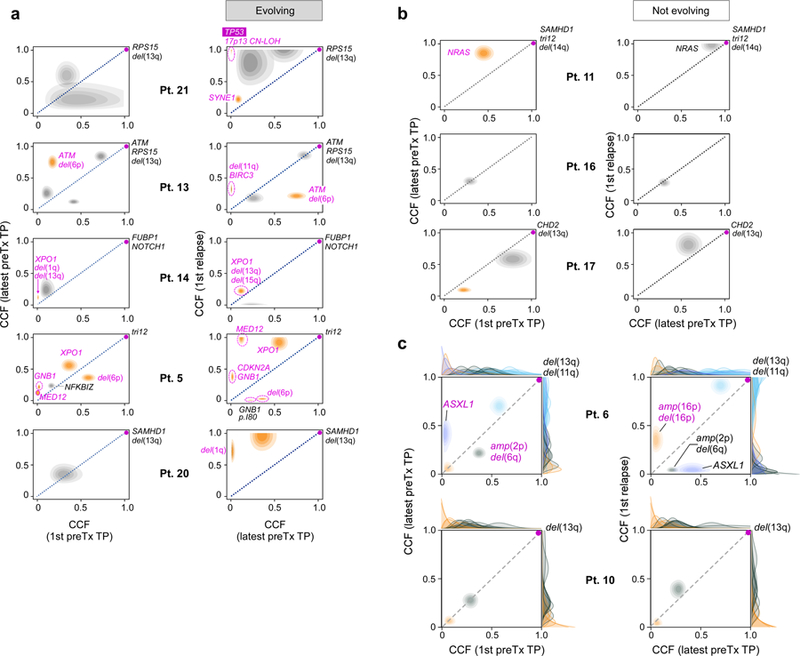
Extended Data Figure 4. Assessment of evolutionary dynamics using sample pairs.

Changes of cancer cell fraction (CCF) of subclones represented as two-dimensional pair-wise plots of multi-sample clustering results. Samples at a timepoint (TP) closest to diagnosis (1st) vs the last sample before treatment (preTx) are shown in the left column, samples at last timepoint before and first timepoint after treatment are shown in the right column. Patients are grouped based on those having: a, subclones with significant evolution b, subclones that maintain interclonal balance. Significantly evolving subclones are indicated in orange (Methods), expanding CLL driver mutations are labelled (magenta). c, Examples of genetic evolution from first to last pre-treatment timepoints, and from pre-treatment to relapse samples for Patient 6 (with significant evolution) and Patient 10 (not evolving). Shown are 2D-distributions that reflect the average of the positional distributions of the cluster centres along the MCMC iterations, rather than the final posterior for the cluster centre, which is determined by the normalized product of the pre-clustered distributions of the mutations that were finally assigned to each cluster. Marginal distributions (on the x and y axes) depict the CCF distributions before clustering for each individual mutation. Final cluster assignment is indicated by the colour.
