Abstract
Aim:
Eosinophilic asthma is associated with more exacerbations and differential responses to treatment. The aim of this study was to assess if CLC/Gal-10 and MBP-1 are surrogate biomarkers of eosinophilic inflammation in asthma.
Methods & results:
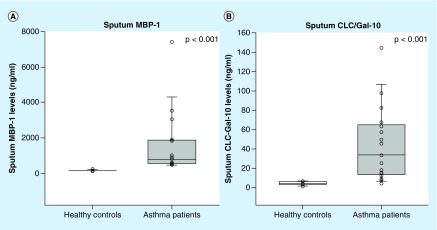
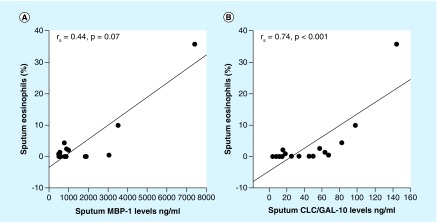
Sputum induction was performed in patients with asthma and in healthy controls. Sputum analysis revealed higher (p < 0.001) levels of CLC/Gal-10 and MBP-1 in asthmatics versus healthy controls. CLC/Gal-10 levels were highly correlated (rs = 0.74; p < 0.001) with sputum eosinophils; MBP-1 approached significance (r = 0.44; p = 0.07).
Conclusion:
Increased CLC/Gal-10 and MBP-1 levels in the sputum were strongly correlated with sputum eosinophils in patients with asthma. CLC/Gal-10 and MBP-1 may be useful biomarkers for differentiation of eosinophilic airway inflammation in asthma.
Keywords: : asthma, biomarker, eosinophil, sputum
Asthma is a chronic disorder of the airways – characterized by reversible and intermittent airway obstruction, airway inflammation and hyperreactivity of the airways [1]. Regardless of the advances in the diagnosis and treatment of asthma, it continues to be one of the most prevalent chronic respiratory disorders, affecting 8–10% of the world’s population.
Over the past two decades, the heterogeneity of asthma has become apparent. Experts have begun to propose different methods of classifying asthma using both phenotypic characterization or clustering as well as endotypic classification based on the distinct pathophysiologic mechanisms [2,3]. One commonly used method to characterize asthma phenotypes is by assessing the predominant pattern of airway inflammation (eosinophilic vs noneosinophilic) [4]. Recently, McGrath and colleagues found that a little over half of mild to moderate asthma patients were predominantly eosinophilic (based on ≥2% sputum eosinophils) [5]. Identification of these airway inflammatory phenotypes in asthma is significant as they impact the response to asthma therapies, predict the risk for asthma exacerbations and allow for better application of newer therapies [6–10]. With the importance of these phenotypes being realized, biomarkers that can accurately and rapidly identify them are needed to guide personalized therapies.
Surrogate biomarkers of eosinophilic airway inflammation have been measured in the blood, nasal aspirates, exhaled air and induced sputum of patients with asthma [11]. While blood and fractionated exhaled nitric oxide can be easily measured, its correlation with sputum eosinophils has been mixed [5]. Although blood and sputum eosinophil counts correlate in asthma patients, sputum eosinophilia is more predictable than blood eosinophils for exacerbations and remains the gold standard of airway inflammatory measurements in the outpatient setting [12–14]. However, these cell counts are labor intensive. Recently, eosinophil products such as eosinophil peroxidase have been shown to be a surrogate marker of airway eosinophils [15].
Charcot–Leyden crystal protein (CLC)/al-10 and MBP-1 are two major eosinophil-derived cytosolic and granule constituents, that have been associated with asthma and allergic rhinitis, respectively [16–18]. One recent study reported that CLC/Gal-10, as measured by western blotting, correlated with the numbers of sputum eosinophils [19]. We have developed a sandwich-based ELISA to quantitatively measure CLC/Gal-10 and MBP-1 in human esophageal samples [20]. We therefore examined whether CLC/Gal-10 and MBP-1 could be measured by ELISA in sputum samples of healthy controls and patients with asthma and serve as surrogate biomarkers of eosinophilic airway inflammation in patients with asthma.
Patients & methods
Study population
Participants were recruited from the University of Illinois Hospital and Health Sciences System and University of Illinois at Chicago, and included patients with asthma and healthy controls. Asthma patients were from two cohorts of patients. Asthma patients were identified either in response to advertisement flyers or by their physician during an outpatient encounter. The diagnosis of asthma in both cohorts included documentation of asthma in the electronic medical record within the past 24 months. In one of the cohorts, diagnostic testing was performed and included measurement of bronchial hyper-responsiveness (spirometry pre- and post-bronchodilators or methacholine challenge). Eligibility criteria included evidence of reversibility in pre-bronchodilator forced expiratory volume in 1 s (FEV1) of 12% and an absolute volume of 200 ml; or PC20 of <8 mg/ml on methacholine challenge either from study testing or based on previously documented testing (Box 1). Exclusion criteria for all patients were if they had a previous smoking history >10 pack-years or smoking within the past year, had a healthcare provider diagnosis of COPD (chronic obstructive pulmonary disease), were unable to perform spirometry, pregnant, or used oral corticosteroids within the past 12 weeks. All patients had the following information collected: anthropometrics (age, gender, body mass index), FEV1% predicted and induced sputum. The FEV1% predicted values were corrected for race/ethnicity. The research was carried out according to The Code of Ethics of the World Medical Association (Declaration of Helsinki), informed written consent was obtained from all participants, and the study was approved by the University of Illinois at Chicago Institutional Review Board.
Box 1. Diagnostic tests used for asthma diagnosis.
Documentation of asthma in the electronic medical record within the past 24 months†,‡
Spirometry pre- and post-bronchodilator (four puffs of albuterol)†
Methacholine challenge test§,†
†Cohort 1.
‡Cohort 2.
§Methacholine challenge test was performed only if no evidence of reversibility (12% and 200 ml change in forced expiratory volume in 1 s (FEV1)% predicted and FEV1, respectively) was found in spirometry.
Sputum induction & processing
Sputum collection was performed as previously described [21,22]. Cell differentials of the sputum samples (eosinophils, neutrophils, macrophages, epithelial cells and lymphocytes) were calculated as a percentage of cells in the whole sputum expectorate. If a sputum sample contained more the 80% squamous epithelial cells, it was not included in the analysis. The sputum supernatants were stored at -80°C until assayed by ELISA for CLC/Gal-10 and MBP-1. While different cut-off points for sputum eosinophilia are described in the literature and range from 2–3% eosinophils, we utilized the 2% cut-off for eosinophils based on the recommendations of a NIH Biomarkers expert panel [23]. Patients with ≥2% sputum eosinophils were classified as being eosinophilic, and patients with <2% sputum eosinophils were classified as being noneosinophilic [23].
Quantitative measurement of CLC/Gal-10 & MBP-1
Double-antibody sandwich ELISAs for CLC/Gal-10 and MBP-1 were developed and standardized in the Ackerman laboratory (IL, USA) [20]. CLC/Gal-10 and MBP-1 ELISAs used standard curves generated using native purified eosinophil-derived proteins [24–27]. The CLC/Gal-10 sandwich ELISA used a commercially available monoclonal capture antibody (mouse antihuman Gal-10/CLC; Cell Sciences, MA, USA); the detection antibody was a CLC/Gal-10 affinity purified rabbit polyclonal antibody as previously described [25]. The ELISAs for CLC/Gal-10 and MBP-1 detected these biomarkers in the ranges of 0.125–16 ng/ml and 11.8–750 ng/ml respectively. As previously described, recovery experiments were performed using native crystal-derived CLC/Gal-10 and purified MBP1, and spiking was done at low, medium and high concentrations within the range of the standard curves. Recovery rates of 100–120% for CLC/Gal-10 and 80–100% for MBP-1 were obtained with signal to noise ratios >5 and coefficients of variation of approximately 15% [20]. The sputum extracts were diluted equivalently for all subjects to fall within the acceptable range of the standard curves, unless the biomarker level was sufficiently high to require further dilution or sufficiently low to require less dilution.
Statistical analyses
Means and standard deviation (SDs) or medians and interquartile ranges were used as appropriate to report continuous variables. Frequencies and percentages were used to report categorical variables. Group differences were analyzed using two-sample t-tests; Wilcoxon rank sum tests, Fisher exact tests or χ2 tests, where appropriate. A two-tailed p-value <0.05 was used to denote statistically significant differences. Correlations were evaluated by Spearman’s correlation coefficient. A receiver operating characteristic curve analysis was used to select cutoff values for CLC/Gal-10 and MBP-1 that maximized sensitivity and specificity. Analyses were performed using Systat version 11 (CA, USA) statistical software.
Results
Patient characteristics
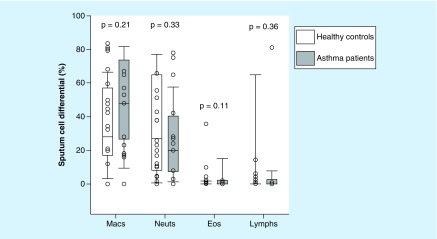
Assessments of CLC/Gal-10 and MBP-1 in the sputum were performed in 29 patients. A total of 18 patients had mild to moderate persistent asthma and 11 patients acted as healthy controls. Asthma patients had a significantly lower FEV1% predicted compared with healthy control patients (76 vs 89%; p = 0.02; Table 1). There was no difference in the age, gender and BMI of healthy controls and asthma patients. There were a greater number of African–American asthma patients (n = 12) compared with the healthy controls (n = 2; p = 0.007). Total 88% (n = 15) of asthma patients were prescribed inhaled corticosteroids (ICS). The mean ICS dose (fluticasone equivalent) of asthma patients was 519 ± 285 mcg/day. The mean sputum eosinophil count did not achieve statistical significance between asthma patients versus healthy controls (3.2% ± 8 vs 0.3% ± 0.6; p = 0.11; Figure 1). Total 35% (n = 6) of asthma patients exhibited an eosinophilic phenotype (≥2% sputum eosinophils) compared with 9% (n = 1) of the healthy control patients (p = 0.12).
Table 1. . Patient characteristics.
| Demographics and asthma characteristics | Healthy controls (n = 11) | Asthma patients (n = 17) | p-value |
|---|---|---|---|
| Age (years) | 33 ± 13 | 42 ± 15 | 0.15 |
| Female, n (%) | 8 (73) | 13 (76) | 0.82 |
| Race, n (%): | |||
| – Caucasian | 9 (82) | 5 (30) | 0.007 |
| – African–American | 2 (18) | 12 (70) | 0.007 |
| BMI (kg/m2) | 28 ± 9 | 31 ± 8 | 0.38 |
| FEV1% predicted† | 89 ± 10 | 76 ± 15 | 0.02 |
| ICS use (%) | N/A | 88 | – |
| Asthma control test | N/A | 19 ± 4 | – |
| Eosinophilic inflammation‡ (%) | 9 | 35 | 0.12 |
Mean ± standard deviation unless otherwise noted.
Reported values were corrected for race/ethnicity.
≥2% sputum eosinophils.
FEV1: Forced expiratory volume in 1 s; ICS: Inhaled corticosteroid.
Figure 1. . Box-whisker plots of sputum cell differential in healthy controls (white bar; n = 11) and asthma patients (gray bars; n = 17).
Eos: Eosinophils; Lymphs: Lymphocytes; Macs: Macrophages; Neuts: Neutrophils.
Measurement of CLC/Gal-10 & MBP-1 in induced sputum
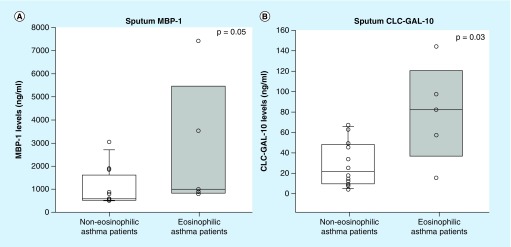
The induced sputum of asthma patients contained significantly higher levels of both CLC/Gal-10 and MBP-1 compared with healthy controls (34 vs 4 ng/ml; p < 0.001, Figure 2A; 794 vs 137 ng/ml; p < 0.001, Figure 2B), respectively. Asthma patients with eosinophilic inflammation (≥2% sputum eosinophils) had significantly higher levels of CLC/Gal-10 (82 vs 22 ng/ml; p = 0.03) compared with asthma patients with noneosinophilic inflammation (Figure 3A). MBP-1 levels in asthma patients with the eosinophilic phenotype were higher, just reaching statistical significance (1000 vs 580 ng/ml; p = 0.05; Figure 3B).
Figure 2. . Box-whisker plots of sputum eosinophil biomarkers of healthy controls (white bars; n = 11) and asthma patients (gray bars; n = 17).
(A) Sputum MBP-1 was measured by sandwich ELISA. Asthma patients had significantly higher levels of MBP-1 compared with healthy controls. (B) Sputum CLC/Gal-10 was measured by sandwich ELISA. Asthma patients had significantly higher levels of CLC/Gal-10 compared with healthy controls.
Figure 3. . Box-whisker plots of sputum eosinophil biomarkers CLC/Gal-10 and MBP-1 in noneosinophilic (n = 11; sputum eosinophils <2%) and eosinophilic (n = 6; sputum eosinophils ≥2%) asthma patients.
(A) Eosinophilic asthma patients (white) with significantly higher sputum MBP-1 levels than noneosinophilic asthma patients (gray). (B) Eosinophilic asthma patients (gray) with significantly higher sputum CLC/Gal-10 levels than noneosinophilic asthma patients (white).
Correlation between sputum eosinophil markers & sputum cell counts
Sputum CLC/Gal-10 levels were strongly correlated with sputum eosinophils % (rs = 0.74; p < 0.001; Figure 4A). In contrast, sputum MBP-1 levels did not correlate with sputum eosinophils % (rs = 0.4; p = 0.07; Figure 4B). The CLC/Gal-10 and MBP-1 levels strongly correlated with each other (rs = 0.71; p = 0.001). There was no correlation of sputum CLC/Gal-10 or MBP-1 concentration with any other sputum cell type (macrophages, neutrophils or lymphocytes; data not shown).
Figure 4. . Spearman correlation of sputum eosinophils with sputum CLC/Gal-10 and MBP-1 levels in asthma patients.
(A) Sputum MBP-1 levels in asthma patients trended toward a positive correlation with sputum eosinophil levels. (B) Sputum CLC/Gal-10 levels in asthma patients strongly correlated with sputum eosinophil levels.
Receiver operating characteristics
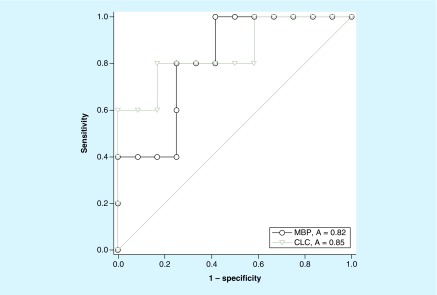
To measure the diagnostic accuracy of CLC/Gal-10 and MBP-1, a receiver operating characteristic analysis was performed. CLC/Gal-10 as a biomarker, exhibited a high predictive ability in discriminating between eosinophilic and noneosinophilic airway inflammation in asthma patients (AUC = 0.85; p-value = 0.03; Figure 5). MBP-1 also showed a significant but slightly lower predictive ability with AUC = 0.82 (p = 0.048; Figure 5).
Figure 5. . Receiver operating characteristic analysis of sputum CLC/Gal-10 (gray) and MBP-1 (black) levels in asthma patients.
Discussion
In this pilot study of healthy control and asthma patients, we found that quantitative measurement of CLC/Gal-10 and MBP-1 in induced sputum is feasible, eosinophilic asthma patients expressed higher levels of CLC/Gal-10 and MBP-1 in induced sputum compared with noneosinophilic patients, and sputum eosinophils were highly correlated with CLC/Gal-10 sputum levels.
These findings significantly add to the limited existing literature on CLC/Gal-10 in asthma [16,19]. One of the earliest studies, by Dor and colleagues, found increased CLC/Gal-10 levels in induced sputum of asthma patients, although comparison with eosinophilic airway inflammation was not included [16]. A more recent study measuring sputum eosinophils showed a strong correlation with CLC/Gal-10, but a semiquantitative method (western blot) was used to measure sputum CLC/Gal-10 levels [19]. CLC/Gal-10 was also recently identified as one of six biomarkers in a sputum gene expression signature that discriminates inflammatory phenotypes of asthma and predicts ICS treatment response [28]. In the present study, we used a reproducible quantitative immunoassay for measurement of CLC/Gal-10 and MBP-1 that should allow for better clinical application of these biomarkers. These immunoassays have been used to quantitate CLC/Gal-10 and MBP-1 levels in another eosinophil-associated allergic disease, eosinophilic esophagitis [20]. Furuta and colleagues measured eosinophil-derived protein biomarkers in the esophagus (luminal effluents eluted from Esophageal String Test samples and extracts of mucosal biopsies) of eosinophilic esophagitis patients and found that CLC/Gal-10, among a panel of eosinophil granule-associated protein biomarkers measured, correlated best with the numbers of eosinophils/high-power field in the esophagus [20]. Our findings extend what has been shown in terms of the utility of CLC/Gal-10 and MBP-1 as biomarkers of tissue eosinophils in other eosinophil-associated allergic diseases such as eosinophilic esophagitis; these biomarkers may become useful as well in differentiating eosinophilic from noneosinophilic and other asthma phenotypes. The treatment of asthma is becoming more targeted based on both asthma phenotypes and endotypes, and therapies targeting IgE, IL-5, IL-5 receptor and IL-4 receptor subunits are being used [29]. While these treatments rely on serum IgE levels or blood eosinophil counts to initiate therapy, they often are not used to monitor treatment response. While the sputum eosinophil count is currently the optimal noninvasive measurement of the airway inflammatory phenotype and exacerbations, it is not widely available and highly variable from lab to lab [30,31]. Using a surrogate biomarker of sputum eosinophils such as sputum, CLC/Gal-10 may provide a better way to monitor patient responses to biologic treatments that target eosinophils.
In the current study, we found that sputum CLC/Gal-10 levels were correlated only with sputum eosinophils and not other inflammatory cells including macrophages, neutrophils and lymphocytes. Thus, CLC/Gal-10 appears to phenocopy the eosinophilic inflammatory pattern in the airway and should be an excellent surrogate biomarker for differentiating asthma inflammatory phenotypes. One limitation we recognize is that basophils and regulatory T cells also express CLC/Gal-10, albeit at much lower amounts than eosinophils [32–34], and we were not able to measure and correlate CLC/Gal-10 to those cell types in our study. The eosinophil produces other granule proteins including eosinophil cationic protein, eosinophil-derived neurotoxin and eosinophil peroxidase (EPX). Eosinophil-derived neurotoxin and eosinophil cationic protein are not as eosinophil specific as EPX, which has been shown to correlate closely with sputum eosinophil percentage in asthma patients with varying degrees of airway eosinophilia [15,35]. In this study, we did not measure EPX and additional studies are needed to jointly correlate CLC/Gal-10 and EPX with airway eosinophils.
In the current analysis, we included all comers that included a small number of patients not on ICS. The inclusion of these additional participants should not impact the significance of our study findings, as the study aim was to assess the correlation of these biomarkers to sputum eosinophils. Despite treatment with ICS, the study participants had elevated % eosinophils, CLC/Gal-10 and MBP-1. Some of the potential reasons for this could be due to medication adherence, which we did not assess, or by the predominance of African–American patients, which we have recently shown to have an eosinophilic asthma phenotype despite adherent ICS therapy [36]. As our sample size was small our findings may not be generalizable to all asthmatics and support the conduct of larger studies in asthma patients both on and off ICS with a race-matched control group and measures of ICS adherence to further validate our findings.
The CLC gene expression has been examined in eosinophilic asthma patients, and a reduction in expression has been shown with treatment of inhaled and oral corticosteroids [10,28]. This has yet to be assessed using a quantitative assay such as the one we report here. Future studies of CLC/Gal-10 will need to assess its utility in following asthma patient responses to biological therapeutics that specifically target eosinophils, for example, mepolizumab, reslizumab, benralizumab, and dupilimab. Elevations of CLC/Gal-10 mRNA have been found in the peripheral blood of aspirin sensitive asthma patients [37]. Whether CLC/Gal-10 could also be used as a biomarker for disease monitoring or biological outcomes of treatment in aspirin sensitive asthma patients is not known and should be evaluated.
Conclusion
In summary, we show the feasibility of using a quantitative assay to measure two eosinophil-associated biomarkers, CLC/Gal-10 and MBP-1 in the sputum of our asthma population. Using this method, we found a strong correlation of CLC/Gal-10 in the sputum with sputum eosinophil counts in asthma patients. Our findings provide the groundwork for further testing of CLC/Gal-10 and MBP-1 to be used as alternatives or in conjunction with other biomarkers such as absolute blood eosinophil counts. The measurement of sputum CLC/Gal-10 should be considered in future clinical trials that target eosinophilic asthma to evaluate the role it will likely have in the personalized, precision medical management of asthma.
Summary points.
Obtaining sputum eosinophils are labor intensive and not routinely obtained in clinical practice despite being the gold standard measurement of airway inflammation in the outpatient setting.
Eosinophil products, such as CLC/Gal-10 or MBP-1, may serve as surrogate markers of eosinophilic airway inflammation.
Quantitative measurement of CLC/Gal-10 and MBP-1 in induced sputum is feasible.
Asthma patients exhibited higher levels of CLC/Gal-10 and MBP-1 than nonasthmatic controls.
Eosinophilic asthma patients expressed higher levels of CLC/Gal-10 and MBP-1 in induced sputum compared with noneosinophilic patients.
Sputum eosinophils were highly correlated with CLC/Gal-10 sputum levels.
There was no correlation of sputum CLC/Gal-10 or MBP-1 concentration with any other sputum cell type.
CLC/Gal-10 and MBP-1 may be useful biomarkers for differentiation of eosinophilic airway inflammation in asthma.
Acknowledgments
We would like to thank M Morales-Perez, K Watson and the UIC CCTS Clinical Research Center staff for their assistance in patient recruitment, enrollment and study visit completion. We would also like to acknowledge the patients that participated in this study.
Footnotes
Financial & competing interests disclosure
SJ Ackerman is a co-founder and member of the board of managers of EnteroTrack, LLC, the start-up company that is developing biomarker immunoassays (ELISAs) for clinical use with the esophageal string test. American Academy of Allergy, Asthma, & Immunology/Association of Specialty Professors T. Franklin Williams Scholar, University of Illinois at Chicago Center for Clinical and Translational Science (CCTS), award number KL2RR029878 from the National Center For Research Resources, Campaign Urging Research for Eosinophilic Diseases (SJ Ackerman), American Partnership for Eosinophilic Disorders (SJ Ackerman) and NIH/NHLBI Training Grant T32HL082547 (BT Maybruck). The content is solely the responsibility of the authors and does not necessarily represent the official views of the National Center for Research Resources or the NIH. These funding agencies did not have any involvement in the study design; data collection, analysis and interpretation of data; writing the manuscript; or in the decision to submit the article for publication. The authors have no other relevant affiliations or financial involvement with any organization or entity with a financial interest in or financial conflict with the subject matter or materials discussed in the manuscript apart from those disclosed.
No writing assistance was utilized in the production of this manuscript.
Ethical conduct of research
The research was carried out according to The Code of Ethics of the World Medical Association (Declaration of Helsinki), informed written consent was obtained from all participants, and the study was approved by the University of Illinois at Chicago Institutional Review Board.
References
Papers of special note have been highlighted as: • of interest
- 1.Gaston MH, Porter GK, Thomas VG. Prime Time Sister Circles: evaluating a gender-specific, culturally relevant health intervention to decrease major risk factors in mid-life African-American women. J. Natl Med. Assoc. 99(4), 428–438 (2007). [PMC free article] [PubMed] [Google Scholar]
- 2.Wenzel SE. Asthma: defining of the persistent adult phenotypes. Lancet 368(9537), 804–813 (2006). [DOI] [PubMed] [Google Scholar]
- 3.Agache I, Akdis C, Jutel M, Virchow JC. Untangling asthma phenotypes and endotypes. Allergy 67(7), 835–846 (2012). [DOI] [PubMed] [Google Scholar]
- 4.Corren J. Asthma phenotypes and endotypes: an evolving paradigm for classification. Discov. Med. 15(83), 243–249 (2013). [PubMed] [Google Scholar]; • An introduction to defining asthma into phenotypes and endotypes.
- 5.McGrath KW, Icitovic N, Boushey HA. et al. A large subgroup of mild-to-moderate asthma is persistently non-eosinophilic. Am. J. Respir. Crit. Care Med. 185( 6), 612–619 (2012). [DOI] [PMC free article] [PubMed] [Google Scholar]
- 6.Haldar P, Brightling CE, Hargadon B. et al. Mepolizumab and exacerbations of refractory eosinophilic asthma. N. Engl. J. Med. 360(10), 973–984 (2009). [DOI] [PMC free article] [PubMed] [Google Scholar]
- 7.Nair P, Pizzichini MMM, Kjarsgaard M. et al. Mepolizumab for prednisone-dependent asthma with sputum eosinophilia. N. Engl. J. Med. 360(10), 985–993 (2009). [DOI] [PubMed] [Google Scholar]
- 8.Green RH, Brightling CE, McKenna S. et al. Asthma exacerbations and sputum eosinophil counts: a randomised controlled trial. Lancet 360(9347), 1715–1721 (2002). [DOI] [PubMed] [Google Scholar]
- 9.Campo P, Rodriguez F, Sanchez-Garcia S. et al. Phenotypes and endotypes of uncontrolled severe asthma: new treatments. J. Investig. Allergol. Clin. Immunol. 23(2), 76–88 (2013). [PubMed] [Google Scholar]
- 10.Berthon BS, Gibson PG, Wood LG, Macdonald-Wicks LK, Baines KJ. A sputum gene expression signature predicts oral corticosteroid response in asthma. Eur. Respir. J. 49(6), 1700180 (2017). [DOI] [PubMed] [Google Scholar]
- 11.Ochkur SI, Kim JD, Protheroe CA. et al. A sensitive high throughput ELISA for human eosinophil peroxidase: a specific assay to quantify eosinophil degranulation from patient-derived sources. J. Immunol. Methods 384(1–2), 10–20 (2012). [DOI] [PMC free article] [PubMed] [Google Scholar]
- 12.Pin I, Gibson PG, Kolendowicz R. et al. Use of induced sputum cell counts to investigate airway inflammation in asthma. Thorax 47(1), 25–29 (1992). [DOI] [PMC free article] [PubMed] [Google Scholar]
- 13.Thomas PS, Yates DH, Barnes PJ. Sputum induction as a method of analyzing pulmonary cells: reproducibility and acceptability. J. Asthma 36(4), 335–341 (1999). [DOI] [PubMed] [Google Scholar]
- 14.Pizzichini E, Pizzichini MM, Efthimiadis A, Dolovich J, Hargreave FE. Measuring airway inflammation in asthma: eosinophils and eosinophilic cationic protein in induced sputum compared with peripheral blood. J. Allergy Clin. Immunol. 99(4), 539–544 (1997). [DOI] [PubMed] [Google Scholar]
- 15.Nair P, Ochkur SI, Protheroe C. et al. Eosinophil peroxidase in sputum represents a unique biomarker of airway eosinophilia. Allergy 68(9), 1177–1184 (2013). [DOI] [PMC free article] [PubMed] [Google Scholar]
- 16.Dor PJ, Ackerman SJ, Gleich GJ. Charcot–Leyden crystal protein and eosinophil granule major basic-protein in sputum of patients with respiratory-diseases. Am. Rev. Respir. Dis. 130(6), 1072–1077 (1984). [DOI] [PubMed] [Google Scholar]; • The first study to examine Charcot–Leyden crystal protein in the sputum of patients with asthma. Charcot–Leyden crystal protein was associated with asthma.
- 17.Bryborn M, Hallden C, Sall T, Cardell LO. CLC – a novel susceptibility gene for allergic rhinitis? Allergy 65(2), 220–228 (2010). [DOI] [PubMed] [Google Scholar]
- 18.Ghafouri B, Irander K, Lindbom J, Tagesson C, Lindahl M. Comparative proteomics of nasal fluid in seasonal allergic rhinitis. J. Proteome Res. 5(2), 330–338 (2006). [DOI] [PubMed] [Google Scholar]
- 19.Chua JC, Douglass JA, Gillman A, O'Hehir RE, Meeusen EN. Galectin-10, a potential biomarker of eosinophilic airway inflammation. PLoS ONE 7(8), e42549 (2012). [DOI] [PMC free article] [PubMed] [Google Scholar]
- 20.Furuta GT, Kagalwalla AF, Lee JJ. et al. The oesophageal string test: a novel, minimally invasive method measures mucosal inflammation in eosinophilic oesophagitis. Gut 62(10), 1395–1405 (2013). [DOI] [PMC free article] [PubMed] [Google Scholar]; • A description of the development of the double-antibody sandwich ELISAs for CLC/Gal-10 and MBP-1.
- 21.Martin RJ, Kephart DK, Dyer AM, Fahy J, Kraft M; Asthma Clinical Research Network. Quality control within the asthma clinical research network. Control.Clin. Trials 22(6), S207–S221 (2001). [DOI] [PubMed] [Google Scholar]
- 22.Gershman NH, Wong HH, Liu JT, Mahlmeister MJ, Fahy JV. Comparison of two methods of collecting induced sputum in asthmatic subjects. Eur. Respir. J. 9(12), 2448–2453 (1996). [DOI] [PubMed] [Google Scholar]
- 23.Szefler SJ, Wenzel S, Brown R. et al. Asthma outcomes: biomarkers. J. Allergy Clin. Immunol. 129(Suppl. 3), S9–S23 (2012). [DOI] [PMC free article] [PubMed] [Google Scholar]
- 24.Ackerman SJ, Corrette SE, Rosenberg HF. et al. Molecular-cloning and characterization of human eosinophil Charcot–Leyden crystal protein (lysophospholipase) – similarities to IgE-binding proteins and the s-type animal lectin superfamily. J. Immunol. 150(2), 456–468 (1993). [PubMed] [Google Scholar]
- 25.Ackerman SJ, Liu L, Kwatia MA. et al. Charcot–Leyden crystal protein (galectin-10) is not a dual function galectin with lysophospholipase activity but binds a lysophospholipase inhibitor in a novel structural fashion. J. Biol. Chem. 277(17), 14859–14868 (2002). [DOI] [PubMed] [Google Scholar]
- 26.Ackerman SJ, Loegering DA, Venge P. et al. Distinctive cationic proteins of the human eosinophil granule – major basic-protein, eosinophil cationic protein, and eosinophil-derived neurotoxin. J. Immunol. 131(6), 2977–2982 (1983). [PubMed] [Google Scholar]
- 27.Swaminathan GJ, Weaver AJ, Loegering DA. et al. Crystal structure of the eosinophil major basic protein at 1.8 angstrom – an atypical lectin with a paradigm shift in specificity. J. Biol. Chem. 276(28), 26197–26203 (2001). [DOI] [PubMed] [Google Scholar]
- 28.Baines KJ, Simpson JL, Wood LG. et al. Sputum gene expression signature of 6 biomarkers discriminates asthma inflammatory phenotypes. J. Allergy Clin. Immunol. 133(4), 997–1007 (2014). [DOI] [PubMed] [Google Scholar]
- 29.Fajt ML, Wenzel SE. Asthma phenotypes and the use of biologic medications in asthma and allergic disease: the next steps toward personalized care. J. Allergy Clin. Immunol. 135(2), 299–310 (2015). [DOI] [PubMed] [Google Scholar]; • A review of the molecular phenotypes of asthma and how these can be used to predict response to therapy.
- 30.Bakakos P, Schleich F, Alchanatis M, Louis R. Induced sputum in asthma: from bench to bedside. Curr. Med. Chem. 18(10), 1415–1422 (2011). [DOI] [PubMed] [Google Scholar]
- 31.Berry A, Busse WW. Biomarkers in asthmatic patients: has their time come to direct treatment? J. Allergy Clin. Immunol. 137(5), 1317–1324 (2016). [DOI] [PubMed] [Google Scholar]; • A review of the current use of biomarkers for the diagnosis of asthma, triaging the severity of a patient’s disease and the potential efficacy of treatments.
- 32.Acharya KR, Ackerman SJ. Eosinophil granule proteins: form and function. J. Biol. Chem. 289(25), 17406–17415 (2014). [DOI] [PMC free article] [PubMed] [Google Scholar]; • A review of the key molecular aspects of eosinophil-derived granule proteins in terms of structure-function relationships to advance understanding of their roles in eosinophil cell biology, molecular biology, and immunobiology in health and disease.
- 33.Ackerman SJ, Weil GJ, Gleich GJ. Formation of Charcot–Leyden crystals by human basophils. J. Exp. Med. 155(6), 1597–1609 (1982). [DOI] [PMC free article] [PubMed] [Google Scholar]
- 34.Kubach J, Lutter P, Bopp T. et al. Human CD4+CD25+ regulatory T cells: proteome analysis identifies galectin-10 as a novel marker essential for their anergy and suppressive function. Blood 110(5), 1550–1558 (2007). [DOI] [PubMed] [Google Scholar]
- 35.Ochkur SI, Kim JD, Protheroe CA. et al. The development of a sensitive and specific ELISA for mouse eosinophil peroxidase: assessment of eosinophil degranulation ex vivo and in models of human disease. J. Immunol. Methods 375(1–2), 138–147 (2012). [DOI] [PMC free article] [PubMed] [Google Scholar]
- 36.Nyenhuis SM, Krishnan JA, Berry A. et al. Race is associated with differences in airway inflammation in patients with asthma. J. Allergy Clin. Immunol. 140(1), 257–265 (2016). [DOI] [PMC free article] [PubMed] [Google Scholar]
- 37.Devouassoux G, Pachot A, Laforest L. et al. Galectin-10 mRNA is overexpressed in peripheral blood of aspirin-induced asthma. Allergy 63(1), 125–131 (2008). [DOI] [PubMed] [Google Scholar]


