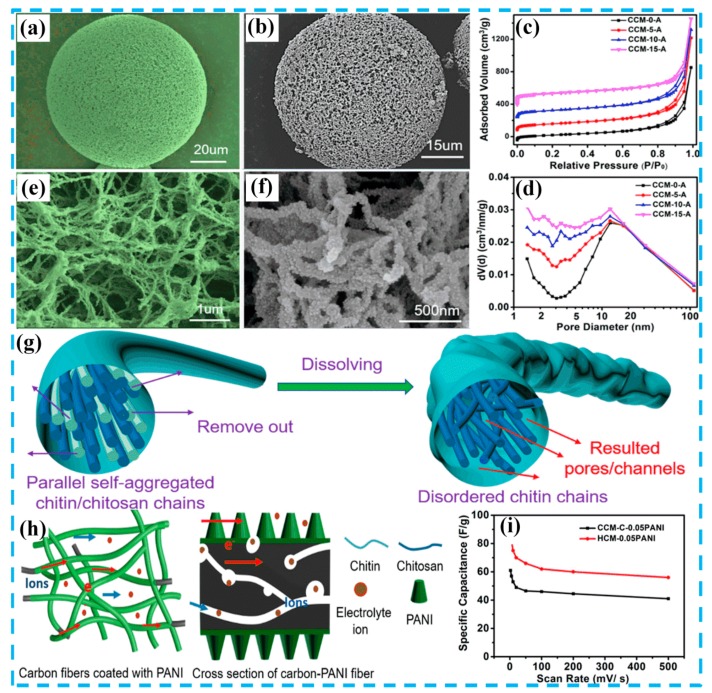
Figure 3.
(a,e) SEM images of chitin/chitosan microspheres (CCMs); (b,f) SEM images of CCMs/PANI; (c) nitrogen adsorption and desorption isotherms; (d) Barrett−Joyner−Halendar (BJH) pore size distribution samples; (g) graphical illustrations for the change of nanofibers during the acid treatment process; (h) graphical illustrations of the formation process for CCM/PANI; (i) specific capacitance based on the total mass of the two electrodes at different scan rates. Reproduced with permission from Reference [37], copyright American Chemical Society, 2018.

