

Summary
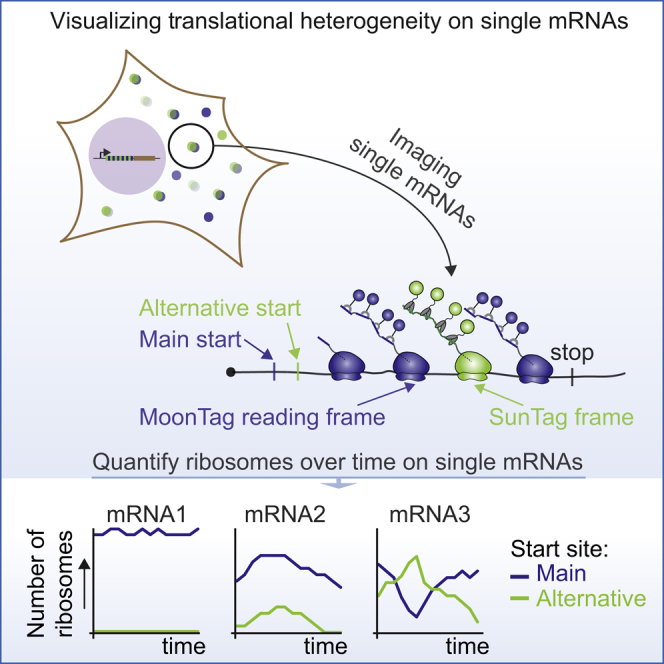
mRNA translation is a key step in decoding genetic information. Genetic decoding is surprisingly heterogeneous because multiple distinct polypeptides can be synthesized from a single mRNA sequence. To study translational heterogeneity, we developed the MoonTag, a fluorescence labeling system to visualize translation of single mRNAs. When combined with the orthogonal SunTag system, the MoonTag enables dual readouts of translation, greatly expanding the possibilities to interrogate complex translational heterogeneity. By placing MoonTag and SunTag sequences in different translation reading frames, each driven by distinct translation start sites, start site selection of individual ribosomes can be visualized in real time. We find that start site selection is largely stochastic but that the probability of using a particular start site differs among mRNA molecules and can be dynamically regulated over time. This study provides key insights into translation start site selection heterogeneity and provides a powerful toolbox to visualize complex translation dynamics.
Graphical Abstract
Highlights
-
•
Development of MoonTag, a fluorescence labeling system to visualize translation
-
•
Combining MoonTag and SunTag enables visualization of translational heterogeneity
-
•
mRNAs from a single gene vary in initiation frequency at different start sites
-
•
Ribosomes take many different “paths” along the 5′ UTR of a single mRNA molecule
The MoonTag system is a fluorescence labeling system for visualizing translation of single mRNA molecules in live cells. Combining the MoonTag system with the orthogonal SunTag system enables simultaneous measurements of translation of two open reading frames in an mRNA and reveals that ribosomes differentially decode individual mRNA molecules.
Introduction
Translation of mRNAs by ribosomes is a key step in decoding the genetic information stored in DNA and mRNA, and regulation of translation plays an important role in shaping the proteome (Hinnebusch et al., 2016, Schwanhäusser et al., 2009). Typically, translation initiates at the most upstream (i.e., the most 5′) translation start codon, usually an AUG codon, and then continues in the same reading frame until it encounters the first in-frame stop codon (here referred to as canonical translation). However, more recent work has shown that translation of many if not most mRNAs is far more complex and that different regions of an mRNA can be translated. For example, many mRNAs contain multiple open reading frames, including upstream open reading frames (uORFs), which are short ORFs upstream of the “main” ORF that generally repress translation of the main ORF (Calvo et al., 2009, Johnstone et al., 2016). Moreover, ribosomes can translate each nucleotide sequence in 3 different reading frames, resulting in 3 completely unrelated polypeptides (Atkins et al., 2016). Ribosomes translating some eukaryotic or viral RNAs can also undergo frameshifting, changing the reading frame during translation elongation (Dinman, 2012, Dunkle and Dunham, 2015). Finally, ribosomes can bypass stop codons under certain conditions to generate C-terminally extended proteins (Dunn et al., 2013, Schueren and Thoms, 2016). Although many examples are known where non-canonical translation occurs productively to generate functional proteome diversity (Barbosa et al., 2013, Dinman, 2012), it is important to note that non-canonical translation may also occur inappropriately because of errors in translation (Barbosa et al., 2013, Gao et al., 2017). Such errors likely result in synthesis of misfolded and/or dysfunctional polypeptides, which may inhibit the function of the natively folded protein and can cause proteotoxic stress to the cell.
Selection of the correct translation start site is critical for determining the translated region of the mRNA. In eukaryotes, the translation start site is selected during a process in which the 43S translation pre-initiation complex, including the small ribosomal subunit, scans along the mRNA in a 5′-to-3′ direction in search of a start codon (Aitken and Lorsch, 2012, Hinnebusch et al., 2016). Identification of the correct start site by a scanning ribosome is complex because (1) many genes contain one or more AUG sequences in their 5′ UTR (Iacono et al., 2005); (2) translation can also initiate, albeit generally less efficiently, on near-cognate start codons (e.g., GUG or CUG) (Ingolia et al., 2011, Lee et al., 2012); (3) the canonical start site may not be recognized with 100% efficiency (Kozak, 1986, Lind and Åqvist, 2016); and (4) after translating a short ORF (e.g., a uORF), a ribosome can reinitiate translation at a downstream start site, initiating at multiple start sites on a single mRNA molecule (Calvo et al., 2009, Hinnebusch et al., 2016, Johnstone et al., 2016). An additional layer of complexity in selection of a start site is the existence of multiple different transcript isoforms for many genes. For example, alternative transcription start site (TSS) usage or alternative splicing could create different transcript isoforms, and some isoforms may contain translation start sites or translation regulatory elements that are not present in all isoforms (Wang et al., 2016b).
Although ensemble measurements have identified multiple translation start sites for many genes, it is currently unclear whether all start sites are used on each individual mRNA molecule, and if so, how their relative usage is regulated. In the simplest model, ribosomes initiate translation on each possible start site with a pre-defined probability, which depends on the sequence of the start codon and its local sequence context (i.e., Kozak consensus sequence). In this model, all possible start sites are used on each mRNA molecule, and translation start site selection by the scanning the pre-initiation complex is purely stochastic. Alternatively, relative start site usage could vary among different mRNA molecules originating from the same gene; for example, because of differences in the transcript isoforms or RNA structure or because of regulatory factors such as RNA binding proteins (RBPs) or RNA modifications. Regulation of start site usage would provide an intriguing possibility to tune protein levels as well as protein sequence in space and time.
Although the mechanisms of canonical translation have been extensively studied, the prevalence and underlying causes of heterogeneity in mRNA translation have remained largely unexplored. Currently used technologies, like ribosome profiling and fluorescence reporters, are not ideally suited to detect variability in mRNA translation, including variability in translation start site selection, because (1) they cannot distinguish which translation start sites are used on which mRNA molecules or whether multiple start sites are used on individual mRNA molecules; (2) they cannot track translation start site usage in space and time for individual mRNA molecules; (3) it is challenging to detect infrequently used start sites above the experimental noise, especially when many different infrequently used start sites exist in an mRNA; and (4) static measurements may not readily detect start sites that trigger mRNA degradation. Start sites that result in out-of-frame translation, which likely represent the majority of non-canonical translation initiation events, may trigger nonsense-mediated mRNA decay (Lykke-Andersen and Jensen, 2015), resulting in rapid decay of the mRNAs that preferentially use such alternative start sites. Therefore, new tools are required to uncover the dynamics and heterogeneity in translation start site selection.
Results
Development of the MoonTag, a Fluorescence Labeling System to Visualize Translation of Single mRNAs
We recently developed a fluorescence labeling strategy called SunTag, consisting of a genetically encoded, fluorescently labeled intracellular antibody and a peptide epitope (Tanenbaum et al., 2014). We and others have shown that the SunTag system (Wang et al., 2016a, Wu et al., 2016, Yan et al., 2016) or a labeling system with a purified antibody (Morisaki et al., 2016) can be applied to fluorescently label nascent polypeptides, enabling visualization of translation of individual mRNA molecules over time. However, the SunTag system only provides a single readout of translation and is therefore not suited to study more complex translation events. To obtain multiple readouts of translation of single mRNA molecules in real time, we aimed to establish a second, orthogonal, genetically encoded antibody-epitope pair for nascent chain labeling (Figure 1A). An extensive literature search identified seven single-chain antibodies (e.g., nanobodies) that bind a linear epitope with high affinity in vitro (STAR Methods). We found that one of these antibody-peptide pairs retained robust binding in cells (gp41; Figures 1A–1D). The gp41 peptide is a 15-amino acid peptide from the HIV envelope protein complex subunit gp41. The gp41 antibody is a 123-amino acid llama nanobody (clone 2H10) that binds the peptide in vitro with an affinity of ∼30 nM (Lutje Hulsik et al., 2013). Because this antibody-peptide system is orthogonal to our SunTag system, we refer to it as the MoonTag system.
Figure 1.

Development of the MoonTag, a Fluorescence Labeling System to Visualize Translation of Single mRNAs
(A) Schematic representation of the nanobody peptide labeling system.
(B and C) Representative images of HEK293T cells transfected with the indicated constructs.
(D) The indicated constructs were transfected in U2OS cells stably expressing the GFP-tagged MoonTag nanobody. The GFP:mCherry fluorescence intensity ratio on mitochondria was quantified. Each dot represents a single cell, and lines indicates the average.
(E) Schematic of the translation reporter (top panel) and nascent polypeptide labeling strategy using the MoonTag system (bottom panel).
(F) Representative image of U2OS cells expressing MoonTag-Nb-GFP and PCP-mCherry-CAAX and the MoonTag translation reporter shown in (E).
(G and H). Schematic of reporters (top) and representative images of Moon/Sun cells expressing the indicated reporters (bottom). In (G), the arrowhead and arrow indicate SunTag and MoonTag translation, respectively. In (H) the arrowhead indicates mRNA with 3′ UTR translation.
(I and J) Moon/Sun cells were transfected with the reporter indicated in (H), and MoonTag and SunTag intensities on single mRNAs were tracked over time.
(I) Boxplot indicating the frequency of 3′ UTR translation (percentage of ribosomes) calculated for each mRNA. The dashed line represents the median value, the box indicates the 25%–75% range, and whiskers indicate the 5%–95% range.
(J) Example dual-color intensity traces of two mRNAs with a MoonTag (blue) and SunTag signal (green).
The number of experimental repeats and mRNAs analyzed per experiment are listed in Table S1. See also Videos S1, S2, and S3. Scale bars: 5 μm (B), 10 μm (C), and 1 μm (F–H).
To determine the binding stoichiometry of the MoonTag nanobody to its peptide array, we created peptide arrays containing 4, 12, or 24 MoonTag peptides that were fused to Mito-mCherry. The binding stoichiometry of the MoonTag nanobody and peptide array was then determined by quantitatively comparing mCherry and GFP fluorescence near mitochondria (STAR Methods), which revealed that up to ∼10–12 MoonTag nanobodies bind to an array of 24 MoonTag peptides (Figure 1D), slightly less than what was observed for the SunTag (Tanenbaum et al., 2014). A similar labeling efficiency was observed when MoonTag peptides were separated by shorter (5-amino acid) linkers, which were used for all subsequent experiments. Fusion of MoonTag peptides to either a histone or a membrane protein resulted in recruitment of the MoonTag nanobody to DNA and the plasma membrane, respectively (Figures S1A and S1B), indicating that MoonTag-fused proteins localize correctly to different cellular compartments. The MoonTag nanobody could also be labeled with the far-red dye JF646 using the HaloTag (Grimm et al., 2015; Figure S1C), providing the possibility to label the SunTag and MoonTag in different colors and combine both systems in a single cell.
Figure S1.

Development and Characterization of the MoonTag System, Related to Figure 1
(A-C) U2OS cells stably expressing MoonTag nanobody-GFP were transfected with 12xMoonTag-H2B-mCherry (A), 12xMoonTag-CAAX and mCherry-CAAX (B), or 12xMoonTag-Mito-mCherry and MoonTag nanobody-HaloJF646 (C). Representative cells are shown. Scale bars, 10μm (A, B), and 5μm (C). (D) Moon/Sun cells expressing the reporter indicated in Figure 1H. Correlation between the main coding sequence translation initiation rate and 3′ UTR translation frequency on single mRNAs is shown. Every dot represents a single mRNA and line depicts moving average over 15 mRNAs. Number of experimental repeats and mRNAs analyzed per experiment are listed in Table S1.
Next we introduced a sequence encoding the MoonTag peptide array in our previously developed translation imaging reporter (Figure 1E; Yan et al., 2016). In brief, the MoonTag is inserted upstream of a gene of interest (the kinesin Kif18b). During translation, the MoonTag peptides are synthesized before the protein of interest and rapidly bound co-translationally by the MoonTag nanobody. This results in bright fluorescence labeling of the nascent polypeptide, providing a direct readout of translation of single mRNA molecules. Additionally, the reporter mRNA contains 24 binding sites for the PP7 coat protein (PCP) (Chao et al., 2008) in the 3′ UTR. Co-expression of PCP-2xmCherry enables fluorescence labeling of the mRNA independently of translation. The PP7 system was also used to tether the mRNAs to the plasma membrane, which substantially increases signal-to-noise during imaging and facilitates long-term tracking of individual mRNAs that undergo cytoplasmic translation without detectably altering translation dynamics (Figure 1E; Yan et al., 2016). When transfected into human U2OS cells stably expressing MoonTag-Nb-GFP and PCP-2xmCherry-CAAX, MoonTag foci could be observed that co-localized with single mRNAs (Figures 1E and 1F; Video S1), indicating active translation of those mRNA molecules. These results demonstrate that the MoonTag system can be applied to label nascent polypeptides and visualize translation of single mRNA molecules in real time, similar to the SunTag system.
For simultaneous analysis of two different types of mRNAs in single cells, we generated SunTag and MoonTag translation reporters containing different genes (Kif18b and GAPDH) and co-expressed these reporter mRNAs in U2OS cells stably expressing SunTag-scFv-GFP, MoonTag-Nb-HaloJF646, and PCP-2xmCherry-CAAX (referred to as Moon/Sun cells). Red mRNA foci were observed that co-localized with either the SunTag or MoonTag signal, but no mRNAs were observed that contained both signals (Figure 1G; Video S2; n = 253 mRNAs; 2 repeats), demonstrating that the SunTag and MoonTag systems are fully orthogonal and can be used together in the same cell to visualize translation of two different mRNAs.
To test whether the SunTag and MoonTag systems could also be combined in a single mRNA, we generated a translation reporter with the MoonTag encoded in the ORF, followed by a stop codon and the SunTag (the SunTag sequence was placed in-frame with the stop codon) to visualize translation of the 3′ UTR (Figure 1H, schematic). Most mRNAs showed strong MoonTag translation signal, but a small subset of MoonTag-positive mRNAs showed a SunTag signal as well (Figure 1H). The SunTag signal intensity was generally low, and most individual SunTag translation events only lasted a few minutes (Figure 1H; Video S3). 3′ UTR translation was likely caused by occasional stop codon readthrough by individual ribosomes. Although translation reinitiation after termination at the MoonTag ORF stop codon is also possible, it is less likely because no AUG start codons were present in the SunTag reading frame downstream of the stop codon. Surprisingly, large variations in the frequencies of 3′ UTR translation were observed between different mRNA molecules (Figures 1I and 1J). The majority of mRNAs (68.9%) did not show any 3′ UTR translation over the time period of imaging (mean track length, 16.9 ± 5.2 min [mean ± SD]), whereas other mRNAs showed continuous 3′ UTR translation, indicative of translation by multiple ribosomes (Figures 1I and 1J). The differences in the frequency of 3′ UTR translation between different mRNAs were not caused by corresponding differences in the translation initiation rate of those mRNAs (Figure S1D), suggesting that different mRNA molecules may have a distinct susceptibility for stop codon readthrough even though these mRNAs were derived from the same gene. Thus, the SunTag and MoonTag systems can be combined in single cells and even in single mRNAs to visualize complex aspects of mRNA translation with single ribosome sensitivity.
Development of a Translation Reading Frame Reporter that Reports on Translation Start Site Selection
Alternative translation start site selection is an important form of translational heterogeneity because the majority of mRNAs contain multiple translation start sites, and translation start site selection can determine both the protein sequence and expression levels. Because the translation start site determines the reading frame of a ribosome, we reasoned that a reporter of the translation reading frame could be leveraged to report on translation start site selection. To develop a translation reading frame reporter, we designed a tag in which MoonTag and SunTag peptides were “mashed” together: they were fused in an alternating fashion and positioned in different reading frames. All SunTag peptides were located in the −1 reading frame with respect to the MoonTag peptides (Figure 2A). The +1 frame did not contain any SunTag or MoonTag sequences and is referred to as the “blank” frame. We named this ribosome reading frame reporter the MoonTag and SunTag hybrid (Mash)Tag (Figure 2A). To enable the MashTag to report on translation start site selection, we designed two versions of the MashTag reporter; both versions contained 36 copies of the MashTag (devoid of stop codons in all frames), a downstream gene of interest, followed by stop codons in all three frames. As the gene of interest, we designed a BFP sequence lacking stop codons in all frames to ensure that the coding sequence length of the MoonTag and the SunTag frame is equal. Finally, 24 PCP binding sites were introduced in the 3′ UTR of the MashTag reporter to visualize and tether mRNAs. One version of the MashTag reporter contained an AUG translation start codon in-frame with the MoonTag peptides (“MoonStart” reporter), whereas the other contained an AUG in-frame with the SunTag peptides (“SunStart” reporter) (Figures 2B and 2C, schematics). Both AUGs were placed in a strong initiation sequence context (Kozak consensus sequence), and no other AUG codons were present in the 5′ UTR or MashTag sequence. During initial attempts to image cells expressing the MashTag reporters, we noticed that, at high expression levels, the “mature” (i.e., ribosome-released) protein encoded in the SunTag frame of the MashTag tended to form protein aggregates. The observed protein aggregation was likely caused by an aggregation-prone amino acid sequence that is produced when the MoonTag peptides are translated in the −1 frame (i.e., when translating the MashTag in the SunTag frame). Therefore, the MashTag reporter was expressed from a tetracycline-inducible promoter and induced briefly (15–20 min) before imaging to reduce protein synthesis before the onset of imaging, and all cells that showed protein aggregates were excluded from further analyses.
Figure 2.

The MashTag: A Reading Frame Sensor to Visualize Translation Start Site Selection
(A) Schematic of the MashTag design
(B, C, and F–H) Schematic of MashTag translation reporters (top panels). Circles with triangles and squares represent start and stop sites, respectively. The colors of the filled circles indicate the reading frame (blue, MoonTag reading frame; green, SunTag reading frame). For simplicity, 24xPP7 sites in the 3′ UTR are not depicted in (F–H).
(B and C) Representative images of mRNAs in Moon/Sun cells expressing the indicated translation reporters prior to (top images) and after (bottom images) 5 min incubation with the translation inhibitor puromycin.
(D) Moon/Sun cells expressing the MashTag translation reporter shown in (B). The asterisk indicates an mRNA with OOF translation. Arrowheads indicate the OOF SunTag signal. Time is indicated in minutes.
(E) Schematic of OOF translation on the MashTag reporter.
(F) Theoretical intensity trace of a single ribosome translating a MashTag reporter mRNA.
(G and H) Fluorescence intensities of single ribosomes translating the reporter mRNA in the SunTag frame, either when the SunTag is in the main frame (SunStart reporter, G) or is OOF (MoonStart reporter, H). Intensity traces are aligned at the last time point that contains a SunTag signal (i.e., just before translation termination). Solid lines indicate experimentally derived values; shaded areas surrounding solid lines indicate SEM.
Dashed lines in (F–H) indicate the expected single-ribosome intensity trace of the SunTag reading frame. The number of experimental repeats and mRNAs analyzed per experiment are listed in Table S1. See also Video S4. Scale bars, 1 μm.
MoonStart and SunStart reporters showed predominantly MoonTag and SunTag translation signals, respectively (Figures 2B and 2C), indicating that they accurately report on the dominant translation start site. Upon addition of the translation inhibitor puromycin, the MoonTag and SunTag fluorescence signals disappeared from the MashTag mRNAs, confirming that the MoonTag and SunTag signals on MashTag mRNAs reflect translation (Figures 2B and 2C). Surprisingly, when analyzing the MoonStart reporter, we observed frequent brief pulses of SunTag signal on mRNA molecules that also showed a MoonTag signal (Figure 2D; Video S3). These pulses of SunTag signal could not be explained by background fluorescence or bleedthrough from the MoonTag signal because similar fluorescence signals were not observed on mRNAs containing only the MoonTag (Figure S2A and S2B). Furthermore, to exclude that dual labeling of mRNAs in both MoonTag and SunTag channels is due to coincidental colocalization of two or more mRNAs, each translating only a single reading frame, we compared the mCherry (i.e., mRNA) fluorescence intensity of mRNAs with only a MoonTag signal to mRNAs with both the MoonTag and SunTag signal. This analysis revealed that mCherry fluorescence in both categories of mRNAs is similar, arguing against mRNA multimers as the cause of dual SunTag and MoonTag positivity of a subset of mRNAs (Figure S2C). Instead, the SunTag pulses on the MoonStart reporter mRNAs represent a subset of ribosomes on the same mRNA that are translating the MoonStart reporter in the SunTag reading frame, which we will refer to as out-of-frame (OOF) translation (Figure 2E). Together, these results show that the MashTag reporter can accurately report on the dominant translation start site of an mRNA and can simultaneously reveal non-canonical OOF translation events on individual mRNA molecules.
Figure S2.

Quantifying Translation Dynamics Using the MashTag Systems, Related to Figure 2
(A-F) Indicated reporters were expressed in Moon/Sun cells. A-B) Representative images of mRNAs in Moon/Sun cells expressing the indicated translation reporters. (C) Distribution of mCherry intensities of mRNAs associated with MoonTag signal only (blue bars) or mRNAs associated with both MoonTag and SunTag signal (orange bars). (D) Normalized SunTag intensity on mRNAs after harringtonine treatment. Grey lines depict selected single mRNA intensity traces and the black line shows the average of all mRNAs. Red line indicates harringtonine addition. E) Distribution of the intensity of mature proteins expressed from the SunTag frame. Mature proteins were tethered to the plasma membrane through a CAAX motif. Note that identical imaging settings were used to measure mature protein intensities plotted in (E) and translation site fluorescence intensity traces. (F) Distribution of the intensity of mature proteins expressed in the SunTag frame. SunTag proteins were expressed either from the main reading frame (green) or as OOF translation protein products (orange). Mature proteins are tethered to the membrane through a CAAX domain encoded in the SunTag frame. P-values are based on a two-tailed Student’s t-test. Number of experimental repeats and mRNAs analyzed per experiment are listed in Table S1. Scale bars, 1 μm.
OOF Translation Is Mainly Due to Alternative Translation Start Site Selection
OOF translation in the MoonStart reporter could either be due to alternative translation start site selection or ribosome frameshifting. Alternative translation start site selection presumably occurs near the 5′ end of the MashTag and is thus expected to include most, if not all, SunTag peptides. In contrast, if OOF translation is caused by ribosome frameshifting on the MashTag reporter, then the OOF translation event would contain only a subset of SunTag peptides, reducing both the SunTag fluorescence intensity and the duration of the fluorescence signal of the OOF translation event. To differentiate between these scenarios, we wished to compare the fluorescence of OOF translation events with the expected fluorescence signal of a single ribosome translating the entire array of 36 SunTag peptides (referred to as the “theoretical single-ribosome intensity trace”). The theoretical single-ribosome intensity trace contains three distinct phases: (1) a fluorescence intensity buildup phase when the SunTag peptides are sequentially synthesized and fluorescently labeled by antibodies; (2) a plateau phase when the gene downstream of the MashTag (i.e., the BFP sequence) is translated, no new SunTag peptides are synthesized, and the fluorescence remains constant; and (3) a sudden drop in fluorescence when translation is terminated and the nascent chain is released and diffuses away from the mRNA (Figure 2F). To determine the duration of the buildup and plateau phases, we calculated the ribosome elongation speed using harringtonine run-off experiments (STAR Methods), which revealed an elongation speed of 2.9 ± 2.0 codons/s (mean ± SD) (Figure S2D), similar to our previously determined translation elongation rate in U2OS cells (Yan et al., 2016). Using the nucleotide length of the MashTag and BFP sequences combined with the experimentally derived translation elongation rate, the duration of the buildup and plateau phases could be calculated (429 s and 74 s, respectively). Next we determined the fluorescence intensity during the plateau phase. The plateau intensity represents the fluorescence intensity of a single, fully synthesized array of 36 SunTag peptides encoded by the MashTag and was determined to be 110 ± 53 a.u. (mean ± SD) (Figure S2E; STAR Methods).
To validate the values for the theoretical single-ribosome intensity trace, we directly determined the fluorescence intensity over time of a single ribosome translating the entire 36 repeats of the MashTag reporter in the SunTag frame. To image single translating ribosomes, we introduced the highly repressive 5′ UTR of Emi1 into the SunStart reporter, which reduces translation initiation rates by ∼50-fold (Tanenbaum et al., 2015). As a result, mRNA molecules are translated by no more than one ribosome at a time (Yan et al., 2016). Comparison of the theoretical and observed single-ribosome intensity traces revealed highly similar traces (Figure 2G), demonstrating that the theoretical intensity trace accurately represents the fluorescence associated with a single ribosome translating the entire 36 repeats of the MashTag.
We also generated two additional theoretical intensity traces that represent translation of either 18 or 27 SunTag peptides by a single ribosome, the approximate average number of SunTag peptides that would be translated if SunTag OOF signals were caused by frameshifting at random positions within the MoonStart mRNA sequence (Figure 2H; STAR Methods). We then analyzed the SunTag fluorescence intensity traces of OOF translation events on the MoonStart reporter and compared them with either the trace containing all 36 SunTag peptides or the traces containing 18 or 27 peptides. This comparison revealed that the intensity profile of single OOF translation events was very similar to the theoretical intensity trace of 36 SunTag peptides (Figure 2H), indicating that OOF translation is predominantly caused by alternative start site selection near the 5′ end of the ORF. Comparison of the SunTag fluorescence intensity of mature polypeptides synthesized from either the SunStart reporter or through OOF translation of the MoonStart reporter also revealed similar intensities (Figure S2F), confirming that frameshifting is not a major cause of the OOF translation signal. Note that OOF fluorescence could, in theory, also be explained by frameshifting that occurs exclusively at a unique sequence near the 5′ end of the MashTag. However, this is unlikely because the nucleotide sequence of the MashTag is quite repetitive, so any frameshifting sequence in one of the first MashTag repeats is likely to be present multiple times in the MashTag and thus is not unique to the 5′ end. Together, these analyses indicate that most of the OOF SunTag translation events are caused by alternative start site selection. Therefore, our MashTag reporter can be used to study translation start site selection kinetics and variability.
A Computational Pipeline to Quantitatively Interpret Fluorescence Signals on Translating mRNAs
To understand the heterogeneity and dynamics of translation initiation at both canonical and alternative start sites, it is essential to extract quantitative information from microscopy images regarding the frequency and timing of both types of initiation events. To facilitate fluorescence intensity measurements, we developed an automated analysis package in MATLAB with a graphical user interface (GUI) (“TransTrack,” freely available through Github). TransTrack enables simultaneous mRNA tracking and fluorescence intensity measurements in multiple colors and generates fluorescence intensity traces for both SunTag and MoonTag frames for each mRNA as output.
Next, we wished to convert SunTag and MoonTag fluorescence intensities to the number of ribosomes on the mRNA at each time point. We made use of the theoretical fluorescence intensity profile of a single ribosome in both SunTag and MoonTag frames (Figure 2F; STAR Methods). By positioning one or more theoretical single-ribosome intensity traces along the timeline of an experimentally observed translation site intensity trace and summing up their intensity profiles at each time point, the experimentally observed intensity trace of an mRNA translated by multiple ribosomes can be reconstructed in silico (Figure 3A). We developed an iterative stochastic modeling approach to determine the number and temporal position of translation initiation events that generated the best fit with the experimental data (RiboFitter) (Figures 3B and S3D–S3F; STAR Methods). To validate TransTrack and RiboFitter, we generated three control reporters: one reporter containing only SunTag peptides, one containing only MoonTag peptides, and one containing both SunTag and MoonTag peptides that were placed in the same reading frame (“Moon-SunTag” reporter). As expected, when SunTag- or MoonTag-only reporters were analyzed, ribosomes were detected almost exclusively in the SunTag and MoonTag frames, respectively (Figure 3C). Furthermore, the Moon-SunTag reporter showed a narrow distribution in the ratio of SunTag and MoonTag signals, centering close to 50% (Figure 3C), confirming the accuracy of our analysis pipeline.
Figure 3.

A Computational Pipeline to Quantitatively Interpret Fluorescence Signals
(A) Schematic illustrating how the fluorescence originating from multiple ribosomes translating an mRNA together generates a fluorescence intensity trace. Each color represents a single translating ribosome. Triangles indicate the moment of translation initiation.
(B and C) Schematics of translation reporters (top). For simplicity, 24xPP7 sites in the 3′ UTR are not depicted. The black start or stop sites in (C) indicate that only a single reading frame contains MoonTag or SunTag peptides.
(B) An example dual-color intensity trace of a single MoonStart-MashTag mRNA with a MoonTag (top panel) and SunTag (center panel) signal. Dashed lines indicate experimentally observed intensities, and solid lines display the optimal fit. Colored triangles below the x-axes of the top and middle graphs represent translation initiation events. The bottom panel shows ribosome occupancy per reading frame over time as determined by RiboFitter.
(C) Boxplots indicating the relative percentage of ribosomes translating the SunTag frame on single mRNAs of the reporter mRNAs indicated above. The dashed line represents the median value, the box indicates the 25%–75% range, and whiskers indicate the 5%–95% range.
The number of experimental repeats and mRNAs analyzed per experiment are listed in Table S1.
Figure S3.

Normalizing and Quantifying MashTag Fluorescence, Related to Figure 3
(A-F) Schematics of translation reporters (top). For simplicity, 24xPP7 sites in the 3′UTR are not depicted. Moon/Sun cells were transfected with indicated reporters. (A) Correlation between total cell MoonTag intensity and average MoonTag translation signal on mRNAs. (B) Correlation between total cell SunTag intensity and average SunTag translation signal on mRNAs. (C) Distribution of the intensity of the MoonTag translation signal of individual mRNAs. (D) An example intensity track (dashed line) and fit (solid line) are shown for the MoonTag signal after one iteration (top) or 1000 iterations (bottom) of fit optimization. Colored triangles below the x-axes represent translation initiation events. Each row of triangles illustrates an independent round of fitting. Corresponding root mean squared error (RMSE) values for each round of fitting are shown. (E-F) RMSEs after indicated number of iterations of fit optimization are shown for three representative mRNAs. Number of experimental repeats and mRNAs analyzed per experiment are listed in Table S1.
Analysis of Translation Start Site Selection Dynamics and Heterogeneity
To determine the frequency of OOF translation on the MoonStart reporter, intensity traces were generated for 85 mRNA molecules that contained detectable translation in either reading frame, and the number of ribosomes translating either reading frame was determined for each mRNA. Traces had a duration of 26 ± 6 min (mean ± SD) and contained 38 ± 30 (mean ± SD) translation initiation events. Most mRNAs were strongly translated in the MoonTag frame; 87% of mRNAs had an initiation rate of more than 0.5 ribosomes/min in the MoonTag frame. The majority of mRNA molecules (66%, 56 of 85) showed both SunTag and MoonTag translation events, indicating that multiple translation start sites are used intermittently on most mRNA molecules originating from this reporter gene. Surprisingly, we observed widespread variability in the frequency of OOF translation, ranging from 0% to 100% of the ribosomes (median, 7%) (Figures 4A and 4B; STAR Methods). To rule out that the variability in the OOF translation frequency observed among mRNAs is due to transient transfection of the plasmid encoding the reporter gene, we generated a knock-in of the MoonStart-MashTag reporter in a single genomic locus (the AAVS1 safe harbor locus, a site in the PPP1R12C gene) in Moon/Sun cells. Integration in the correct genomic site was confirmed by northern blot (Figure S4B). MoonStart-MashTag mRNAs expressed from a single genomic locus displayed similar levels of OOF translation (median, 6.7%; p = 0.61, Mann-Whitney test) and variability in OOF translation among mRNAs as mRNAs expressed from transiently transfected plasmids (Figure S4C).
Figure 4.

Heterogeneity in Translation Start Site Selection among Different mRNA Molecules
(A–F) The indicated reporters were transfected into Moon/Sun cells, and MoonTag and SunTag intensities on single mRNAs were tracked over time. For simplicity, 24xPP7 sites in the 3′ UTR are not depicted.
(A) Boxplot indicating the relative percentage of ribosomes translating the SunTag frame on single mRNAs. The dashed line represents the median value, the box indicates the 25%–75% range, and whiskers indicate the 5%–95% range.
(B) Example graphs of four representative mRNAs in which the number of ribosomes in each reading frame is plotted over time of the reporter indicated in (A). The percentages of SunTag ribosomes on each mRNA are shown (% OOF).
(C) p-values for enrichment of ribosomes translating either the SunTag or MoonTag frame on individual mRNAs. Every dot represents a single mRNA (left graph). The color of the dot indicates the reading frame that is enriched. Also shown are example traces of single mRNAs that show enrichment of ribosomes translating either the SunTag or MoonTag frame (right graphs).
(D) Correlation between overall translation initiation rate and relative SunTag frame translation frequency for individual mRNAs of the reporter indicated in (A). Every dot represents a single mRNA, and the line depicts the moving average over 15 mRNAs.
(E) Linear regression analysis of MoonTag and SunTag intensities for the indicated reporter mRNAs (left graph). An example trace of one mRNA is shown (right bottom graphs) with the indicated R2 value.
(F) Sliding window analysis (see Figures S4H and S4I for details) of initiation events in MoonTag and SunTag reading frames on mRNAs of the reporter indicated in (A). Every dot depicts the strongest p-value of a single mRNA (left graph). Example traces show the number of ribosomes in each reading frame over time (top right graphs) and corresponding sliding window p values (bottom right graphs).
The number of experimental repeats and mRNAs analyzed per experiment are listed in Table S1.
Figure S4.

Heterogeneity in Translation Start Site Selection among Different mRNA Molecules Expressed from a Single Genomic Locus, Related to Figure 4
The reporter indicated in Figure 4A was expressed in Moon/Sun cells (A-D, F-J). (A) The median frequency of ribosomes translating the SunTag reading frame as determined by either the variable (histogram) or constant (red dashed line) AUC fitting approach (See STAR Methods). B) Northern blot with probes against the BGH polyadenylation sequence. RNA was extracted from either parental Moon/Sun cells or from a polyclonal Moon/Sun cell line in which the targeting construct [P2A-Puro-BGH]-[TetOn-MoonStart-MashTag reporter] was integrated into the AAVS1 safe harbor locus (in the PPP1R12C gene). The indicated band represents an mRNA encoding the 5′ part of PPP1R12C fused to P2A-puro-BGH. 28S rRNA is shown as a loading control (bottom). C, D, F, J) Comparison between MoonStart-MashTag mRNAs either expressed from transiently transfected plasmids (replotted from Figures 4A, 4C, 4E, and 4F) or expressed from the AAVS1 genomic locus. (C) Boxplot indicates the relative percentage of ribosomes translating the SunTag frame on single mRNAs. Dashed line represents median value, box indicates 25%–75% range, and whiskers indicated 5%–95% range. P-value is based on two-tailed Mann-Whitney test. (D) P-values for enrichment of ribosomes translating either the SunTag or MoonTag frame on individual mRNAs. Every dot represents a single mRNA. The color of the dot indicates the reading frame that is enriched. Dashed red line indicates p = 0.01. (E) Example intensity traces of MoonTag and SunTag on an mRNA of the Moon-SunTag reporter, which illustrates why the linear regression analysis might underrepresent fluorescence intensity correlation over time between MoonTag and SunTag signals; 1) the MoonTag signal appears slightly earlier than the SunTag signal on the Moon-SunTag reporter (left bottom graph) due to its upstream position in the reporter; 2) a poor correlation is obtained if both signals remain largely constant over time (right bottom graph). R2 values are shown for each graph, as determined by linear regression analysis. (F) Linear regression analysis of MoonTag and SunTag intensities. Each dot represents a single mRNA molecule. (G) Cells were treated with 200 μg/ml cycloheximide for 1 min and imaged at indicated time-intervals. MoonTag fluorescence intensity was measured over time. Mean and SD of the intensity was calculated for 6 consecutive time points and the mean/SD is plotted. (H) Schematic of sliding window analysis approach. First, ribosomes were fit to raw intensity traces, and the time of each translation initiation event was determined (indicated by triangles under the x-axis of top graph), as described in Figure 3B (top). Initiation events in both MoonTag and SunTag frames were then merged onto a single time-line. For each consecutive set of initiation events (window length of 10 initiation events is shown), a p-value was calculated using a binomial test, which represents the probability of observing the ratio between MoonTag and SunTag initiation events within that window, based on the MoonTag and SunTag translation initiation rates of the entire mRNA trace (middle). The p-value for each window of 10 consecutive initiation events of an mRNA was plotted and the strongest p-value per mRNA was determined (bottom). The mRNA shown here was also used as an example in Figure 4F. (I) Example graphs showing the number of ribosomes in each reading frame over time for an example mRNAs (left panel) and corresponding sliding window p-value graphs (right) for sliding windows with indicated number of initiation events per window. (J) Sliding window analysis of initiation events in MoonTag and SunTag reading frames. Every dot depicts the strongest p-value of a single mRNA (left graph). Example traces of the number of ribosomes in each reading frame over time (right graphs) with corresponding p-values (colored dots). Dashed red line indicates p = 0.05. Number of experimental repeats and mRNAs analyzed per experiment are listed in Table S1.
Two possible explanations could account for the observed variability in OOF translation frequency on different mRNA molecules. First, it is possible that translation start site selection is stochastic and that some mRNAs have more OOF translation than others by chance. In this model, the probability of initiating translation at each potential start site is identical for every mRNA molecule. Alternatively, the probability of alternative start site selection may be distinct for different mRNA molecules. To distinguish between these possibilities, we performed statistical analyses, which revealed that, for 25% (21 of 85) of mRNAs, start site usage frequency deviated significantly from the population (Figures 4C and S4D) (p < 0.01, binomial test; STAR Methods). These results indicate that different mRNA molecules originating from a single gene can be heterogeneous with respect to translation start site usage.
To test whether alternative start site selection frequency depends on the overall translation initiation rate of an mRNA (i.e., the sum of MoonTag and SunTag initiation rates), we compared the frequency of OOF translation with the overall translation efficiency for each mRNA molecule. The OOF translation frequency was similar over a range of translation initiation rates (Figure 4D), demonstrating that OOF translation does not depend on the overall translation efficiency. Next, we asked whether translation initiation rates in the MoonTag and SunTag frames were correlated over time. We performed linear regression analysis on the intensities of SunTag and MoonTag translation signals for all time points of an mRNA. As a positive control, the level of correlation between SunTag and MoonTag fluorescence over time was determined in the Moon-SunTag reporter, which showed a strong positive correlation, as expected (Figure 4E). Of note, this linear regression analysis likely underestimates the correlation between MoonTag and SunTag signal because a strong R2 value is only expected when substantial changes in fluorescence intensity occur. In parts of the intensity traces without strong changes, intensity fluctuations are dominated by noise, which is not expected to correlate in different fluorescence channels (Figure S4E; STAR Methods). Analysis of SunTag and MoonTag fluorescence on the MoonStart reporter also revealed a positive correlation between translation in both reading frames for many mRNAs, albeit not as strong as the Moon-SunTag reporter; 56% of MoonStart mRNAs (18 of 32; note that only 32 of 85 mRNAs could be included in this analysis; STAR Methods) showed a positive correlation (R2 > 0.2) (Figures 4E and S4F). The positive correlation between MoonTag and SunTag translation initiation events over time may be explained by temporal fluctuations (i.e., bursting) in the rate of ribosome recruitment to the mRNA, which could affect the initiation rate at all start sites. Observed changes in fluorescence intensities were not due to imaging noise or fluctuations in nanobody occupancy on the peptide array because the fluorescence intensities remained mostly constant in the presence of the translation inhibitor cycloheximide, which locks ribosomes on the mRNA and prevents translation-dependent changes in fluorescence (SD = ∼15% of the mean intensity; Figure S4G). Moreover, changes in fluorescence because of altered translation occur over multiple consecutive time points (i.e., minute timescale), whereas the observed “technical” noise acts over milliseconds to seconds.
To investigate whether initiation at different start sites could also be controlled independently, the relative frequency of SunTag frame and MoonTag frame initiation was determined over shorter periods of time to detect “bursts” in the usage of particular translation start sites. The SunTag and MoonTag translation initiation frequencies were determined in a sliding window of 10 sequential translation initiation events, and the relative initiation frequencies for each window were compared with the average translation frequencies of both frames of the entire trace (Figures S4H and S4I; STAR Methods). We then calculated the probability of observing the relative SunTag and MoonTag initiation frequency of each window and determined the lowest window p value of each mRNA. This sliding window analysis revealed that the majority of temporal fluctuations in the relative frequency of SunTag and MoonTag translation can be explained by chance, indicating that, on individual mRNAs, start site selection is largely stochastic. However, on a small number of mRNAs (8%; 5 of 63) a statistically significant change in translation start site selection was observed during the time of observation (p < 0.05, binomial test; Figures 4F and S4J), suggestive of bursts in initiation in a single translation reading frame. Although the observed frequency of such bursts in translation start site usage in our dataset was relatively low, our average observation time of individual mRNAs was only 26 min. On a transcriptome-wide level, the fraction of mRNAs that undergo changes in translation start site usage during their lifetime may be higher.
Alternative Translation Start Site Selection Can Occur on Near-Cognate Start Sites Both Upstream and Downstream of the AUG Start Codon
Because the MoonStart reporter does not contain any AUG start sites in the SunTag frame, SunTag frame translation must initiate on near-cognate start codons, which could be located upstream or downstream of the MoonTag AUG start site (Figure 5A). Downstream start sites could be encountered by ribosomes after scanning over the MoonTag AUG start site without initiating (“leaky scanning”). To test whether leaky scanning of the MoonTag AUG start codon results in OOF translation on the MoonStart reporter mRNAs, a second AUG start codon was inserted into the mRNA downstream of the MoonTag AUG. Introduction of additional start sites in the MoonTag or blank frame significantly reduced the number of translation initiation events in the SunTag frame (p < 0.01 and p < 0.001, respectively, Mann-Whitney test; Figure 5B). Addition of a start site in the SunTag frame downstream of the MoonTag start site slightly increased the SunTag translation signal, although this effect was not significant (p = 0.14, Mann-Whitney test; Figure 5B). However, introduction of additional start sites in the blank frame between the MoonTag and the newly introduced SunTag start site did significantly decrease initiation in the SunTag frame (p < 0.05, Mann-Whitney test; Figure 5B). Together, these results show that leaky scanning of the MoonTag start site followed by downstream initiation on a near-cognate start codon in the SunTag frame contributes to OOF translation on the MoonStart reporter.
Figure 5.

Alternative Start Site Selection Contributes to OOF Translation
(A) Schematic of different possible translation paths of individual ribosomes on a MashTag mRNA.
(B–D) For simplicity, the reporter schematics only indicate the 5′ region of the mRNA. The indicated reporters were transfected into Moon/Sun cells, and MoonTag and SunTag intensities were tracked over time on single mRNAs. The boxplots indicate the relative percentage of ribosomes translating the SunTag frame on single mRNAs. The p-values are based on a two-tailed Mann-Whitney test: ∗p < 0.05, ∗∗p < 0.01, ∗∗∗p < 0.001, ∗∗∗∗p < 0.0001. For comparison, data shown in dark blue is are re-plotted from Figure 4A. The dashed line represents the median value, the box indicates the 25%–75% range, and whiskers indicate the 5%–95% range.
The number of experimental repeats and mRNAs analyzed per experiment are listed in Table S1.
Next, we wished to examine the role of upstream start site selection in OOF translation of the MoonStart reporter. The MoonStart reporter contained two stop codons in the SunTag frame upstream of the MoonTag AUG, which would prevent upstream translation initiation from generating a SunTag signal. However, removal of these stop codons (MoonStart ΔSunStops) did not significantly increase the level of SunTag translation (Figure 5C), suggesting that upstream initiation in the SunTag reading frame does not strongly contribute to OOF translation on this reporter mRNA.
Rocaglamide A (RocA), an inhibitor of the translation initiation factor eIF4A, was recently shown to stimulate upstream translation initiation (Iwasaki et al., 2016). Treatment of cells expressing the MoonStart ΔSunStops reporter with 0.5 μM RocA resulted in a 37% reduction in overall translation, consistent with inhibition of a key translation initiation factor (Figure S5A). However, the relative fraction of ribosomes initiating translation in the SunTag frame markedly increased from 8.7% to 21.4% (median values, p < 0.01, Mann-Whitney test; Figure S5B). These analyses show that upstream translation start site selection can also result in OOF translation and confirm the previous finding that RocA can stimulate upstream translation initiation.
Figure S5.

Translation Initiation Dynamics on 5′ UTRs, Related to Figure 5
(A-C) Schematics of translation reporters (right). For simplicity, only the 5′ region of the mRNA is shown. Indicated reporter mRNAs were expressed in Moon/Sun cells. Boxplots represent the overall translation initiation rates (i.e., initiation rates of MoonTag and SunTag frames combined) (A, C) or percentage of ribosomes translating the SunTag frame (B) for single mRNAs. P-values are based on two-tailed Mann-Whitney tests; ∗p < 0.05; ∗∗p < 0.01; ∗∗∗p < 0.001; ∗∗∗∗p < 0.0001. Dashed line represents median value, box indicates 25%–75% range, and whiskers indicated 5%–95% range. Number of experimental repeats and mRNAs analyzed per experiment are listed in Table S1.
To access upstream translation initiation within endogenous 5′ UTR sequences, two additional MashTag reporters were generated that contained the 5′ UTRs of two genes, HMBS and SERGEF (151 and 152 nt in length, respectively). Both 5′ UTRs lack start and stop codons in the SunTag frame. Although the HMBS 5′ UTR reporter showed a similar OOF translation frequency as the MoonStart reporter, introduction of the SERGEF 5′ UTR into the reporter resulted in a significant increase in OOF translation frequency (median, 28.6% versus 7.0%; p < 0.01, Mann Whitney test; Figure 5D). Interestingly, the overall initiation rate of the SERGEF 5′ UTR reporter was also reduced by 35% compared with the MoonStart reporter (p < 0.001, Mann-Whitney test; Figure S5C), indicating that the SERGEF 5′ UTR contains translation-regulatory elements that result in OOF translation. These results demonstrate that extensive upstream translation initiation occurs on endogenous 5′ UTR sequences, suggesting that alternative start site selection might be a widespread phenomenon on endogenous mRNAs.
A Real-Time Sensor to Visualize Translation of uORF-Containing mRNAs
uORFs are present in thousands of mRNAs and generally repress translation of the downstream (main) ORF (Calvo et al., 2009, Johnstone et al., 2016). Ribosomes that translate a uORF can dissociate from the mRNA after translation termination at the uORF stop codon, preventing translation of the downstream ORF. Translation of the main ORF can occur either through uORF skipping (i.e., leaky scanning of the uORF start site) or through translation reinitiation at the downstream ORF after translation termination at the uORF stop codon. Although a previous study used the SunTag system to visualize translation of a protein-coding ORF downstream of a uORF (Wang et al., 2016a), real-time visualization of multiple translation paths (e.g., uORF translation versus uORF skipping) of a uORF-containing mRNA was not feasible, and, therefore, the frequency and heterogeneity in path selection by different ribosomes could not be assessed. To determine uORF translation, uORF skipping, and translation reinitiation in real time on single mRNAs, we generated a single-molecule uORF sensor using the MashTag (Figure 6A). The uORF sensor is based on the MoonStart reporter and contains an AUG start codon in the MoonTag frame. Upstream of the MoonTag AUG, the reporter contains a short uORF (48 nt; similar to the median human uORF length; Calvo et al., 2009). The uORF start codon was placed in the blank frame, so initiation at the uORF start site could not result in MoonTag or SunTag fluorescence. A third AUG codon was inserted into the coding sequence of the uORF and was placed in-frame with the SunTag (Figure 6A). In this reporter, a SunTag signal reports on leaky scanning of the uORF start codon, whereas a MoonTag signal mainly reflects translation reinitiation after uORF translation. Ribosomes that dissociate from the mRNA after uORF translation are not directly observed but can be inferred from the decrease in MashTag translation (i.e., MoonTag + SunTag translation) upon introduction of the uORF into the reporter.
Figure 6.

A Single-Molecule uORF Sensor Based on the MashTag
(A, B, and F) Schematics of translation reporters (top). For simplicity, 24xPP7 sites in the 3′ UTR are not depicted.
(A) Schematic of different possible ORFs that can be translated on a uORF-MashTag mRNA.
(B) Fraction of ribosomes undergoing each translation path. The thickness of the lines reflects the relative usage frequency. Solid lines indicate translation, dashed black lines indicate ribosome scanning, and the dashed gray line indicates ribosome dissociation from the mRNA. Colored numbers at branchpoints indicate the relative fraction of ribosomes that follow each path. The red vertical line indicates non-canonical start sites in any of the three frames in the MashTag.
(C–G) MashTag reporters were transfected into Moon/Sun cells, and MoonTag and SunTag intensities on single mRNAs were tracked over time.
(C) Cells were either untreated (top) or treated with puromycin for 5 min (bottom); representative images are shown. Scale bar, 1 μm.
(D) Example graphs of single mRNAs of the number of ribosomes translating either the SunTag or MoonTag frame over time in cells expressing the reporter indicated in (A).
(E) p-values for enrichment of ribosomes translating either the SunTag or MoonTag frame on individual mRNAs. Every dot represents a single mRNA (left graph). The color of the dot indicates the reading frame that is enriched. Also shown are example traces of single mRNAs that show enrichment of ribosomes translating either the SunTag or MoonTag (right graphs). p-values are indicated for example traces.
(F) Linear regression analysis of MoonTag and SunTag intensities for the indicated reporter mRNAs (left graph). For comparison, data shown in brown are replotted from Figure 4E. Example graphs of two mRNAs are shown with indicated R2 values (right graphs).
(G) Sliding window analysis of initiation events in MoonTag and SunTag reading frames on mRNAs of the reporter indicated in (A). Every dot depicts the strongest p-value of a single mRNA (left graph). Example traces are shown of the number of ribosomes in each reading frame over time (top right graphs) and corresponding sliding window p-values (bottom right graphs).
The number of experimental repeats and mRNAs analyzed per experiment are listed in Table S1.
Based on the translation rates in both SunTag and MoonTag frames and on the overall reduction of translation of the MashTag upon insertion of the uORF, we could estimate the frequency of usage of all translation paths along the uORF reporter (STAR Methods); 25%–36% of ribosomes translate the uORF and do not reinitiate, 28%–31% of ribosomes translate the uORF and reinitiate on the downstream MoonTag start site, 18%–22% of ribosomes skip the uORF AUG through leaky scanning and initiate on the SunTag AUG, and the remaining ribosomes follow more complex paths (Figure 6B). We also swapped SunTag and MoonTag start sites so that the SunTag signal reports on translation reinitiation and the MoonTag signal reports on uORF AUG leaky scanning, which resulted in similar values for uORF translation and reinitiation (Figure S6A). To experimentally confirm our calculations on the usage of different translation paths, we removed the uORF stop codon, extending the uORF coding sequence beyond the MoonTag AUG start site (Figures S6B–S6D). In this reporter, the MoonTag signal can no longer be caused by translation reinitiation. Based on our calculations, we predict that this would result in 80%–88% reduction in MoonTag signal, close to the observed 79% reduction in MoonTag signal (Figure S6B; STAR Methods). The SunTag translation rate was unaffected (p = 0.75, Mann-Whitney test), as predicted (Figure S6C). This result quantitatively confirms our calculations of the different translation paths and also confirms that the large majority of MoonTag translation is due to translation reinitiation (Figure 6B). Together, these results reveal that the MashTag-based uORF sensor can provide a quantitative readout of all possible paths ribosomes can take along a uORF-containing mRNA.
Figure S6.

Translation Initiation Dynamics on a uORF-Containing mRNA, Related to Figure 6
(A-D) Schematics of translation reporters (top). For simplicity, 24xPP7 sites in the 3′UTR are not depicted. Indicated reporter mRNAs were expressed in Moon/Sun cells. (A) Boxplots of relative initiation frequency in the MoonTag frame (left) or SunTag frame (right) (relative to the sum of the MoonTag and SunTag frame) on single mRNAs. (B-D) Boxplots of translation initiation rates in the MoonTag frame (B), SunTag frame (C), or MoonTag and SunTag frame combined (D) for single mRNAs. For comparison, data indicated in dark blue in D is replotted from Figure S5C. P-values are based on two-tailed Mann-Whitney tests: ∗∗∗p < 0.001; ∗∗∗∗p < 0.0001. Dashed line represents median value, box indicates 25%–75% range, and whiskers indicated 5%–95% range. Number of experimental repeats and mRNAs analyzed per experiment are listed in Table S1.
Next, translation of individual uORF-containing mRNA molecules was examined in more detail. The large majority of mRNA molecules (44 of 53) contained both a SunTag and MoonTag signal (Figures 6C and 6D), demonstrating that ribosomes following different paths along the mRNA (e.g., uORF skipping and translation reinitiation) co-exist on most mRNA molecules. However, the relative frequency of the different translation paths varied between different mRNA molecules. A subset of mRNAs (15 of 53) showed a significantly greater fraction of translation in either the MoonTag or the SunTag frame than expected, based on the total population of mRNAs (p > 0.01, binomial test; Figure 6E), demonstrating that the probability of uORF skipping and translation reinitiation is variable among different mRNA molecules.
When examining the precise moment of translation initiation of ribosomes translating either the SunTag or MoonTag reading frames, a temporal correlation between SunTag and MoonTag translation signals was observed on many mRNAs (Figure 6F). As discussed before, this correlation is likely caused by temporal fluctuations in the rate of ribosome recruitment to the mRNA. Detailed analysis of translation initiation timing using the sliding window approach (Figures S4H and S4I; STAR Methods) revealed that a subset of mRNA molecules (6 of 37, p < 0.05, binomial test) showed statistically significant bursts of either translation reinitiation or uORF skipping (Figure 6G), suggesting that uORF translation may be dynamically regulated over time on individual mRNAs. Bursts in translation start site selection did not take place simultaneously on all mRNAs in the same cell, suggesting that the regulation of uORF translation does not occur in a cell-wide manner but, rather, at the level of individual mRNA molecules. Together, these results provide the first real-time observations of uORF translation, uORF skipping, and translation reinitiation and offer a quantitative assessment of all paths ribosomes take along the 5′ UTR of a uORF-containing mRNA and provide a powerful assay to study mechanisms of translation regulation by uORFs.
Discussion
Applications of Multi-Color Single-Molecule Translation Imaging
Expression of SunTag and MoonTag mRNAs in the same cell enables direct comparison of two different types of mRNAs; for example, of different genes or different mRNA isoforms. Adding a third orthogonal nascent chain labeling system—for example, the recently developed “Frankenbody” (Zhao et al., 2018)—would further increase the possible number of mRNA species that can be analyzed simultaneously. The SunTag and MoonTag systems can also be combined in single mRNAs to interrogate complex aspects of translation. In this study, we show that multi-color translation imaging can be used to assess translation of the 3′ UTR, translation start site selection, and the dynamics of uORFs translation. A parallel study independently developed a multi-color translation reading frame imaging approach to visualize the kinetics of ribosome frameshifting on a viral RNA sequence (Lyon et al., 2018). Although the two studies investigate different biological processes, both studies uncover a high degree of translation heterogeneity among different mRNA molecules, and it is possible that widespread translational heterogeneity may be the norm rather than an exception for most aspects of mRNA translation. The multi-color translation imaging approach will be an important tool to unravel the prevalence, kinetics, and molecular mechanisms of such translational heterogeneity.
Mechanisms of Translation Start Site Selection Heterogeneity
Using the MoonStart reporter, we found that, overall, ∼7% of ribosomes show OOF (i.e., SunTag frame) translation. This value likely represents a lower limit for endogenous genes because (1) our MashTag system only reports on translation of one of the two alternative reading frames; (2) the MoonStart reporter contains a very strong translation start site sequence context, limiting leaky scanning and downstream initiation (in contrast, many endogenous mRNAs have a suboptimal start site context; Noderer et al., 2014); and (3) the MashTag reporter contains a short, unstructured 5′ UTR lacking regulatory elements or additional AUG sequences, limiting upstream start site selection. Endogenous 5′ UTRs can be far more complex and, therefore, could result in a substantially higher upstream initiation rate. Indeed, introducing the endogenous 5′ UTR sequence of SERGEF significantly increased OOF translation. Together, these findings suggest that alternative start site selection and OOF translation are likely widespread phenomena on many mRNAs.
A subset of mRNA molecules (∼25%) showed a significantly altered likelihood of translation initiation on alternative start sites compared with the bulk of mRNAs in our analysis. There are several possible explanations for the variable frequency of alternative translation start site usage on different mRNAs. First, TSS usage is known to be highly variable in mammalian cells (Forrest et al., 2014), and differences in TSS usage create mRNAs with different 5′ UTRs that contain distinct translation start sites. Second, RNA modifications, specific RNA structures, or binding of regulatory proteins may alter the probability that translation is initiated on a given start site. Indeed, certain mRNA structures can bias translation initiation site selection in yeast (Guenther et al., 2018). Although differences in nucleotide sequence would result in a permanent difference in translation start site usage, RNA modifications, RNA structures and RBP-dependent regulation could be dynamically regulated to alter start site usage over time (Zhou et al., 2018). For a small number of mRNAs, we indeed observed a change in relative start site usage over time, suggesting that start site selection might indeed be dynamically regulated for single mRNAs. Identifying regulatory mechanisms that shape start site usage is an important future goal, and the MashTag system will be a valuable tool for investigating such mechanisms.
For many mRNA molecules, the average usage of different translation start sites was similar. Nonetheless, the timing of translation initiation and the precise order of initiation events in different reading frames was unique for each mRNA molecule, which likely reflects the inherent stochasticity in start site selection by individual ribosomes. Our results also revealed that the frequency of translation initiation at MoonTag and SunTag start sites was positively correlated over time on many mRNAs. We have shown previously that the translation rate is not constant over time on individual mRNAs but can show a burst-like behavior (Yan et al., 2016). The fact that multiple translation start sites show correlated bursting suggests that the burst-like behavior of translation originates upstream of translation start site selection, likely at the step of 43S pre-initiation complex recruitment to the mRNA. In summary, although translation start site selection by individual ribosomes appears to be mostly stochastic, the probability of usage of individual start sites is under tight control, probably both transcriptionally and post-transcriptionally.
Translation of uORF-containing mRNAs showed many similar characteristics as translation of mRNAs with a single AUG start codon: (1) most mRNAs contained multiple, intermittently used translation start sites; (2) the selection of a translation start site by individual ribosomes appeared to be stochastic; (3) usage of different start sites tended to correlate over time; (4) a substantial fraction of mRNA molecules (∼28%) showed a distinct translation start site usage pattern compared with the bulk of mRNAs; and (5) evidence of a temporal burst in uORF translation, uORF skipping, and/or translation reinitiation was obtained. These results suggest that the dynamics and heterogeneity of start site selection are inherent properties of translation and are likely valid for many types of mRNAs.
Consequences of Widespread Alternative Translation Start Site Selection
Pervasive variability in start site selection likely has major implications for cellular function. In-frame alternative start site selection results in N-terminally extended or truncated proteins, which would especially affect the function of proteins containing N-terminal localization signals, like mitochondrial targeting sequences. OOF translation initiation results in polypeptides with a completely different amino acid sequence that are likely misfolded and non-functional; they would not only waste cellular energy but could cause considerable proteotoxic stress to the cell as well. The frequency of OOF translation may be somewhat limited by nonsense-mediated mRNA decay, which may degrade mRNAs that have a high probability of OOF translation (Lykke-Andersen and Jensen, 2015). Although widespread alternative translation initiation can be costly, a high degree of flexibility in translation start site selection can also be exploited by the cell. For example, it enables different types of post-transcriptional gene regulation (e.g., uORF-dependent translational control), and it may be important for regulated changes in N-terminal protein sequences as well. An important future question is whether extensive OOF translation is generally functionally important for the cell or, rather, reflects errors in translation start site selection.
STAR★Methods
Key Resources Table
| REAGENT or RESOURCE | SOURCE | IDENTIFIER |
|---|---|---|
| Chemicals, Peptides, and Recombinant Proteins | ||
| DMEM | GIBCO | Cat# 31966021 |
| Leibovitz’s L15 medium | GIBCO | Cat# 21083-027 |
| Opti-MEM | Sigma-Aldrich | Cat# 11058-021 |
| Fetal Bovine Serum (FBS) | Sigma-Aldrich | Cat# F7524 |
| TRIsure | Bioline | Cat# 38033 |
| FuGENE 6 Transfection Reagent | Promega | Cat# E231A |
| DMSO | Sigma-Aldrich | Cat# D8418-1L |
| Polyethylenimine | Polysciences Inc | Cat# 23966 |
| Penicillin-Streptomycin | GIBCO | Cat# 15140-122 |
| Polybrene | Santa Cruz Biotechnology, Inc | Cat# sc-134220 |
| Doxycycline | Sigma-Aldrich | Cat# D9891-1G |
| Rocaglamide | Sigma-Aldrich | Cat# SML0656-100UG |
| Puromycin | ThermoFisher Scientific | Cat# 12122530 |
| Cycloheximide | Sigma-Aldrich | Cat# C4859 |
| Anti-Digoxigenin-AP | Sigma-Aldrich | Cat# 11093274910 |
| Experimental Models: Cell Lines | ||
| Human U2OS cells | Tanenbaum lab | Cat# HTB-96 |
| HEK293T cells | Tanenbaum lab | Cat# CRL-3216 |
| Recombinant DNA | ||
| See Data S1 for all plasmids used in the paper | This study | N/A |
| Software and Algorithms | ||
| ImageJ | NIH | https://imagej.nih.gov/ij/ |
| Micromanager | Micro-Manager 1.4.22 | https://micro-manager.org/ |
| NIS-Elements Imaging Software | Nikon | HC 5.11.01 |
| Graphpad Prism 7 | GraphPad Software Inc | https://www.graphpad.com/scientific-software/prism/ |
| MATLAB R2012b | The Mathworks, Inc. | https://nl.mathworks.com/products/matlab.html |
| R 3.5.1 | R Project for Statistical Computing | http://www.r-project.org/ |
| TransTrack (MATLAB) | This Study | https://github.com/TanenbaumLab |
| RiboFitter (R) | This Study | https://github.com/TanenbaumLab |
| Other | ||
| 96-well glass bottom imaging plates-(Matriplates) | Brooks Life Science Systems | Cat# MGB096-1-2-LG-L |
| NorthernMax-Gly Kit | ThermoFisher Scientific | Cat# AM1946 |
| DIG RNA Labeling Mix | Sigma-Aldrich | Cat# 11277073910 |
| Deposited Data | ||
| Raw data of imaging experiments | Mendeley Data | https://doi.org/10.17632/p5bgwz8bx2.1 |
Contact for Reagent and Resource Sharing
Further information and requests for resources and reagents should be directed to and will be fulfilled by Marvin Tanenbaum (m.tanenbaum@hubrecht.eu). Key plasmids will also be deposited on Addgene.
Experimental Model and Subject Details
Cell lines
Human U2OS cells and HEK293T (ATCC) were grown in DMEM (4.5 g/L glucose, GIBCO) containing 5% fetal bovine serum (Sigma-Aldrich) and 1% penicillin/streptomycin (GIBCO). Cells were grown at 37°C and with 5% CO2.
Method Details
Plasmids and reporters
Sequences of all plasmids used in this study are provided in Data S1. The following nanobody sequences were obtained and ordered as G-blocks from IDT:
-
•
Nb-BF10;
-
•
Nb-CA52;
-
•
Nb-2B2;
-
•
Nb-127D1;
-
•
Nb-54B12;
-
•
Nb-P2;
-
•
Nb-gp41.
All peptide array sequences were synthesized by Genewiz. To design the MashTag, the following considerations were taken into account: 1) each repeat of the SunTag or MoonTag in the MashTag had to encode the same SunTag or MoonTag amino acid sequence; 2) no AUG start codons or stop codons (TGA, TAA, or TAG) were introduced in any reading frame; 3) different codons were used for the same amino acid sequence in different copies of the SunTag and MoonTag peptides to introduce nucleotide sequence variation between individual repeats; 4) all sites for restriction enzymes were removed.) Of note, all translation start sites in the MashTag reporters contain a strong Kozak sequence (GCCACCAUGG). After generation of a MashTag containing plasmid, the size of the MashTag was checked by enzyme digestion, and the 5′ and 3′ ends were sequence verified. Because of difficulties in sequencing due to the repetitive nature of the MashTag, the middle part of the MashTag was not sequence verified for all plasmids.
Lentiviral infection and cell line generation
To produce lentiviruses, HEK293T cells were infected with the lentivirus plasmid of interest and lentiviral packaging vectors ps.Pax and p.MD2 using PEI (Polyethylenimine). One day after transfection, the medium was replaced with fresh medium. Virus-containing medium was collected 3 days after transfection. To infect U2OS cells with lentivirus, cells were seeded 24h before infection and grown to ∼60% confluency at moment of infection. The supernatant of the HEK293T cells containing the lentivirus was added to the U2OS cells. U2OS cells were spin-infected for 90-120 minutes at 2000 rpm at 25°C. After spin-infection, the medium was replaced with fresh medium and cells were cultured for at least 2 days before any further analysis or processing. Where applicable, cells were FACS-sorted as single cells in 96-well plates to generate monoclonal cell lines.
To generate a cell line with stable expression of the MoonStart-MashTag reporter from a single genomic locus, a TALEN-based knock-in of the reporter was made into the AAVS1 locus (in the PPP1R12C gene). The Moon/Sun cells were transfected with two TALEN plasmids (to cut both strands of the DNA) and a plasmid encoding the MoonStart-MashTag reporter driven by a tetracycline inducible promoter, two homology arms to direct homologous repair and a P2A-puro cassette followed by a BGH polyadenylation sequence to select for cells with correct integration. To select for cells with a successful knock-in, cells were subjected to puromycin (2 μg/ml) treatment 4 days after transfection. To check whether the knock-in of the MashTag reporter was successful and had occurred in the correct location, a northern blot was performed (NorthernMax-Gly, ThermoFisher). A probe was designed targeting the BGH polyadenylation sequence. Genomic integration into the correct locus should yield an mRNA with a length of ∼1.3 kb; 0.3kb of the endogenous PPP1R12C mRNA fused to 0.9kb of P2A-puro-BGH sequence. On the northern blot, only a single band was visible at the correct size (1.3kb), indicating that the knock-in site was correct and that no off-target integration had occurred.
Single-molecule translation imaging
For translation imaging experiments, all imaging was done using U2OS cell lines stably expressing TetR (for inducible expression), PP7-2xmCherry-CAAX, either MoonTag-Nb-GFP or MoonTag-Nb-HaloJF646 and scFv-sfGFP. Cells were seeded in glass bottom 96-wells plates (Matriplates, Brooks) at 15%–20% confluency 2 days before imaging. DNA plasmids encoding reporter mRNAs were transfected 1 day prior to imaging using Fugene (Promega) and for MashTag imaging experiments, a BFP-encoding plasmid was co-transfected (DNA ratio 1:1), which was used for initial identification of transfected cells. One hour prior to imaging, medium was replaced with CO2-independent pre-warmed L15/Leibovitz’s (Thermo Fisher) containing 50nM HaloJF646. After Halo incubation for 1h at 37°C, the cells were briefly rinsed twice with L15/Leibovitz’s medium and washed once with L15/Leibovitz’s for 15 minutes. Doxycycline (1 μg/ml) was added 15-20 minutes before start of imaging to induce transcription of the reporter. To select cells for imaging, approximately 50 positions were first selected based on BFP signal (the co-transfection marker). From this selection, approximately 10 positions were chosen for time-lapse imaging based on the presence of translation sites and the absence of protein aggregates. For time-lapse imaging, images were acquired at 30 s interval with 500ms exposure times for 30 minutes, unless otherwise noted. A single Z-plane was imaged, which focused on the bottom plasma membrane of the cells. Images were acquired using a Nikon TI inverted microscope with perfect focus system equipped with a Yokagawa CSU-X1 spinning disc, a 100x 1.49 NA objective and an iXon Ultra 897 EM-CCD camera (Andor) using Micro-Manager Software (Edelstein et al., 2010) or NIS Elements Software (Nikon).
Quantification and Statistical Analysis
Screening of antibody-peptide pairs
For screening of antibody-peptide pairs, seven different nanobodies fused to GFP, were cotransfected with their respective Mito-mCherry-peptide arrays in HEK293T cells and analyzed for co-localization at mitochondria.
Stoichiometry of MoonTag nanobody-peptide
The number of MoonTag nanobodies that could bind to a peptide array was determined as described previously (Tanenbaum et al., 2014).
Tracking single mRNAs using TransTrack
Only mRNAs were selected for analysis that contained translation signal in either one of the two channels (i.e., SunTag or MoonTag). Maximally 10 mRNAs were tracked per cell. To measure the intensity of fluorescence on mRNAs over time, we generated a semi-automated translation spot tracking in MATLAB called TransTrack. TransTrack software is freely available, including documentation, through Github.
Fluorescence intensity of mRNAs
To analyze whether mRNAs associated with both SunTag and MoonTag signals are mRNA multimers, mCherry fluorescence intensity was measured for mRNAs that were associated with only MoonTag signal or for mRNAs associated with both SunTag and MoonTag signals. For intensity measurements, an ROI of 8x8 pixels was created that was used to measure mRNA mCherry intensity. Local background was subtracted from all measurements.
Normalization of fluorescence
Bleach correction was performed in TransTrack. In brief, to correct for photobleaching during the imaging, the fluorescence intensity of the entire field of view was determined at each time point of the movie. The fluorescence intensity over time was fit with an exponential decay distribution to determine the bleaching rate, and this rate was used to correct all fluorescence images.
We also found that cells with higher expression of the MoonTag-nanobody showed on average higher intensities of MoonTag translation sites (see Figure S3A). Therefore, MoonTag translation site intensities were normalized to total cell MoonTag intensities. As SunTag translation site intensities poorly correlated with total cell intensities, no further correction was performed for the SunTag signal (see Figure S3B).
Translation elongation rates of MashTag mRNAs
The elongation rates of ribosomes on individual mRNAs was determined by harringtonine run-off experiments as described previously (Yan et al., 2016). In brief, the translation inhibitor harringtonine (3 µg/ml) is added to cells expressing the SunStart reporter, which freezes ribosomes on the start codon. Therefore, harringtonine prevents new ribosomes from translating the reporter, and allows ribosomes that are already in the translation elongation phase to continue translating until they reach the stop codon. As ribosomes terminate one-by-one, the SunTag signal of the terminating ribosome dissociates from the mRNA, resulting in a gradual reduction of GFP fluorescence on the mRNA until all ribosomes have terminated translation. The fluorescence decrease was tracked for each mRNA and normalized to the average intensity of the 3 time points before drug administration. Translation elongation rates were then calculated based on the slope of the GFP intensity trace, as described previously (Yan et al., 2016).
Plateau intensity of SunTag-frame ribosomes
The plateau intensity of a single ribosome translating the MashTag reporter (See Figure 2F), is equal to the intensity of a mature MashTag protein. To determine the intensity of mature proteins translated in the SunTag frame, mature proteins were tethered to the plasma membrane by encoding a C-terminal prenylation sequence (CAAX) in the reporter in the SunTag frame. This reporter was transfected into Moon/Sun cells. No doxycycline was added in these experiments to keep the amount of mature protein to a minimum and thereby enable single-molecule imaging of mature proteins. Using identical imaging parameters as those used during translation imaging, images were acquired of cells containing mature membrane-tethered SunTag protein. For 15 foci (i.e., mature proteins) per cell the intensity was determined. For local background correction, the intensity within a ROI of the same size was determined in a region next to the foci. The mean intensity of 24xMashTag foci in the SunTag frame was 73.5 ± 35.7 a.u. (mean ± SD). For each reporter, the plateau intensity was normalized to the number of SunTag repeats. For example, this value was corrected to 110.3 a.u. for the MoonStart-MashTag reporter, as the MashTag in this reporter contained 36 instead of 24 repeats (see ‘Theoretical single ribosome traces parameters per reporter’ for other reporters).
Plateau intensity of MoonTag-frame ribosomes
The plateau intensity of a ribosome translating the MashTag in the MoonTag frame could not be determined with the approach described above, as single mature proteins encoded in the MoonTag frame could not be reliably detected. As an alternative approach, the MoonTag translation site intensity of MoonStart mRNAs was determined (See Figure S3C). For this, only mRNAs were included that contained exclusively MoonTag signal. The mean MoonTag intensity on MoonStart mRNAs was 1354.13 ± 739.65 a.u. (mean ± SD). This fluorescence signal originated from multiple ribosomes. Therefore, to determine the approximate MoonTag intensity associated with a single ribosome, the average number of ribosomes translating a MashTag mRNA was determined. Since the MashTag reporter contained the same promoter, 5′UTR and start codon as our previously described SunTag reporter (Yan et al., 2016), and both reporters had similar translation elongation rates, we assumed that both reporters had similar ribosome densities. Based on the previously determined inter-ribosomal distance on the SunTag reporter (Yan et al., 2016), the average number of ribosomes on a MashTag mRNA could be calculated (correcting for mRNA length), which was 17.8. Based on the MoonTag translation site intensity and the number of ribosomes per mRNA, the average MoonTag intensity associated with a single ribosome on the MashTag reporter could be calculated, which was 76.07 a.u. Since only the ribosomes located downstream of the MashTag (i.e., on the BFP sequence) were associated with the full 36 copies of the MoonTag, a correction needed to be applied to obtain the intensity of a 36xMoonTag protein (i.e., the plateau intensity). After applying this correction (as described previously (Yan et al., 2016)), the plateau intensity of a ribosome translating the 36xMashTag in the MoonTag frame was calculated to be 132.7 ± 72 a.u. (mean ± SD), and the intensity of a single MoonTag frame encoded MashTag repeat was derived (3.69 a.u.). The combination of this single repeat intensity value and the number of repeats in a reporter was used to determine the plateau intensity of a single ribosome on each reporter (see ‘Theoretical single ribosome traces parameters per reporter’).
Theoretical single-ribosome traces parameters per reporter
Based on the specific parameters for each reporter, and based on the equations shown below, we calculated the buildup time, plateau time, and plateau intensity of a single ribosome. For each reporter, the values describing the theoretical single ribosome trace were calculated for both the MoonTag and the SunTag signal. To check whether any SunTag ribosomes would be called on the MoonTag only reporter by our analysis pipeline, the theoretical single ribosome trace of MoonStart- 36xMashTag values were used. Similarly, the SunStart-36xMashTag frame values were used to test whether any SunTag ribosomes would be scored on the MoonTag reporter. These theoretical traces were selected, as these reporters did not contain MoonTag and SunTag peptides, respectively, so no true theoretical single ribosome intensity trace could be generated.
Equations
Definitions
tbuildup = time in sec to build-up from no signal to plateau intensity
tplateau = time in sec from reaching plateau intensity to termination
Iplateau = plateau intensity in a.u.
nt1st_peptide = nucleotide position of ribosome where peptide can first be bound by antibody
ntstart_plateau = nucleotide position of ribosome where the plateau phase starts
nttermination = nucleotide position of ribosome at moment of termination. The length of the coding sequence (cds) in nucleotide is used.
Fixed values for each reporter
elongation speed = ribosomal translocation speed during translation in nt/s. Based on the elongation speed of 2.88 codons/s, this constant is 8.65 nt/s.
rib. exit = ribosome exit tunnel in nt. Based on previously used ribosome exit tunnel of 30 amino acids.
Isingle peptide = fluorescence intensity as a results of one antibody binding to a peptide epitope in a.u. One MoonTag repeat was 3.69 a.u. and one SunTag repeat was 3.06 a.u. using our imaging settings.
Constants based on reporter
|r| = length of 1 peptide epitope in nt.
start_linker = distance between AUG and start of 1st peptide epitope in nt.
r = number of repeats.
linker = length of an optional linker in repeat array used for cloning (in nt).
| reporter | translation signal | type of translation | length cds (nt) | Start_ linker (nt) | |r| (nt) | R | linker (nt) | buidup time(s) | plateau time(s) | plateau intensity (a.u.) MoonTag | plateau intensity (a.u.) SunTag |
|---|---|---|---|---|---|---|---|---|---|---|---|
| Mstart-Mash1-BFP | MoonTag | main frame translation | 4587 | 35 | 105 | 36 | 36 | 429 | 75 | 133 | |
| SunTag | alternative start site selection | 4587 | 39 | 105 | 36 | 36 | 429 | 74 | 110 | ||
| SunTag | frameshifting after 25% of MashTag | 4587 | 980 | 105 | 27 | 36 | 320 | 75 | 83 | ||
| SunTag | frameshifting after 50% of MashTag | 4587 | 1925 | 105 | 18 | 36 | 210 | 75 | 55 | ||
| Sstart-Mash1-BFP | SunTag | main frame translation | 4587 | 39 | 105 | 36 | 36 | 429 | 74 | 110 | |
| MoonTag | alternative start site translation | 4587 | 35 | 105 | 36 | 36 | 429 | 75 | 133 | ||
| Sstart-SunTag-kif18b | SunTag | main frame translation | 4386 | 69 | 72 | 24 | 0 | 191 | 289 | 74 | |
| MoonTag | background MoonTag signal on SunTag | 4587 | 35 | 105 | 36 | 36 | 429 | 75 | 133 | ||
| Mstart-MoonTag-kif18b | MoonTag | main frame translation | 4017 | 12 | 60 | 24 | 0 | 159 | 286 | 88 | |
| SunTag | background SunTag signal on MoonTag | 4587 | 39 | 105 | 36 | 36 | 429 | 74 | 110 | ||
| 12xMoon-12xSun-kif18b | SunTag | main frame translation | 4440 | 39 | 81 | 12 | 0 | 103 | 386 | 44 | |
| MoonTag | main frame translation | 4440 | 1002 | 72 | 12 | 0 | 92 | 287 | 37 | ||
| MT-kif18b-STOP-ST-BFP | MoonTag | no readthrough | 4017 | 12 | 60 | 24 | 0 | 159 | 286 | 88 | |
| MoonTag | readthrough | 6495 | 12 | 60 | 24 | 0 | 159 | 545 | 88 | ||
| SunTag | readthrough | 6495 | 4056 | 72 | 24 | 0 | 191 | 45 | 74 |
Noise in MoonTag intensity measurements
To determine the effects of differential nanobody occupancy over time, as well as imaging noise on the fluorescence intensity of the MoonTag signal, cells were treated with cycloheximide (CHX) (200 μg/ml). CHX locks ribosomes on the mRNA and limits changes in MoonTag signal due to changes in ribosome occupancy. Thus, changes in MoonTag fluorescence in CHX-treated cells mostly represent nanobody occupancy changes and imaging noise. The MoonTag fluorescence intensity was measured on individual mRNAs imaged at a time interval of 1 s or 60 s. A small decrease in MoonTag intensities was observed after prolonged CHX administration (which may reflect recycling of stalled ribosomes), therefore a correction was applied to normalize for this effect. To calculate the overall intensity fluctuations of MoonTag signals in CHX-treated cells, the standard deviation of the fluorescence intensity was determined for 6 consecutive time points and the standard deviation was then divided by the mean fluorescence intensity over the same time interval.
Excluding frameshifting as a source of SunTag signal
Based on the combination of the translation elongation rate, the plateau intensities and the length of the MashTag and downstream BFP, the theoretical single ribosome traces in either the MoonTag or the SunTag frame can be calculated (see ‘Theoretical single ribosome traces parameters per reporter’).
To determine the theoretical single ribosome intensity trace for a ribosome translating a MoonStart mRNA in the SunTag frame, two different scenarios were considered: 1) ribosomes could translate the MashTag reporter in the SunTag frame from the start of the coding sequence until the stop codon, or 2) ribosomes could start translating the coding sequence in the MoonTag frame and frameshift into the SunTag frame at some point during translation elongation. In the first scenario, the SunTag intensity trace on the MoonStart reporter would be similar to the SunTag intensity trace on the SunStart reporter (i.e., containing all 36 SunTag peptides). In the second scenario, fewer SunTag peptides would be translated, resulting in a shorter buildup phase and a lower plateau intensity. Assuming frameshifting occurs at a random position on the MashTag sequence, frameshifting would occur on average at the end of 18th MashTag repeat (halfway through translating the 36xMashTag). Therefore, an intensity trace was calculated that was predicted by the second (frameshifting) model, which contains 18 SunTag repeats. Frameshifting events that occur in the last few repeats of the MashTag may result in a very weak signal, which could evade detection and bias the set of experimentally-detected frameshifted translation events toward more upstream frameshifting events that contain more SunTag peptides. Therefore, we also calculated the theoretical intensity trace assuming on average 27 SunTag peptides were translated, which corresponds to a detection limit of 18 SunTag peptides, well within our detection range (Yan et al., 2016).
To generate intensity traces of single ribosomes translating the SunTag frame, both for the Emi1-5′UTR-SunStart reporter and the MoonStart reporter, translation events were manually selected that were most likely to represent single ribosome translation events. For this, all translation events were selected that contained SunTag signal in at least 3 consecutive time points (1.5 min) and at most 16 consecutive time-points (8 min). The 8 min threshold was chosen based on the expected duration of a single ribosome translating the MashTag reporters of 8.4 min. All translation events that matched these criteria were aligned at the moment of GFP disappearance (i.e., translation termination) and the GFP intensity of the preceding 8 min was determined. All traces that contained a second translation event within the 8 min preceding time-period, or traces starting in the first 8 min of the movie were removed from the analysis. Average intensities and SEMs of all translation events included in the analysis were then calculated.
Intensity measurements of mature SunTag proteins
The intensity of individual mature SunTag proteins was measured for both the MoonStart-36xMashTag-CAAX and SunStart-36xMashTag-CAAX. Experimental settings and analysis of the MoonStart-36xMashTag-CAAX and SunStart-36xMashTag-CAAX (note that the CAAX motif was in the SunTag frame in both cases) were similar to the experiments described in section ‘Plateau intensity of SunTag-frame ribosomes’ to determine the plateau intensity of ribosomes translating the SunTag frame, except that higher laser powers and shorter exposure times were used in the analysis of mature protein intensities to facilitate detection.
Fitting intensity traces using RiboFitter
To determine the number of ribosomes translating an mRNA and the exact time at which single ribosomes initiated translation, we developed a computational model in R, called RiboFitter. RiboFitter is freely available, including documentation, through Github.
RiboFitter reconstitutes a raw intensity trace by positioning one or more theoretical intensity profile of a single translating ribosome along the time axis of the trace. The sum intensity for each time point of all theoretical single ribosome intensity traces is calculated and compared to the raw intensity trace at that time point. By optimizing the number and the position of ribosomes in an iterative fashion RiboFitter achieves the optimal fit to the data.
| [1] |
Equation 1 describes the intensity profile of a single translating ribosome, which initiates translation at time t (see Figure 2F). Iplateau, tbuildup and tplateau are constant values for each reporter, and are dependent on the length of the mRNA and number of MashTag repeats, as described in sections ‘Translation elongation rates of MashTag mRNAs’, ‘Plateau intensity of SunTag-frame ribosomes’, ‘Plateau intensity of MoonTag-frame ribosomes’, and ‘Theoretical single ribosome traces parameters per reporter’. The raw intensity traces were reassembled in silico by fitting the sum of one or more theoretical intensity traces of individual ribosomes that initiate translation at time points t = ti [2]. The in silico fitting of ribosomes was performed on the SunTag and MoonTag signals independently and the output from both signals per mRNA were combined after the fitting.
| [2] |
To obtain an initial estimate of the number of ribosomes translating an mRNA based on the raw intensity trace, the area under the curve (AUC) of the entire intensity trace was divided by the AUC of the intensity trace of a single translating ribosome. If the AUC of an mRNA did not exceed half of the expected AUC of a translating ribosome, no further fitting of ribosomes to the intensity trace was performed and the number of ribosomes in the raw intensity trace was determined to be 0. If the raw intensity curve was determined to exceed half of the expected AUC of a translating ribosome, the model estimated the number of translation events in each raw intensity trace based on the AUC values. These translation events were then distributed along the raw intensity trace with a probability that is weighted by the intensity of the trace at each time point. The sum of all the positioned single ribosome intensity traces was then determined, and the sum intensity trace was compared with the raw intensity trace to determine a goodness of fit, which was defined as the root mean square error (RMSE) between the fit and the data.
After initial placement of translation events, the number of ribosomes and their time of initiation (i.e., their relative position along the time axis of the trace) were altered according to the parameters shown below, resulting in a new fit. If the RMSE between the new fit and the data was lower (i.e., the fit improved), the new positions of translation events were used as a starting point for the next iteration. If the RMSE did not improve, the previous positions were used again as a starting point for the next iteration. Of note, if the best fit was achieved with a trace containing no ribosomes, the number of ribosomes was considered 0, even if the AUC of the total intensity trace exceeded half of the expected AUC of a translating ribosome. The process of re-positioning translation events and accepting or rejecting the new positions was repeated for 1000 iterations to obtain a good fit. A limit of 1000 iterations was selected, because minimal improvements in the fit were achieved with additional iterations (see Figures S3D–S3F). Since the fitting process is stochastic, multiple runs of RiboFitter could result in different outcomes. RiboFitter was therefore run 10 independent times for each intensity trace to check for variations in position of translation initiation events and the final RMSE, and the run with the best fit was used to generate the final fit. Note that the 10 runs generally resulted in very similar fits (see Figure S3D), demonstrating the robustness of this approach.
Parameters used to fit intensity trace to fitting trace:
| Parameter | Value |
|---|---|
| Probability to locate a ribosome at time point t in first iteration | |
| Number of iterations | 1000 |
| Probability to add or remove a ribosome | 0.1 |
| Probability to relocate the time point at which the ribosome initiates | 0.3 |
| Relocation distance (sec) (i.e., repositioning a ribosome along the trace) | The distance to move a translation event is randomly drawn from a normal distribution with μ = 0 s. and σ = 25 s. |
Many mRNAs already contained SunTag and/or MoonTag signal at the first time point of the intensity trace. However, translation initiation of the ribosomes present on the mRNA at the first time point of the movie took place before the start of the trace, preventing proper fitting. To overcome this limitation, hypothetical time points were added before the start of the intensity trace. The number of added time points depended on the tbuildup per reporter. Addition of extra time points allowed the model to position initiation events on the trace prior to the start of image acquisition and, hence, to generate a signal that resembles the intensity at t = 0. In the initial placement of ribosomes during the first iteration, the probability of positioning an initiating ribosome before t = 0 was equal to the maximal probability to position an initiation event at any time point of the data. The hypothetical time points were not included in calculating the RMSE, as there was no raw intensity measurement that could be compared to the fit during this period.
As output, RiboFitter generated an overview containing the following information for both the MoonTag and the SunTag signal on each mRNA: 1) a graph showing the best fit and the RMSE, 2) the total number of ribosomes per reading frame on the mRNA, 3) the initiation time of each ribosome. The initiation time and the duration of translation of a single ribosome could then be used to calculate for each time point the number of ribosomes per reading frame on the mRNA.
Error range for intensity fitting approach
The intensity profile of a single translating ribosome, which is used in the iterative intensity fitting approach described above (see ‘Fitting intensity traces using RiboFitter’), is based on the experimentally determined average ribosomal elongation speed and average single ribosome plateau intensities. However, both the translation elongation speed and plateau intensity are highly variable values when comparing different ribosomes, resulting in distinct values for the AUC of intensity traces for different ribosomes. Using the average values for the single ribosome intensity trace does not capture this variation and does not allow for an estimation of the error in RiboFitter that is caused by heterogeneity in single ribosome intensity traces. As the values obtained through RiboFitter are used for subsequent calculations of the frequency of different translation paths (see Figures 3A and 3B), no error range can be estimated for the usage frequency of the different translation paths either when using the average single ribosome intensity trace. Therefore, we developed a second approach (termed the variable AUC approach) to estimate the error range in RiboFitter.
Rather than creating a single AUC based on the average Iplateau, tbuildup and telongation, the variable AUC approach creates a unique AUC for each individual ribosome used in the fitting. The variable AUC algorithm simulates an AUC by randomly selecting one value for the plateau intensity and one value for the elongation rate from the respective normal distributions with means and standard deviations equal to the experimentally determined values for these parameters. A lower limit of 0.5 amino acids per second was introduced for the elongation rate, as the normal distribution of the elongation rates that was generated also contained unrealistically small values for the elongation rate (including negative values). After the algorithm generated a single ribosome intensity trace, the AUC of that trace was calculated and compared to the AUC of the translation site intensity trace. If the value for the AUC of the single ribosome intensity traces was smaller than the value of the AUC of the translation site intensity trace, a new unique single ribosome intensity trace was generated, and the value of the AUCs were added together and compared to the value for the translation site intensity again. This process is repeated until the sum of the AUC values of all the individual ribosomes is equal to or greater than the AUC value of the translation site. The number of single ribosome traces needed to match the AUC of the translation site intensity trace is then recorded.
As the intensity traces of the MoonTag and the SunTag signals are separated, the algorithm provides the number of ribosomes translating in each frame. Based on the number of ribosomes and the duration of the intensity trace, the translation initiation rate was calculated in each frame (see ‘Translation initiation rates’). The frequency of SunTag translating ribosomes relative to total number of ribosomes per mRNA was calculated to determine the percentage of OOF translation (see ‘SunTag ribosome frequency’). The process of determining the number of ribosomes translating the mRNA (based on the variable AUC approach), calculating the translation rates and determining the SunTag translation frequency was performed for all mRNA molecules in an experiment and the median value was determined. This entire process was then repeated 1000 times, resulting in 1000 values for the median, allowing us to calculate a range for these median values (i.e., an error range). Comparison of the two different algorithms (fitting intensity traces with fixed or variable single ribosome AUCs) to calculate the OOF frequency indicated that both approaches yielded comparable results (see Figure S4A). Therefore, both approaches can be used to define the number of ribosomes per reading frame based on the intensity trace. Depending on the downstream analysis, one algorithm can be preferred over the other. The fixed AUC approach provides the possibility to analyze changes in translation over time as individual translation events are positioned along the time axis, whereas the second algorithm with variable single ribosome AUCs enables calculation of error ranges for the fitting process.
SunTag ribosome frequency
As described in the section ‘Fitting intensity traces using RiboFitter’, the number of MoonTag and SunTag ribosomes per mRNA was calculated. To determine the fraction of SunTag ribosomes, the number of SunTag ribosomes was divided by the sum of the number of MoonTag and SunTag ribosomes.
Translation initiation rates
To determine translation initiation rates of individual mRNAs, the total number of ribosomes translating both SunTag and MoonTag frames was calculated for each mRNA, as described in the section ‘Fitting intensity traces using RiboFitter’. Initiation rates in each frame were then calculated by dividing the total number of initiating ribosomes by the duration of the trace. Overall initiation rates were based on the sum of all ribosomes translating the MoonTag and the SunTag frames. Ribosomes translating the blank frame were not included in the calculation of initiation rates, as they could not be determined.
3′ UTR translation
In the 3′ UTR translation reporter, translation of the coding sequence results in MoonTag signal, while translation of the 3′ UTR results in SunTag signal. To determine the number of ribosomes translating the 3′ UTR for each mRNA, the number of ribosomes translating both MoonTag and SunTag was determined as described in the section ‘Fitting intensity traces using RiboFitter’. For the fitting process of the 3′ UTR translation reporter a separate theoretical single ribosome intensity trace had to be developed, because the 3′UTR translation reporter had different numbers of SunTag and MoonTag repeats and the coding sequence was different in length than the MashTag reporter (see ‘Theoretical single ribosome traces parameters per reporter’). The theoretical single-ribosome intensity trace of the SunTag was based on a buildup time of 191 s and a plateau time of 45 s, which correspond to the time to translate 24xSunTag repeats and the downstream linker sequence, respectively. The single ribosome trace of the MoonTag was based on a buildup time of 160 s and a plateau time of 286 s, which correspond to the time to translate 24xMoonTag repeats and the downstream sequence (Kif18b). However, if a ribosome reads through the stop codon (which is likely the predominant mechanisms of 3′ UTR translation in this reporter), the plateau phase for MoonTag translation is longer (545 s instead of 286 s), as the sequence that is translated downstream of the MoonTag signal now includes the SunTag and BFP as well. A read-through ribosome therefore gives rise to more total fluorescence. To correct for this, a correction factor was calculated (0.78) based on the fold difference in the AUC of a single ribosome translating the MoonTag and Kif18b sequence compared to a ribosome translating the MoonTag, Kif18b, SunTag and BFP. To calculate the frequency of 3′UTR translation, the number of SunTag ribosomes was divided by the number of MoonTag ribosomes, after correction.
Calculating the # of ribosomes per translation path
Translation of a uORF-containing mRNA can result in various different translation paths. The options of single ribosomes were envisioned as a roadmap with a chance to initiate translation or terminate on each start site or stop site encountered by a ribosome, leading to 10 different paths (see Figure 6B):
-
1.
Initiation on uORF AUG; termination on uORF; dissociation from mRNA.
-
2.
Initiation on uORF AUG; termination on uORF stop codon; reinitiation of scanning; initiation on MoonTag frame AUG; translation of MashTag in MoonTag frame.
-
3.
Initiation on uORF AUG; termination on uORF stop codon; reinitiation of scanning; skipping of MoonTag frame AUG; downstream initiation in blank frame; translation of MashTag in blank frame.
-
4.
Initiation on uORF AUG; termination on uORF stop codon; reinitiation of scanning; skipping of MoonTag frame AUG; downstream initiation in MoonTag frame; translation of MashTag in MoonTag frame.
-
5.
Initiation on uORF AUG; termination on uORF stop codon; reinitiation of scanning; skipping of MoonTag frame AUG; downstream initiation in SunTag frame; translation of MashTag in SunTag frame.
-
6.
Skipping of uORF AUG; initiation on SunTag frame AUG; translation of MashTag in SunTag frame.
-
7.
Skipping of uORF AUG; skipping of SunTag frame AUG; initiation on MoonTag frame AUG; translation of MashTag in MoonTag frame.
-
8.
Skipping of uORF AUG; skipping of SunTag frame AUG; skipping of MoonTag frame AUG; downstream initiation in blank frame; translation of MashTag in blank frame.
-
9.
Skipping of uORF AUG; skipping of SunTag frame AUG; skipping of MoonTag frame AUG; downstream initiation in MoonTag frame; translation of MashTag in MoonTag frame.
-
10.
Skipping of uORF AUG; skipping of SunTag frame AUG; skipping of MoonTag frame AUG; downstream initiation in SunTag frame; translation of MashTag in SunTag frame.
The following equations were used to calculate the fraction of ribosomes in each path:
i = probability to initiate translation on an AUG start codon in optimal context.
r = probability to reinitiate scanning after uORF translation and termination at the uORF stop codon.
b, m, or s = probability to initiate translation on a near-cognate start site in either the blank (b), the MoonTag (m), or the SunTag (s) frame downstream of the MoonTag AUG start site
Multiple different paths lead to translation signal of one of the three frames. Therefore:
To allow calculations of the values for the different constants (i, r, n) and the fraction of ribosomes in each path, the following assumptions were made:
-
1.
The probability of a scanning ribosome to initiate translation on an AUG in optimal context (i.e., GCCACCAUGG) that is encountered, is constant irrespective of the position of the AUG in the mRNA.
-
2.
The probability to initiate on a near-cognate start site downstream of the MoonTag AUG start site is equal for all three frame (MoonTag, SunTag, and blank frame).
-
3.
The combined translation initiation rate of the MoonTag, SunTag, and blank frame is equal for the MoonStart and uORF reporter.
To determine the probability of a ribosome initiating translation on an AUG start site in optimal context (i), we examined the frequency of translation initiation at the AUG of the MoonStart reporter. The median initiation rate in the MoonTag frame on the MoonStart reporter was 0.63 ± 0.03 ribosomes/min (Note: all calculations in this section are based on the variable AUC approach intensity fitting approach, see ‘Error range for intensity fitting approach’), which represents a combination of translation initiation on the MoonTag AUG start codon, and skipping of the AUG and downstream initiation in the MoonTag frame. While we cannot de-convolve these two paths directly, we could measure the translation initiation rate in the SunTag frame (0.07 ± 0.01 ribosomes/min), which represents leaky scanning of the MoonTag AUG and downstream initiation on a near-cognate start site in the SunTag frame. One of our assumptions is that the frequency of initiation on near-cognate start sites downstream of the MoonTag AUG is equal in all three frames. Based on this assumption b = m = s = 0.33. Thus, if 0.07 ribosomes/min initiate on a near-cognate start site in the SunTag frame, we assume that 0.07 ribosomes/min are also initiating in the MoonTag frame on a near-cognate start site, leaving 0.63 - 0.07 = 0.54 ribosomes/min for initiation on the MoonTag AUG. Addition of a similar blank frame initiation rate (0.07 ribosomes/min) results in an overall initiation rate of 0.07 + 0.07 + 0.07 + 0.54 = 0.75 for all three frames combined. 0.54 of 0.75 ribosomes/min are initiating on the MoonTag AUG, which represents 0.54 / 0.75 = 0.72 of initiating ribosomes. Therefore i = 0.72, which is comparable to a previously determined probability of initiating on an AUG start codon with optimal context (i = 0.86 based on Ferreira et al., 2013).
Finally, we determined the remaining constant r, the probability to reinitiate scanning after uORF translation. To calculate r, we used the following equation:
Equation 1
To solve this equation, we first calculated the fraction of ribosomes translating the MoonTag frame. The median MoonTag translation rate on the uORF reporter was 0.28 ± 0.02 ribosomes/min. As we assumed that the combined translation initiation rate is equal for the MoonStart and uORF reporter, and we had already determined the total initiation rate for the MoonStart reporter to be 0.75 ribosomes/min, the total translation rate on the uORF reporter is also 0.75 ribosomes/min and thus the relative fraction of ribosomes translating the MoonTag frame is 0.28/0.75 = 0.37. Using this value, we could solve Equation 1, which led to r = 0.51.
In parallel, r was calculated based on the total blank frame translation rate, using the following equation:
Equation 2
To solve this equation, we first calculated the fraction of ribosomes translating the blank frame, based on the assumption that combined translation initiation rate is equal for the MoonStart and uORF reporter (0.75 ribosomes/min). The median MoonTag (0.28 ± 0.02 ribosomes/min) and SunTag translation (0.21 ± 0.02 ribosomes/min) rates were then used to calculate the blank frame translation rate: 0.75 - 0.28 - 0.21 = 0.26 ribosomes/min. The relative fraction of ribosomes translation the blank frame is therefore: 0.26 / 0.75 = 0.35. Using this value, we could solve Equation 2, and determine r = 0.64. The mean of the two values for r that were calculated by solving Equations 1 and 2 was used as the final value for r (0.58).
To include error ranges in the values for the constants r and i, similar calculations were performed as described above. However, instead of using the average value of the 1000 simulated median values that were obtained by the variable AUC simulations (see ‘Error range for intensity fitting approach’), we used values that were ± 1 SD away from the average for subsequent calculations. To generate conservative estimates of the error ranges of r and i, we used a value that was +1 SD for the SunTag initiation rate and −1 SD for the MoonTag initiation rate. By selecting the upper value (+1 SD) for the SunTag and the lower value (−1 SD) for the MoonTag (or vice versa), the largest possible error range is created, since the SunTag/MoonTag ratio is used to calculate the constants i and r. Using this approach, the following error ranges were determined: i = 0.67-0.76 and r = 0.53-0.63. These values were used to determine the error range of the fraction of ribosomes per path (See Figure 6B).
To confirm these constants, we took advantage of the experiment in which we removed the stop codon of the uORF. Based on the constants, we predicted the effects of removing the uORF stop codon on the translation paths and the translation rates per frame. Removal of the stop codon prevents reinitiation at the MoonTag AUG start codon after uORF translation and thus leads to an r = 0 value. With this new value for r, the fraction of ribosomes translating each translation path was computed. Then, the translation rate of the MoonTag and SunTag combined was calculated (r = 0; 0.18-0.24 ribosomes/min). Similarly, the translation rate of SunTag and MoonTag combined was calculated in the presence of the uORF stop codon (r = 0.58; 0.47-0.52 ribosomes/min). These calculations revealed that the removal of the uORF stop codon is predicted to induce a 54%–62% (from 0.50 to 0.21 ribosomes/min) reduction in the combined SunTag and MoonTag translation rate. When measuring the translation rates on the uORF reporter in the presence or absence of the uORF stop codon, we observed 55% reduction (from 0.56 ± 0.03 to 0.25 ± 0.02 ribosomes/min) in median translation rates, validating our calculated parameters.
Statistics of population differences
To compare different datasets, students’ t-tests or Mann-Whitney tests were performed, as indicated in the figure legends.
Statistical analysis of heterogeneity in OOF translation
To test whether observed differences in the amount of OOF translation on different MashTag reporter mRNAs could be explained by chance, the OOF translation frequency of individual mRNAs was compared to the OOF translation frequency of the total population of mRNAs. Per mRNA a binomial test was conducted, using the total number of ribosomes on each mRNA, the number of ribosomes translating the SunTag frame on the mRNA and the median SunTag translation frequency on all mRNAs. Note that this analysis had limited statistical power to detect MoonStart mRNAs with increased MoonTag translation; based on analysis of all mRNAs, 93% of ribosomes initiate translation in the MoonTag frame on the MoonStart reporter. Even if all ribosomes initiate in the MoonTag frame during our observation period (∼25 min, ∼25-50 initiating ribosomes) the bias toward the MoonTag start site is only moderately statistically significant, so much longer traces are needed to achieve strongly significant p-values for enrichment of MoonTag translation. Nonetheless, we do find 2/85 mRNAs with an enrichment in MoonTag translation initiation events with a p-value > 0.01 and 8/85 mRNAs with a p value > 0.05.
Linear regression analysis of intensities
To perform linear regression analysis on SunTag and MoonTag fluorescence over time, intensity traces of individual mRNAs were first smoothed by generating moving averages of 3 consecutive time points to reduce the technical noise in intensity traces. For every mRNA, MoonTag intensities were then plotted against SunTag intensities for each time point, linear regression analysis was performed on the SunTag and MoonTag intensity scatterplot, and the R2 value was determined for each mRNA.
Of note, this analysis method may underestimate the correlation between MoonTag and SunTag signals, especially for the Moon-SunTag reporter that was used as control. First, all MoonTag peptides are positioned upstream of the SunTag peptides in the Moon-SunTag reporter. As a result, the MoonTag signal is observed slightly earlier than the SunTag signal during increases in translation of the Moon-SunTag reporter (See Figure S4E, bottom left graph). The correlation between the MoonTag and SunTag fluorescence is thus slightly lower than expected. This temporal shift only occurs during increases in translation on the Moon-SunTag reporter, not during decreases in translation, as the MoonTag and SunTag signals disappear simultaneously during translation termination. Therefore, this temporal shift cannot be corrected by shifting the entire SunTag intensity trace in time. This temporal shift does not occur during translation of the MashTag reporter, as the MoonTag and SunTag peptides are interspersed in the MashTag.
A second reason why the correlation between SunTag and MoonTag signals may be underestimated in the linear regression approach is that a strong correlation only occurs if there are substantial changes in the intensities over time and if the intensities are strong. If both signals remain largely constant over time or are low, the regression analysis mainly compares technical noise in the SunTag and MoonTag intensity traces. So, even though both MoonTag and SunTag fluorescence behave similar over time, a very poor correlation is observed (See Figure S4E, bottom right graph). To somewhat mitigate this issue, only mRNAs with at least two-fold changes in the MoonTag signal and at least 0.25 ribosome/min were included in the linear regression analysis. However, this did not completely eliminate the problem, as even mRNAs with > 2-fold changes in the fluorescence over time showed a reduction in the R2 value due to periods in the time trace that had a constant rate of translation in both frames (See Figure S4E).
Thus, the linear regression analysis of the MoonTag and SunTag provides a conservative estimate of the temporal correlation between the two signals.
Sliding window p-value analysis
To test whether changes in the usage of translation initiation sites occurred during the life-time of an mRNA, a statistical test was designed, referred to as a sliding window approach (See Figure S4H). First, ribosomes were fit to raw intensity traces, and the time of each translation initiation event was determined, as described in the section ‘Fitting intensity traces using RiboFitter’. Second, initiation events in both MoonTag and SunTag frames were merged onto a single time-line. Third, a ‘window’ of 10 consecutive initiation events was defined as the first 10 initiation events of the trace. Additional windows were defined by sliding the window along all initiation events, moving the window one initiation event per iteration. Note that mRNA traces with 10 or less initiation events were excluded from analysis, as we could not generate multiple windows on these mRNAs. In this way, a collection of windows was created along the trace of an mRNA, in which each window represented 10 consecutive initiating ribosomes. For each window, the number of SunTag initiation events was determined. Fourth, the relative SunTag initiation frequency in each window was compared to the SunTag initiation frequency of the entire mRNA to test whether the window contained an increase or decrease in the number of SunTag initiation events as compared to the total trace. To provide a significance value for each window, a binomial test was performed. For each window of an mRNA and the lowest p-value per mRNA was reported.
Data and Software Availability
TransTrack (MATLAB) and RiboFitter (R) and documentation are made available through Github. Raw imaging data is available through Mendeley data: https://doi.org/10.17632/p5bgwz8bx2.1.
Acknowledgments
We would like to thank the members of the Tanenbaum lab for helpful discussions. We would also like to thank Merlijn Staps for initial work on the computational pipeline, Ive Logister for help with the northern blot, and Tim Hoek for critical reading of the manuscript. This work was financially supported by an ERC starting grant (ERC-STG 677936-RNAREG), grants from the Netherlands Organization for Scientific Research (NWO) (ALWOP.290 and NWO/016.VIDI.189.005), and by the Howard Hughes Medical Institute through an international research scholar grant to M.E.T. (HHMI/IRS 55008747) and the Janelia Research Campus (to J.B.G. and L.D.L.). M.E.T. was also financially supported by the Oncode Institute.
Author Contributions
S.B., D.K., and M.E.T. conceived the project. J.B.G. and L.D.L. provided reagents. B.M.P.V. and S.S. developed and optimized the software. S.B. and D.K. performed all experiments. S.B., D.K., B.M.P.V., and M.E.T. analyzed the data. S.B. and D.K. prepared the figures, and M.E.T. wrote the manuscript with input from S.B. and D.K.
Declaration of Interests
The authors declare no competing interests.
Published: June 6, 2019
Footnotes
Supplemental Information can be found online at https://doi.org/10.1016/j.cell.2019.05.001.
Supplemental Information
Overview of the number of repeats per experiment, and of the number of cells and mRNAs analyzed per experiment. Some datasets are used for multiple analyses, or sometimes the identical analysis is shown again for comparison with a new analysis. In both cases, this is indicated with a colored cell in the column ‘(re)plotting’. Figure panels based on the same mRNAs are indicated with the same color. Replotting of the same analysis is indicated in the figure legends.
References
- Aitken C.E., Lorsch J.R. A mechanistic overview of translation initiation in eukaryotes. Nat. Struct. Mol. Biol. 2012;19:568–576. doi: 10.1038/nsmb.2303. [DOI] [PubMed] [Google Scholar]
- Atkins J.F., Loughran G., Bhatt P.R., Firth A.E., Baranov P.V. Ribosomal frameshifting and transcriptional slippage: From genetic steganography and cryptography to adventitious use. Nucleic Acids Res. 2016;44:7007–7078. doi: 10.1093/nar/gkw530. [DOI] [PMC free article] [PubMed] [Google Scholar]
- Barbosa C., Peixeiro I., Romão L. Gene expression regulation by upstream open reading frames and human disease. PLoS Genet. 2013;9:e1003529. doi: 10.1371/journal.pgen.1003529. [DOI] [PMC free article] [PubMed] [Google Scholar]
- Calvo S.E., Pagliarini D.J., Mootha V.K. Upstream open reading frames cause widespread reduction of protein expression and are polymorphic among humans. Proc. Natl. Acad. Sci. USA. 2009;106:7507–7512. doi: 10.1073/pnas.0810916106. [DOI] [PMC free article] [PubMed] [Google Scholar]
- Chao J.A., Patskovsky Y., Almo S.C., Singer R.H. Structural basis for the coevolution of a viral RNA-protein complex. Nat. Struct. Mol. Biol. 2008;15:103–105. doi: 10.1038/nsmb1327. [DOI] [PMC free article] [PubMed] [Google Scholar]
- Dinman J.D. Mechanisms and implications of programmed translational frameshifting. Wiley Interdiscip. Rev. RNA. 2012;3:661–673. doi: 10.1002/wrna.1126. [DOI] [PMC free article] [PubMed] [Google Scholar]
- Dunkle J.A., Dunham C.M. Mechanisms of mRNA frame maintenance and its subversion during translation of the genetic code. Biochimie. 2015;114:90–96. doi: 10.1016/j.biochi.2015.02.007. [DOI] [PMC free article] [PubMed] [Google Scholar]
- Dunn J.G., Foo C.K., Belletier N.G., Gavis E.R., Weissman J.S. Ribosome profiling reveals pervasive and regulated stop codon readthrough in Drosophila melanogaster. eLife. 2013;2:e01179. doi: 10.7554/eLife.01179. [DOI] [PMC free article] [PubMed] [Google Scholar]
- Edelstein A., Amodaj N., Hoover K., Vale R., Stuurman N. Computer control of microscopes using μManager. Curr. Protoc. Mol. Biol. 2010;Chapter 14,:Unit 14.20. doi: 10.1002/0471142727.mb1420s92. [DOI] [PMC free article] [PubMed] [Google Scholar]
- Ferreira J.P., Overton K.W., Wang C.L. Tuning gene expression with synthetic upstream open reading frames. Proc. Natl. Acad. Sci. U.S.A. 2013;110:11284–11289. doi: 10.1073/pnas.1305590110. [DOI] [PMC free article] [PubMed] [Google Scholar]
- Forrest A.R.R., Kawaji H., Rehli M., Baillie J.K., de Hoon M.J.L., Haberle V., Lassmann T., Kulakovskiy I.V., Lizio M., Itoh M., FANTOM Consortium and the RIKEN PMI and CLST (DGT) A promoter-level mammalian expression atlas. Nature. 2014;507:462–470. doi: 10.1038/nature13182. [DOI] [PMC free article] [PubMed] [Google Scholar]
- Gao F.B., Richter J.D., Cleveland D.W. Rethinking Unconventional Translation in Neurodegeneration. Cell. 2017;171:994–1000. doi: 10.1016/j.cell.2017.10.042. [DOI] [PMC free article] [PubMed] [Google Scholar]
- Grimm J.B., English B.P., Chen J., Slaughter J.P., Zhang Z., Revyakin A., Patel R., Macklin J.J., Normanno D., Singer R.H. A general method to improve fluorophores for live-cell and single-molecule microscopy. Nat. Methods. 2015;12:244–250. doi: 10.1038/nmeth.3256. 3, 250. [DOI] [PMC free article] [PubMed] [Google Scholar]
- Guenther U.P., Weinberg D.E., Zubradt M.M., Tedeschi F.A., Stawicki B.N., Zagore L.L., Brar G.A., Licatalosi D.D., Bartel D.P., Weissman J.S., Jankowsky E. The helicase Ded1p controls use of near-cognate translation initiation codons in 5′ UTRs. Nature. 2018;559:130–134. doi: 10.1038/s41586-018-0258-0. [DOI] [PMC free article] [PubMed] [Google Scholar]
- Hinnebusch A.G., Ivanov I.P., Sonenberg N. Translational control by 5′-untranslated regions of eukaryotic mRNAs. Science. 2016;352:1413–1416. doi: 10.1126/science.aad9868. [DOI] [PMC free article] [PubMed] [Google Scholar]
- Iacono M., Mignone F., Pesole G. uAUG and uORFs in human and rodent 5'untranslated mRNAs. Gene. 2005;349:97–105. doi: 10.1016/j.gene.2004.11.041. [DOI] [PubMed] [Google Scholar]
- Ingolia N.T.T., Lareau L.F.F., Weissman J.S.S. Ribosome profiling of mouse embryonic stem cells reveals the complexity and dynamics of mammalian proteomes. Cell. 2011;147:789–802. doi: 10.1016/j.cell.2011.10.002. [DOI] [PMC free article] [PubMed] [Google Scholar]
- Iwasaki S., Floor S.N., Ingolia N.T. Rocaglates convert DEAD-box protein eIF4A into a sequence-selective translational repressor. Nature. 2016;534:558–561. doi: 10.1038/nature17978. [DOI] [PMC free article] [PubMed] [Google Scholar]
- Johnstone T.G., Bazzini A.A., Giraldez A.J. Upstream ORFs are prevalent translational repressors in vertebrates. EMBO J. 2016;35:706–723. doi: 10.15252/embj.201592759. [DOI] [PMC free article] [PubMed] [Google Scholar]
- Kozak M. Point mutations define a sequence flanking the AUG initiator codon that modulates translation by eukaryotic ribosomes. Cell. 1986;44:283–292. doi: 10.1016/0092-8674(86)90762-2. [DOI] [PubMed] [Google Scholar]
- Lee S., Liu B., Lee S., Huang S.X.X., Shen B., Qian S.B.B. Global mapping of translation initiation sites in mammalian cells at single-nucleotide resolution. Proc. Natl. Acad. Sci. USA. 2012;109:E2424–E2432. doi: 10.1073/pnas.1207846109. [DOI] [PMC free article] [PubMed] [Google Scholar]
- Lind C., Åqvist J. Principles of start codon recognition in eukaryotic translation initiation. Nucleic Acids Res. 2016;44:8425–8432. doi: 10.1093/nar/gkw534. [DOI] [PMC free article] [PubMed] [Google Scholar]
- Lutje Hulsik D., Liu Y.Y., Strokappe N.M., Battella S., El Khattabi M., McCoy L.E., Sabin C., Hinz A., Hock M., Macheboeuf P. A gp41 MPER-specific llama VHH requires a hydrophobic CDR3 for neutralization but not for antigen recognition. PLoS Pathog. 2013;9:e1003202. doi: 10.1371/journal.ppat.1003202. [DOI] [PMC free article] [PubMed] [Google Scholar]
- Lykke-Andersen S., Jensen T.H. Nonsense-mediated mRNA decay: an intricate machinery that shapes transcriptomes. Nat. Rev. Mol. Cell Biol. 2015;16:665–677. doi: 10.1038/nrm4063. [DOI] [PubMed] [Google Scholar]
- Lyon K.R., Aguilera L.U., Morisaki T., Munsky B., Stasevich T.J. Live-cell single RNA imaging reveals bursts of translational frameshifting. Mol. Cell. 2018 doi: 10.1016/j.molcel.2019.05.002. [DOI] [PMC free article] [PubMed] [Google Scholar]
- Morisaki T., Lyon K., DeLuca K.F., DeLuca J.G., English B.P., Zhang Z., Lavis L.D., Grimm J.B., Viswanathan S., Looger L.L. Real-time quantification of single RNA translation dynamics in living cells. Science. 2016;352:1425–1429. doi: 10.1126/science.aaf0899. [DOI] [PubMed] [Google Scholar]
- Noderer W.L., Flockhart R.J., Bhaduri A., Diaz de Arce A.J., Zhang J., Khavari P.A., Wang C.L. Quantitative analysis of mammalian translation initiation sites by FACS-seq. Mol. Syst. Biol. 2014;10:748. doi: 10.15252/msb.20145136. [DOI] [PMC free article] [PubMed] [Google Scholar]
- Schueren F., Thoms S. Functional Translational Readthrough: A Systems Biology Perspective. PLoS Genet. 2016;12:e1006196. doi: 10.1371/journal.pgen.1006196. [DOI] [PMC free article] [PubMed] [Google Scholar]
- Schwanhäusser B., Gossen M., Dittmar G., Selbach M. Global analysis of cellular protein translation by pulsed SILAC. Proteomics. 2009;9:205–209. doi: 10.1002/pmic.200800275. [DOI] [PubMed] [Google Scholar]
- Tanenbaum M.E., Gilbert L.A., Qi L.S., Weissman J.S., Vale R.D. A protein-tagging system for signal amplification in gene expression and fluorescence imaging. Cell. 2014;159:635–646. doi: 10.1016/j.cell.2014.09.039. [DOI] [PMC free article] [PubMed] [Google Scholar]
- Tanenbaum M.E., Stern-Ginossar N., Weissman J.S., Vale R.D. Regulation of mRNA translation during mitosis. eLife. 2015;4 doi: 10.7554/eLife.07957. [DOI] [PMC free article] [PubMed] [Google Scholar]
- Wang C., Han B., Zhou R., Zhuang X. Real-Time Imaging of Translation on Single mRNA Transcripts in Live Cells. Cell. 2016;165:990–1001. doi: 10.1016/j.cell.2016.04.040. [DOI] [PMC free article] [PubMed] [Google Scholar]
- Wang X., Hou J., Quedenau C., Chen W. Pervasive isoform-specific translational regulation via alternative transcription start sites in mammals. Mol. Syst. Biol. 2016;12:875. doi: 10.15252/msb.20166941. [DOI] [PMC free article] [PubMed] [Google Scholar]
- Wu B., Eliscovich C., Yoon Y.J., Singer R.H. Translation dynamics of single mRNAs in live cells and neurons. Science. 2016;352:1430–1435. doi: 10.1126/science.aaf1084. [DOI] [PMC free article] [PubMed] [Google Scholar]
- Yan X., Hoek T.A., Vale R.D., Tanenbaum M.E. Dynamics of Translation of Single mRNA Molecules In Vivo. Cell. 2016;165:976–989. doi: 10.1016/j.cell.2016.04.034. [DOI] [PMC free article] [PubMed] [Google Scholar]
- Zhao N., Kamijo K., Fox P., Oda H., Morisaki T., Sato Y., Kimura H., Stasevich T.J. A genetically encoded probe for imaging HA-tagged protein translation, localization, and dynamics in living cells and animals. bioRxiv. 2018 [Google Scholar]
- Zhou J., Wan J., Shu X.E., Mao Y., Liu X.M., Yuan X., Zhang X., Hess M.E., Brüning J.C., Qian S.B. N6-Methyladenosine Guides mRNA Alternative Translation during Integrated Stress Response. Mol. Cell. 2018;69:636–647.e7. doi: 10.1016/j.molcel.2018.01.019. [DOI] [PMC free article] [PubMed] [Google Scholar]
Associated Data
This section collects any data citations, data availability statements, or supplementary materials included in this article.
Supplementary Materials
A U2OS cell stably expressing MoonTag-Nb-GFP (green), PCP-2xmCherry-CAAX (red) was transfected with the MoonTag translation reporter (indicated in Figure 1E). Images were acquired every 30 s (movie duration is 50 min) on a spinning disk confocal microscope focusing near the bottom plasma membrane of the cell. Individual mRNAs can be tracked for the duration of the movie undergoing many rounds of translation. Movie field of view is 7.47 × 7.47 μm.
A Moon/Sun cell expressing both the MoonTag and SunTag reporters (indicated in Figure 2G). Images were acquired every 30 s (movie duration is 8 min and 30 s) on a spinning disk confocal microscope focusing near the bottom plasma membrane of the cell. Translating MoonTag mRNAs (blue signal) and SunTag mRNAs (green signal) can be observed. Movie field of view is 5.47 × 5.47 μm.
A Moon/Sun cell expressing the 3′UTR translation reporter (indicated in Figure 1H). Images were acquired every 30 s (movie duration is 6.5 min) on a spinning disk confocal microscope focusing near the bottom plasma membrane of the cell. One of the many MoonTag translating mRNAs (blue) shows SunTag signal (green). Movie field of view is 4.6 × 4.6 μm.
A Moon/Sun cell expressing the MashTag reporter (indicated in Figure 2B). Images were acquired every 30 s (movie duration is 9 min) on a spinning disk confocal microscope focusing near the bottom plasma membrane of the cell. One of the two MoonTag translating mRNAs (blue, lower mRNA) also shows SunTag signal (green), indicating OOF translation. Movie field of view is 5.4 × 5.4 μm.
Overview of the number of repeats per experiment, and of the number of cells and mRNAs analyzed per experiment. Some datasets are used for multiple analyses, or sometimes the identical analysis is shown again for comparison with a new analysis. In both cases, this is indicated with a colored cell in the column ‘(re)plotting’. Figure panels based on the same mRNAs are indicated with the same color. Replotting of the same analysis is indicated in the figure legends.
Data Availability Statement
TransTrack (MATLAB) and RiboFitter (R) and documentation are made available through Github. Raw imaging data is available through Mendeley data: https://doi.org/10.17632/p5bgwz8bx2.1.