Abstract
Continuous blood pressure (BP) monitoring is essential for diagnosis and management of cardiovascular disorders. Currently, BP is measured using cuff-based methods, which are obtrusive and not suitable for continuous monitoring. Estimation of BP using pulse transit time (PTT) is a prominent method that eliminates the need for a cuff. In this paper, we present a new method to estimate BP based on PTT measurements from an array of 2×2 bio-impedance sensors placed on the wrist, which can be integrated into a small wearable device such as a smart watch for continuous BP monitoring. Diastolic and systolic BP were estimated using AdaBoost regression model based on PTT features extracted from the wrist bio-impedance signals. Data was collected from three participants using our custom bio-impedance sensors. Our method can estimate BP accurately with correlation coefficient, mean absolute error (MAE) and standard deviation (STD) of 0.92, 1.71 and 2.46 mmHg for the diastolic BP and 0.94, 2.57 and 4.35 mmHg for the systolic BP.
Keywords: Continuous Blood pressure monitoring, cuffless, regression model, wrist bio-impedance sensors
I. INTRODUCTION
Blood pressure (BP) monitoring is important for diagnosis, monitoring, and management of cardiovascular disorders. There are about 30 million people who suffer from cardiovascular diseases in the United States, and this yielded in an estimated $555 billion in health care costs and lost productivity in 2016. By 2035, the cost will skyrocket to $1.1 trillion according to the predictions of the American Heart Association [1]. BP is an essential marker for the diagnosis of cardiovascular diseases. Currently, the most common method for BP monitoring uses sphygmomanometer with its inflatable cuff, which is bulky, obtrusive and allows only one-off measurements. Many studies have now confirmed that BP continuously measured over a 24-hour period during daily activities including sleep is superior to traditional office-based BP measurement in predicting future cardiovascular events [2]. Continuous, convenient and easy to use without requiring the user intervention. BP estimation through the measurement of the pulse transit time (PTT) is a prominent method for continuous BP monitoring without using a cuff [3]. This method relies on modeling the correlation between BP and PTT. PTT is the time taken by pressure pulse to travel through the arteries between two fixed points during each cardiac cycle. In this paper, we estimate BP using PTT method through an array of sensors placed on the wrist as shown in Fig.1, which can be integrated into a werable device such as smart watch and can provide a suitable solution for continuous BP monitoring.
Fig. 1.
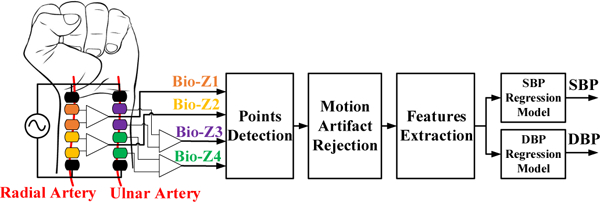
The block diagram of the BP estimation algorithms from wrist-worn bio-impedance sensors array.
Through prior investigations, PTT was measured by the time delay between the R-peak of the ECG signal and a characteristic point on the photoplethysmography (PPG) or bio-impedance (Bio-Z) from the finger or the wrist [4–6]. These PTT measurements methods rely on ECG, which has two main issues. First, ECG is measured from the potential between two electrodes across the two sides of the heart, which cannot be realized in a small form factor device and is not conveniently wearable. Second, the time delay measured through ECG includes the pre-ejection period (PEP), which is the time from the onset of the R-peak to the start of the actual pumping of blood out of the heart. The PEP is not correlated to BP, which results in errors in BP estimation. In another prior investigation, the BP was measured from a wrist device using PTT, but to get a measurement, the user has to press a finger on an electrode on the device to be able to measure ECG [7]. BP was also measured from a watch based on seismocardiogram (SCG) and PPG sensors only when the user holds his arm with the watch towards his chest for a certain time [8]. In a more recent investigation, BP was measured using a smartphone via oscillometric finger-pressing method, which requires the user to press his finger towards a PPG sensor with gradual pressure increase [9]. These methods, although all of them provide interesting and important insights into BP monitoring, are not suitable for continuous BP monitoring because they require the intervention of the user or cannot be incorporated into a smart watch form factor for a true wearable experience, which prevents BP monitoring during daily activities.
Our proposed method for continuous BP monitoring during the daily activities is based on measuring PTT from an array of 2×2 bio-impedance sensors placed on the wrist, which can be integrated into a wearable device such as a smart watch. This method eliminates the need for ECG and the intervention from the user for more accurate and comfortable continuous BP monitoring. A pair of sensors is placed on each artery of the wrist, which are the radial, and the ulnar arteries to consider the different vascular properties of both arteries, which improves the accuracy of BP estimation. The measurement accuracy can be additionally enhanced by extending this concept through using a larger array of sensors based on a wrist strap with an array of dry electrodes as shown in [10]. Bio-impedance sensing is suitable because of its low power requirements, low cost and that it can be easily integrated into a small device. More importantly, the sensing coverage through the tissue for bio-impedance can be adapted from a few millimeters to centimeters, unlike optical modalities.
The contributions of this paper are summarized as follows:
We measure BP from an array of 2×2 bio-impedance sensors using wet electrodes placed on the wrist.
We present circuits and hardware for high-resolution bio-impedance measurements that lead to an accurate characterization of PTT.
We offer estimation algorithms for systolic BP (SBP) and diastolic BP (DBP) using AdaBoost regression model based on 90 features extracted from PTT, time duration and amplitude of the Bio-Z signals. The experimental results are shown for 80 minutes of BP & Bio-Z data, which were collected from three subjects.
We demonstrate the improvements in BP estimation accuracy using our array of four Bio-Z sensors compared to using one or two sensors.
II. METHODS
A. Bio-impedance Sensing Hardware
Bio-impedance is an electrical non-invasive signal measured by injecting AC current in the human body and sensing voltage using separate pairs of electrodes. The changes in bio-impedance over time (∆Z) corresponds to the blood volume changes at the sensing location, which is used to measure the arrival time of the pressure pulse. Our bio-impedance sensing hardware depends on the ARM Cortex M4 MCU, which sends a digital waveform to a 16-bit DAC to drive the voltage-to-current converter for generating an AC current signal with programmable frequency and amplitude as shown in Fig 2. The impedance sensing path depends on a low noise instrumentation amplifier (IA) followed by low pass filter to obtain RMS error less than 1mΩ, which is much lower than the target Bio-Z variations. The current injection circuit is shared between the four bio-impedance sensors, while there is separate sensing circuit for each sensor. The ADC samples the four Bio-Z channels simultaneously at 78.125 kSPS with 24-bit resolution to enable accurate measurement of PTT with a time error less than 12.8 μs, which is much smaller than the target average PTT. In addition, ECG and PPG signals are also measured to verify the PTT measurements. All the six channels of the ADC were sent to the MCU, then transferred to the PC through USB for post-processing. Then, the Bio-Z signals were demodulated in the digital domain by multiplying it by the carrier signal generated from the MCU followed by a low-pass filter with a cut-off frequency of 4.4 Hz.
Fig. 2.
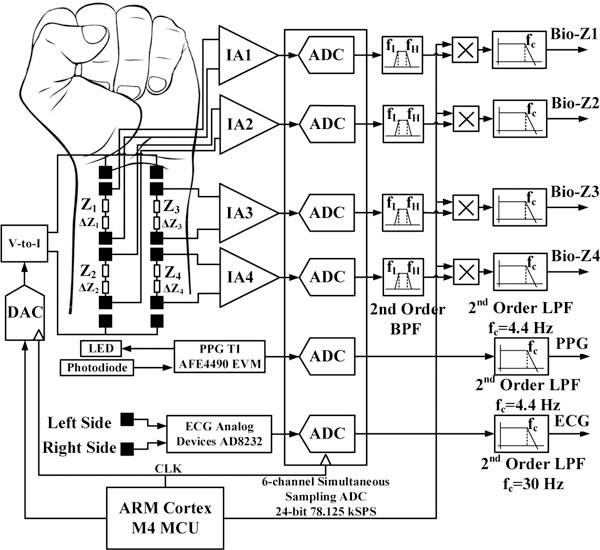
The block diagram of the wrist bio-impedance sensing hardware.
B. Blood Pressure Estimation Algorithms
The BP estimation algorithms start by detecting some characteristic points on each Bio-Z signal followed by motion artifact rejection, feature extraction, and the regression models.
1). Points Detection
For each Bio-Z signal, six characteristic points are detected for every beat. Every heart beat, the Bio-Z signal decreases from its peak to the foot, which indicates a sudden increase in the blood volume due to the arrival of the pressure pulse. The Bio-Z peak represents the diastolic phase while the foot represents the systolic phase of the heart beat. Therefore, this decreasing slope section is abstracted by five points as shown in Fig. 3. The peak (PK) and the foot (FT) are detected by the intersection of the tangent to the slope with the horizontal line from the maximum and the minimum of the signal, respectively [11]. In addition, the points of maximum change in the slope at the peak (PK2) and the foot (FT2) of the signal are detected. The maximum slope (MS) point is also an important point in the middle of the decreasing slope section. The sixth point is detected from the inflection point (IP), which results from the reflection of the pressure pulse. All these points are identified using the zero crossing, peak and foot points of the first and the second derivative of the Bio-Z signal.
Fig. 3.

The Bio-Z signal annotated with the points, time intervals and amplitudes used for feature extraction.
2). Motion Artifact Rejection
Measuring four Bio-Z signals over a small area on the wrist provides information redundancy that helps in the detection of motion artifact induced signals. The Bio-Z characteristics points of the four sensors detected in each heart beat should have small variance in values when motion artifacts are not present because the sensors are close to each other. We can identify and reject motion artifact induced points by detecting the increase in the variances through generalized extreme studentized deviate (GESD) algorithms [12].
3). Features Extraction
The four Bio-Z signals are used to generate 90 features for each heart beat that can accurately model the PTT on the two arteries of the wrist. In addition, the mean features are also generated by taking the average of the beat-by-beat features over every 12 beats with 50% overlap. The mean features provide better results because it removes the high-frequency variations within around 10 seconds while the BP can be assumed constant. The proposed features are as follow:
PTT features: The PTT features are the time delay between each pair of Bio-Z signals measured at the points PK, PK2, MS, FT2, and FT. (30 features)
HR features: The HR features are the time interval between two successive beats for each Bio-Z signal measured at the points PK, PK2, MS, FT2, and FT. (20 features)
Time features: These features are the time interval from the PK to the MS, FT and IP points, which are T1, T2, and T3 respectively as shown in Fig. 3. (12 features)
Amplitude features: These are the difference in amplitude from PK to MS points (A1) and from PK to FT points (A2) in addition to the ratio of the amplitude of the MS point (A1) to the amplitude of the IP point (A3). (12 features)
Area ratio features: These features are the areas under the Bio-Z curve between the PK, MS, FT and IP points which represent the total peripheral resistance [13] (16 features)
4). Regression Model
We selected AdaBoost model consisting of 100 decision trees because it has better BP accuracy compared to other models such as linear, decision tree, support vector, random forest, and gradient boosting. Separate models were trained for SBP and DBP using reference BP data with 10-fold cross-validation of shuffled samples to divide the data into training and testing datasets. We adjusted the model parameters for each participant based on their data to capture the individual variations in the vascular properties of the wrist arteries.
III. EXPERIMENTAL RESULTS
Covidien gel ECG patches were used for the Bio-Z and ECG electrodes. Two pairs of the Bio-Z sensors were placed along the radial and the ulnar arteries within 8 cm distance along the wrist of the left arm as shown in Fig. 4. The location of the wrist arteries was detected using the Huntleigh Dopplex MD2 Bi-Directional Doppler. Based on experimental testing of the Bio-Z signal at different frequencies from 2 to 9.75 kHz, the highest frequency of 9.75 kHz was the best frequency to detect the variations of Bio-Z due to blood flow. The current amplitude was adjusted to 800μA for compliance with safety standards [14]. The ECG electrodes were placed on the chest and the PPG finger clip on the index finger. Continuous BP was acquired from the reference device Finapres NOVA system, which is well cited in several previous research papers as a clinical grade tool for BP measurement [15]. Continuous BP was measured from a finger cuff placed on the middle finger, which was calibrated by the standard brachial cuff. Another PPG signal was measured from the Finapres device using a second finger clip placed on the ring finger to enable synchronization with the Bio-Z signals.
Fig. 4.
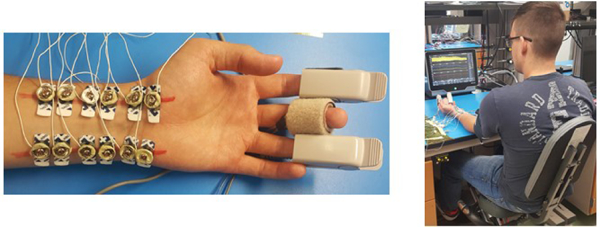
Pictures showing the placement of electrodes and sensors on the wrist and fingers (left) and the experimental setup for BP monitoring (right).
The data was collected from three human subjects under IRB approved by Texas A&M University (IRB2017–0086D) on seven trials from each participant while seated on a bike and their arm was extended on the bench. Each trial started by exercising for 5 minutes through cycling on the bike to raise the BP followed by 4 minutes of data collection to capture the recovery of BP to its normal value. Fig. 5 shows an example of the physiological signals as measured by our circuits and Finapress after filtering. Fig. 6 shows the beat-by-beat SBP and DBP during the recovering phase after the exercise while the pulse arrival time (PAT) of the Bio-Z and the PPG signals relative to ECG increases as expected. The figure displays the raw PTT features extracted from the mean of MS points. The AdaBoost regression model provided Pearson’s correlation coefficient (R), mean absolute error (MAE) and the standard deviation (STD) of 0.92, 1.71 and 2.46 mmHg for the DBP and 0.94, 2.57 and 4.35 mmHg for the SBP, respectively, using the mean features as illustrated in Fig. 7 and TABLE I. The mean features showed significant improvement compared to the beat features. In the comparison with other prior investigations using PTT from ECG and PPG signals, our method offers better performance in all metrics compared to [4] and higher correlation compared to [5].
Fig. 5.
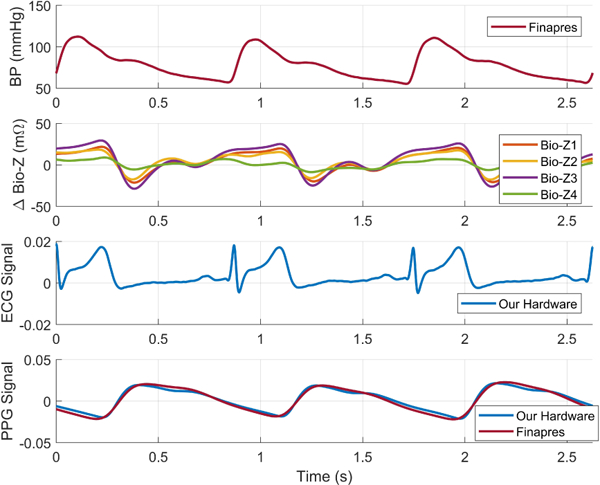
BP, Bio-Z, ECG and PPG signals as measured by our hardware and the Finapres device after synchronization.
Fig. 6.
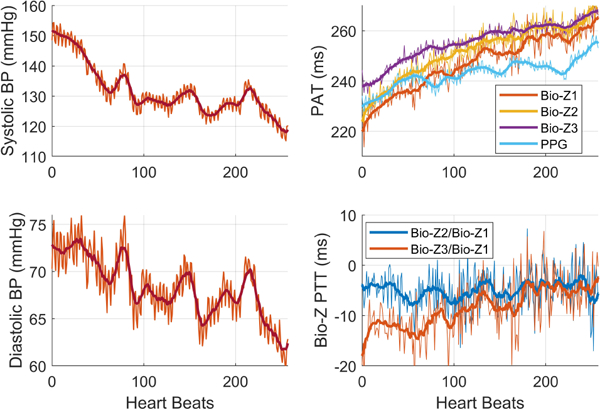
The beat-by-beat and mean BP and Bio-Z features after exercise.
Fig. 7.
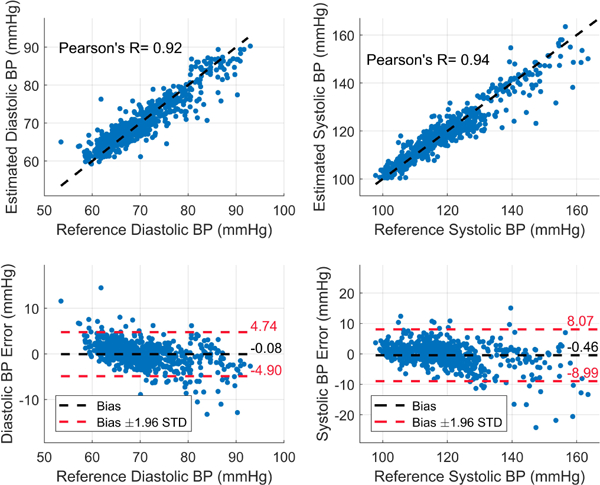
The estimated DBP and SBP for all the subjects using AdaBoost regression model and mean features.
TABLE I.
DBP and SBP estimation performance compared with other work.
TABLE II shows the comparison between BP error obtained from our 4 sensors with the average of all combinations of one or two sensors. There is a consistent decrease in the error for both DBP and SBP as the number of sensors increases. These results show that DBP and SBP can be accurately estimated using an array of Bio-Z sensors placed only on the wrist, which helps in achieving wearable and continuous BP monitoring.
TABLE II.
The comparison of the BP error for a different number of sensors.
| Number of Bio-Z Sensors |
DBP | SBP | ||
|---|---|---|---|---|
| MAE (mmHg) |
STD (mmHg) |
MAE (mmHg) |
STD (mmHg) |
|
| 4 | 1.71 | 2.46 | 2.57 | 4.35 |
| 2 | 1.96 | 2.80 | 2.88 | 4.73 |
| 1 | 2.19 | 3.12 | 3.33 | 5.61 |
IV. CONCLUSION
In this paper, we provided a system and a method that can measure DBP and SBP using an AdaBoost regression model based on PTT features extracted from an array of Bio-Z sensors. The experimental results showed high correlation coefficient and low error of 2–4 mmHg. Leveraging an array of sensors provided a smaller error compared to using one or two sensors only. Using the proposed method, we can continuously and accurately measure BP in a comfortable form factor such as smart watches, ultimately leading to more effective monitoring and management of cardiovascular disorders.
ACKNOWLEDGMENT
The authors would like to acknowledge Dariusz Mrugala for his help in the software development and data collection.
REFERENCES
- [1].“Cardiovascular Disease: A Costly Burden for America, projections through 2035,” American Heart Association, 2017. [Google Scholar]
- [2].Wexler R, “Ambulatory blood pressure monitoring in primary care,” Southern medical journal, vol. 103, pp. 447–452, 2010. [DOI] [PubMed] [Google Scholar]
- [3].Poon C and Zhang Y, “Cuff-less and noninvasive measurements of arterial blood pressure by pulse transit time,” in Engineering in Medicine and Biology Society, 2005. IEEE-EMBS 2005. 27th Annual International Conference of the, 2006, pp. 5877–5880. [DOI] [PubMed] [Google Scholar]
- [4].Kachuee M, Kiani MM, Mohammadzade H, and Shabany M, “Cuffless Blood Pressure Estimation Algorithms for Continuous Health-Care Monitoring,” IEEE Trans Biomed Eng, vol. 64, pp. 859–869, April 2017. [DOI] [PubMed] [Google Scholar]
- [5].Miao F, Fu N, Zhang YT, Ding XR, Hong X, He Q, et al. , “A Novel Continuous Blood Pressure Estimation Approach Based on Data Mining Techniques,” IEEE J Biomed Health Inform, April 28 2017. [DOI] [PubMed] [Google Scholar]
- [6].Bang S, Lee C, Park J, Cho M.-c, Yoon Y-G, and Cho S, “A pulse transit time measurement method based on electrocardiography and bioimpedance,” 2009 IEEE Biomedical Circuits and Systems Conference, pp. 153–156, 2009. [Google Scholar]
- [7].Thomas SS, Nathan V, Zong C, Soundarapandian K, Shi X, and Jafari R, “BioWatch: A Noninvasive Wrist-Based Blood Pressure Monitor That Incorporates Training Techniques for Posture and Subject Variability,” IEEE Journal of Biomedical and Health Informatics, vol. 20, pp. 1291–1300, 2016. [DOI] [PubMed] [Google Scholar]
- [8].Andrew JC Carek M, Joshi Anirudh, Kang Hyolim, Inan Omer T., “SeismoWatch: Wearable Cuffless Blood Pressure Monitoring Using Pulse Transit Time,” Proceedings of the ACM on Interactive, Mobile, Wearable and Ubiquitous Technologies, 2017. [DOI] [PMC free article] [PubMed] [Google Scholar]
- [9].Chandrasekhar A, Kim C-S, Naji M, Natarajan K, Hahn J-O, and Mukkamala R, “Smartphone-based blood pressure monitoring via the oscillometric finger-pressing method,” Science translational medicine, vol. 10, p. eaap8674, 2018. [DOI] [PMC free article] [PubMed] [Google Scholar]
- [10].Ibrahim B, McMurray J, and Jafari R, “A Wrist-Worn Strap with an Array of Electrodes for Robust Physiological Sensing,” 40th Annual International Conference of the IEEE Engineering in Medicine and Biology Society (EMBC), 2018. [Accepted]. [DOI] [PMC free article] [PubMed] [Google Scholar]
- [11].Kazanavicius E, Gircys R, Vrubliauskas A, and Lugin S, “Mathematical methods for determining the foot point of the arterial pulse wave and evaluation of proposed methods,” Information Technology and control, vol. 34, 2005. [Google Scholar]
- [12].Rosner B, “Percentage points for a generalized ESD many-outlier procedure,” Technometrics, vol. 25, pp. 165–172, 1983. [Google Scholar]
- [13].Elengdi M, “On the analysis of fingertip photo plethysmogram signal,” Current cardiology reviews, pp. 14–25, 2012.22845812 [Google Scholar]
- [14].“ANSIAAMIES60601–12005.”
- [15].Imholz BP, Wieling W, van Montfrans GA, and Wesseling KH, “Fifteen years experience with finger arterial pressure monitoring: assessment of the technology,” Cardiovascular research, vol. 38, pp. 605–616, 1998. [DOI] [PubMed] [Google Scholar]


