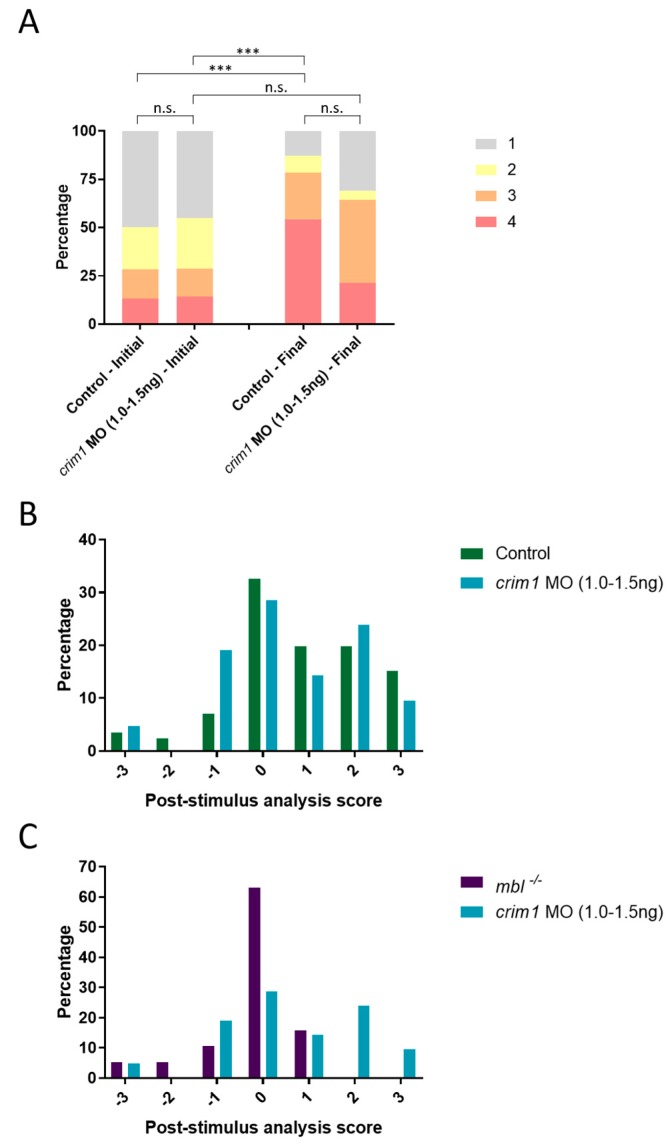
Figure 6.
crim1 morphants respond to OMR. (A) OMR analysis of control (n = 39) and crim1 AUG MO at 1.0–1.5 ng (n = 31) larvae plotted as a bar graph which shows the shifts in the population between the initial and final positions (Bowker’s test of symmetry, p-value *** = 0.0004); (B) Individual analysis compared to wild type; (C) individual analysis compared to mbl−/−. Control and crim1 morphant larvae respond to the OMR. n.s., not significant.

