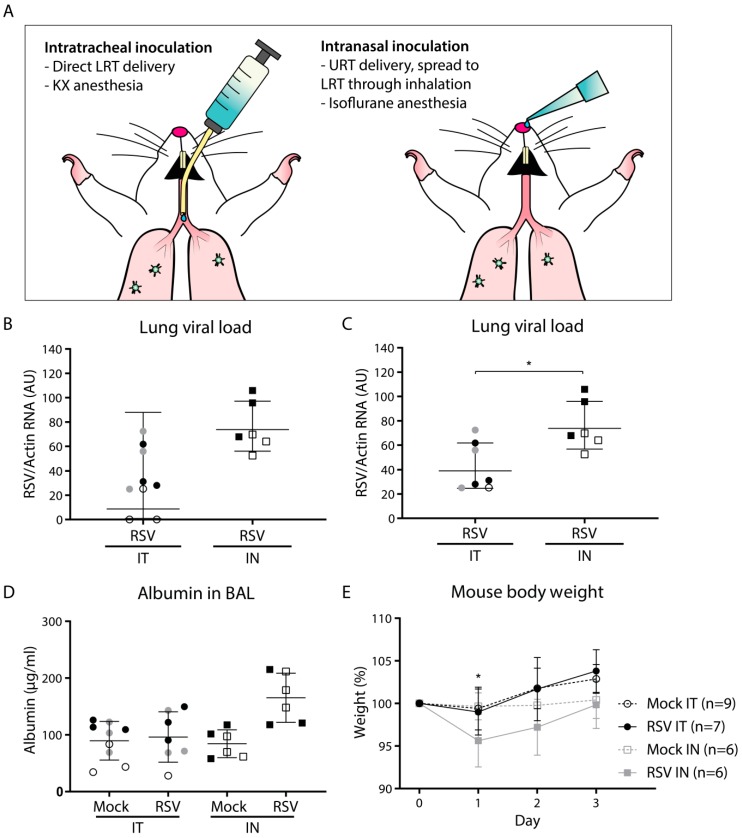
Figure 1.
Viral load and pathology following intratracheal or intranasal respiratory syncytial virus (RSV) infection. Mice were (mock) inoculated either intratracheally or intranasally with 2 × 10⁶ pfu of live RSV-A2 or vehicle control. (A) Schematic figure of the intratracheal and intranasal inoculation methods. (B,C) Viral load in mouse lung cells as determined by RT-qPCR. Two animals that tested negative for RSV after intratracheal inoculation (depicted in panel B) were excluded from further analysis and removed from panel C. Geometric mean and SD are depicted. Viral load was log transformed before statistical comparison between the two groups was performed using an unpaired Student’s t-test (* p < 0.05). (D) Albumin concentration in the bronchoalveolar lavage (BAL) fluid measured by ELISA. Albumin concentrations were log transformed before analysis by a one-way ANOVA, followed by Tukey’s multiple comparisons test. Geometric mean and SD are depicted. (E) Mouse body weight with the weight at day 0 set to 100%. Each data point represents the mean weight (+/- SD) of all mice from the indicated group: mock intratracheal (IT) (n = 9), RSV IT (n = 7), mock intranasal (IN) (n = 6), RSV IN (n = 6). Body weights of mock- and RSV-infected animals were compared using a two-way ANOVA, followed by Sidak’s multiple comparisons test. Only the IN inoculation groups showed a difference between mock- and RSV-inoculated animals (* p < 0.05). Mice from separate experiments are indicated with a distinct symbol (IT: white/gray/black circles; IN: white/black squares). Abbreviations: AU, arbitrary units; BAL, bronchoalveolar lavage; IN, intranasal; IT, intratracheal; KX, ketamine-xylazine; LRT, lower respiratory tract; RSV, respiratory syncytial virus; SD, standard deviation; URT, upper respiratory tract.

