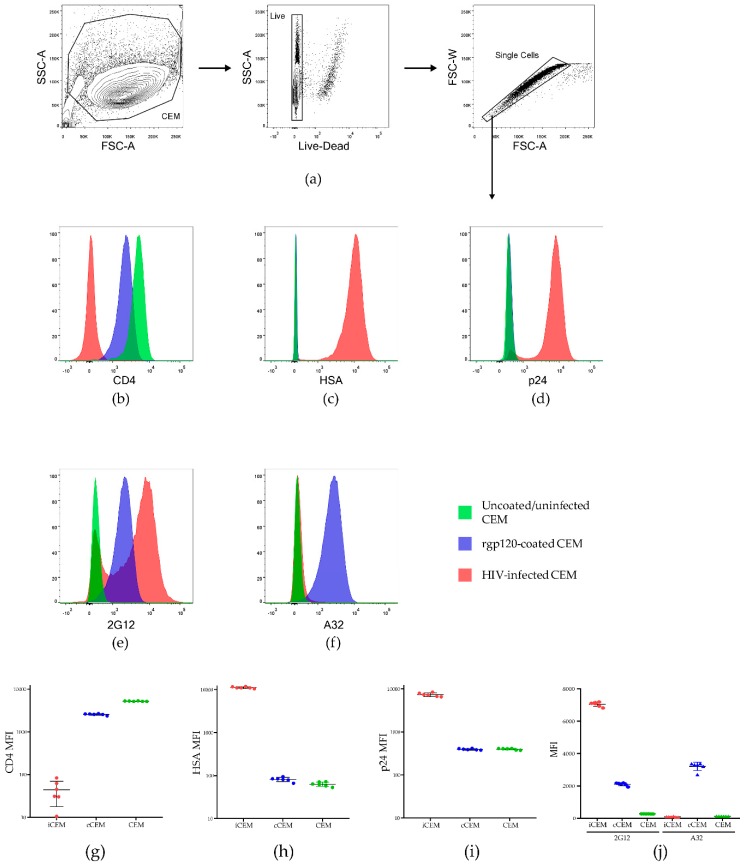
Figure 1.
Characterization of HIV infected CEM (iCEM) cells. ICEM and CFSE+ CEM cells were stained with a panel of monoclonal antibodies to cell surface CD4, HSA, intracellular p24, and cell surface 2G12 and A32. Live singlet cells were gated on (a). Histograms show expression of (b) CD4, (c) HSA, (d) intracellular p24, (e) the HIV Envelope epitope detected by 2G12 and (f) the CD4 induced epitope detected by A32 on CEM cells (in green) cCEM cells (in blue) and iCEM (in pink). The MFI of CD4+ (g), HSA+ (h) and p24+ (i) CEM, cCEM, and iCEM cells. The mean fluorescence intensity of 2G12 and A32 staining to CEM, cCEM, and iCEM cells (j). FSC-A = forward scatter-area; SSC-A = side scatter-area; FSC-W forward scatter width; HSA = heat stable antigen, also known as murine CD24; MFI = mean fluorescence intensity.

