

Summary
Objective:
Transient hyperammonemia (THA) was reported to follow generalized convulsions without sufficient evidence to confirm the epileptic nature of those events. We aimed to determine if postictal THA can differentiate between different types of events as confirmed electroencephalographically using video–electroencephalography (vEEG) monitoring.
Methods:
In our prospective cohort, we screened all consented adults (>18 years) admitted to the epilepsy monitoring unit. Ammonia was checked at baseline, within 60 min of the event (for all patients) and 24 h after event (whenever possible). Patients were grouped into generalized convulsive seizures (GCS), psychogenic nonepileptic seizures with convulsions (PNES-C), or focal seizures (FS) based on vEEG. Data were analyzed using descriptive statistics and parametric/nonparametric methods.
Results:
Of 78 patients enrolled, 13 had GCS, 8 had FS, and 9 had PNES-C. The groups were different with regard to gender (p = 0.04) and baseline ammonia (p = 0.02), but not age. The change in ammonia postictally from baseline was significantly different among the three groups (p = 0.004). The area under the receiver operator characteristic (ROC) curve for postictal ammonia to distinguish GCS from other groups was 0.88 (95% confidence interval [CI] 0.69–0.96) suggesting ammonia to be a good test differentiating epileptic GCS from other events. An ammonia level of ≥80 imol/L correctly classified 80% of our patients (sensitivity 53.9%, specificity 100%).
Significance:
Our results provide objective evidence for the association between THA and GCS seizures utilizing vEEG monitoring, and a basis for future studies to determine the role of postictal ammonia as an inexpensive diagnostic test to diagnose GCS.
Keywords: Postictal hyperammonemia, Ammonia, Convulsive seizures, Nonepileptic convulsions, Sensitivity and specificity
Clinicians have long sought an easy, affordable, and reliable blood marker to differentiate epileptic seizures from nonepileptic events. Different markers have been studied, but each has different limitations. For example, the clinical utility of prolactin has been restricted by the narrow time frame within which it rises (10–20 min) postictally.1 Similarly, creatine kinase was suggested as a marker to differentiate generalized convulsive seizures (GCS) from psychogenic nonepileptic seizures with convulsions (PNES-C)2; however, its low sensitivity, and delayed and variable time to reach its peak serum levels (mostly days) were limiting factors for its use in acute settings.3
Recently, several studies reported transient hyperam-monemia (THA) to follow generalized convulsions,4–8 and one of the studies reported a strong association, with an odds ratio (OR) of 14.8.8 Although the exact mechanism of THA is not fully understood, excessive muscle activity during a generalized convulsion has been considered an etiology. It is unclear from those studies if other spells presenting with profound motor activity (such as PNES-C), or focal seizures (FS) with limited muscle activity, are associated with THA.
Although very promising, previous reports were limited by the lack of objective measures to correlate clinical events with electroencephalographic findings. We undertook this study to address this limitation.
In this pilot study, we aimed first to determine if THA is limited to GCS when compared to FS or PNES-C as diagnosed objectively with video-electroencephalography (vEEG) monitoring and secondarily to assess the role of postictal serum ammonia as a diagnostic test to differentiate GCS from PNES-C and FS.
Methods
Study design
The study is designed as a prospective cohort study conducted at University of Kansas Medical Center, after obtaining institutional review board approval.
Subjects
We screened adult patients (≥18 years of age) admitted to the epilepsy monitoring unit for event characterization, seizure focus localization, or treatment optimization from April 2014 to May 2015. Exclusion criteria included factors known to be associated with hyperammonemia: preexisting liver disease/cirrhosis, current use of valproic acid or 5-fluorouracil, history of gastrointestinal bleeding, hematologic malignancies, and end-stage renal disease. Patients were required to provide informed consent and be event-free for at least 24 h prior to admission. All patients who met inclusion criteria and none of the exclusion criteria were invited to participate and provided written informed consent.
Equipment
Thirty-two or more channel Natus XLTEK Long Term Monitoring System (Natus Medical Incorporated, San Carolos, CA, U.S.A.) was used for data acquisition to analyze event semiology and electroencephalographic findings. The 10–20 international electrode system placement was used with additional two anterior temporal electrodes (FT9 and FT10) placed at two thirds of the distance from the outer canthus of the eye to the preauricular point and 1 cm directly above that point.
Event characterization
All captured events of interest were reviewed separately for semiology and electroencephalographic findings by at least one of study epileptologists (NH, PL, and/or UU), who classified the events accordingly into one of the study sub-groups. For epileptic events, seizure classification followed the revised terminology proposed by the International League Against Epilepsy (ILAE) Commission on Classification and Terminology, 2005–2009,9 based on semiology and ictal EEG. We divided the patients with epilepsy into two groups. The first group was the GCS group including generalized (tonic–clonic, tonic, or clonic seizures) and focal seizures evolving to bilateral, convulsive seizures (previously known as secondarily generalized seizures). The second group was FS group including focal motor, sensory, or autonomic, with or without impairment of consciousness or awareness with ictal changes on EEG. PNES-C group was the third group; the diagnosis was based on hypermotor activity (including regular or irregular, rhythmic or arrhythmic contractions, or stiffening) with no ictal changes on EEG.10 If there was a disagreement between the study epileptologists, the final decision was made by consensus. Event time of onset and time of serum ammonia blood draw was recorded in the chart by nursing staff.
Ammonia
Baseline serum ammonia (using Beckman Coulter ammonia reagent) was drawn on admission prior to having a typical event (provided that the patient is at least 24 h event-free). Postictal ammonia was drawn within a window of 15–60 min after the event of concern was recorded as recognized by the patient, a family member, or a house staff. A third ammonia level was drawn 24 h after the spell recorded or prior to discharge, whichever came first. If there were recurrent events within that time frame, the subsequent blood draws were delayed until 24 h after the last event. The source of all blood draws was venous. Blood samples were immediately placed on ice. Personnel drawing ammonia were blinded to the electrographic characterization of the event.
Statistical analysis
We used descriptive statistics, such as frequency (percentage) for categorical variables, mean (SD, standard deviation) for normally distributed variables, and median (IQR, interquartile range) for continuous variables with outliers or skewed distributions to summarize the characteristics of subjects at baseline. For group comparison, we used chi-square test (or Fisher’s exact test if the expected cell counts are small) for categorical variables; analysis of variance (ANOVA) for comparing variables that were normally distributed; nonparametric Kruskal-Wallis test for variables that were not normally distributed for the overall comparison among three groups, and Wilcoxon rank sum test for pairwise comparisons. Because of the non-normal distributions, we used one-sample signed rank test to test baseline-postictal changes of ammonia within groups. We employed nonparametric tests because they are more robust when the variables are not normally distributed. We conducted individual pairwise comparisons only when the overall comparison of all three groups were significant at the <0.05 level. An individual pairwise comparison test was considered significant at the 0.017 (0.05/3) level to control for multiple tests using the Bonferroni correction. We used STATA 13.1 (StataCorp LP, College Station, TX, U.S.A.) to conduct the data analyses.
Results
One hundred sixty patients were screened from April 2014 to May 2015. Seventy-eight patients were eligible for enrollment, whereas 82 patients met one or more exclusion criteria (mainly recent use of valproic acid, or non–seizure-freedom for 24 h prior to admission). Of the 78 patients enrolled, 36 patients had no recorded event during their hospital stay, one patient had an event prior to drawing his baseline, one had intracranial depth (rather than surface) electrodes, and one had his second blood draw at 360 (instead of 60) min. After interpretation of the vEEG, the remaining 39 patients were categorized into two types: 21 patients with epileptic seizures (FS = 8, GCS = 13) and 18 patients with nonepileptic events (convulsive = 9, nonconvulsive = 9). We excluded nine patients with nonconvulsive nonepileptic events from the final analysis (Fig. 1). The final data for analysis included 30 patients in three groups (FS = 8, GCS = 13, PNES-C = 9). Description of spell characteristics and duration were detailed in Table S1.
Figure 1.
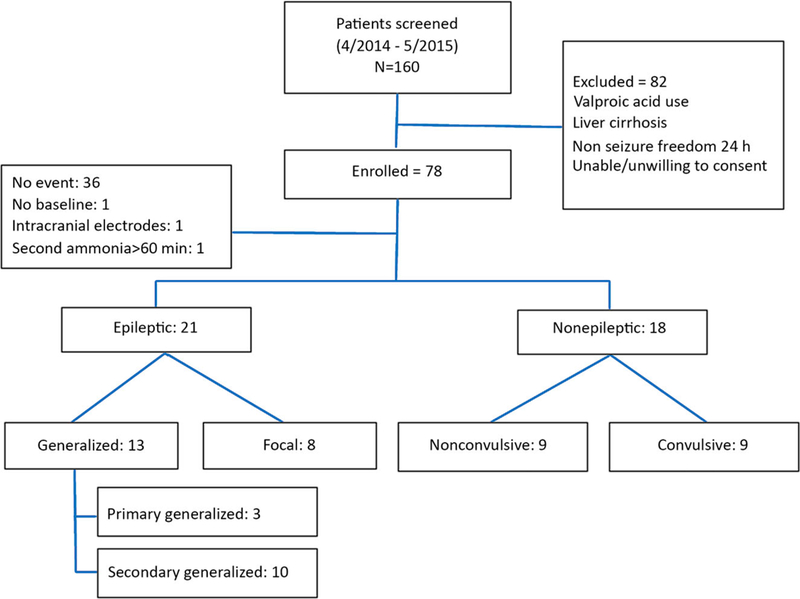
Patient subgroup classification based on event type.
Baseline characteristics of patients are summarized in Table 1. Patients were similar in terms of age but different in terms of gender and baseline ammonia levels among the three groups. Almost 70% of patients in the GCS group were male, whereas only 33% in PNES-C group and 12% in FS group were male. Baseline ammonia was also significantly different among the three groups despite 24-h seizure freedom prior to baseline assessment (GCS: 43.2 ± 9.1 μmol/L; FS: 29.3 ± 11.7 μmol/L; PNES-C: 35.9 ± 11.2 μmol/L; p = 0.02); subsequent pairwise comparisons identified significant difference only between GCS and FS groups (p = 0.006). The time to postictal blood draw was not significantly different among the groups.
Table 1.
Baseline characteristics of patient subgroups
| GCS (N = 13) | PNES-C (N = 9) | FS (N = 8) | p-Value* | |
|---|---|---|---|---|
| Mean age (SD) | 34.8 (15.2) | 35.2 (9.7) | 40.1 (9.6) | 0.58 |
| Males (%) | 9 (69.2%) | 3 (33.3%) | 1 (12.5%) | 0.04 |
| Mean baseline ammonia (μmol/L) (SD) | 43.2 (9.1) | 35.9 (11.2) | 29.3 (11.7) | 0.02 |
| Latency of blood draw after event (min) | 26.6 (16.1) | 30.6 (14.7) | 26.6 (16.1) | 0.83 |
GCS, generalized convulsive seizure; FS, focal seizure; PNES-C, psychogenic nonepileptic seizures with convulsion.
p-Values for group comparisons based on Fisher’s exact test for categorical variables, ANOVA for baseline ammonia, and Kruskal-Wallis test for age.
The primary outcome, baseline-postictal change of ammonia, was significantly different among the three groups. Figure 2 displays side-by-side comparison of baseline and postictal ammonia, demonstrating an obvious postictal increase of ammonia in the GCS group without obvious changes in the other two groups. Statistical analysis (Table 2) confirms the observation in Figure 2. The within-group baseline-postictal change of ammonia was significant in the GCS group only (p = 0.004); the overall test of baseline-postictal change of ammonia among three groups was significant (p = 0.02), and the pairwise comparisons of median changes in ammonia of GCS versus FS (p = 0.04) and GCS versus PNES-C (p = 0.02) were borderline at 0.017 level, whereas that of FS versus PNES-C was not significant (p = 0.41). We also examined if the change of postictal ammonia level was related to the duration of the convulsions or the time of blood draw. Because the duration varied widely among the three groups in such a small sample size, it was impossible to draw a meaningful statistical conclusion about the association between the duration of the spells and ammonia levels based on this pilot study. A larger study would be needed to examine this issue. An inverse correlation between the baseline-postictal change of ammonia and latency to ammonia blood draw was found in the generalized convulsive group (Pearson correlation coefficient = –0.58, p-value = 0.04).
Figure 2.
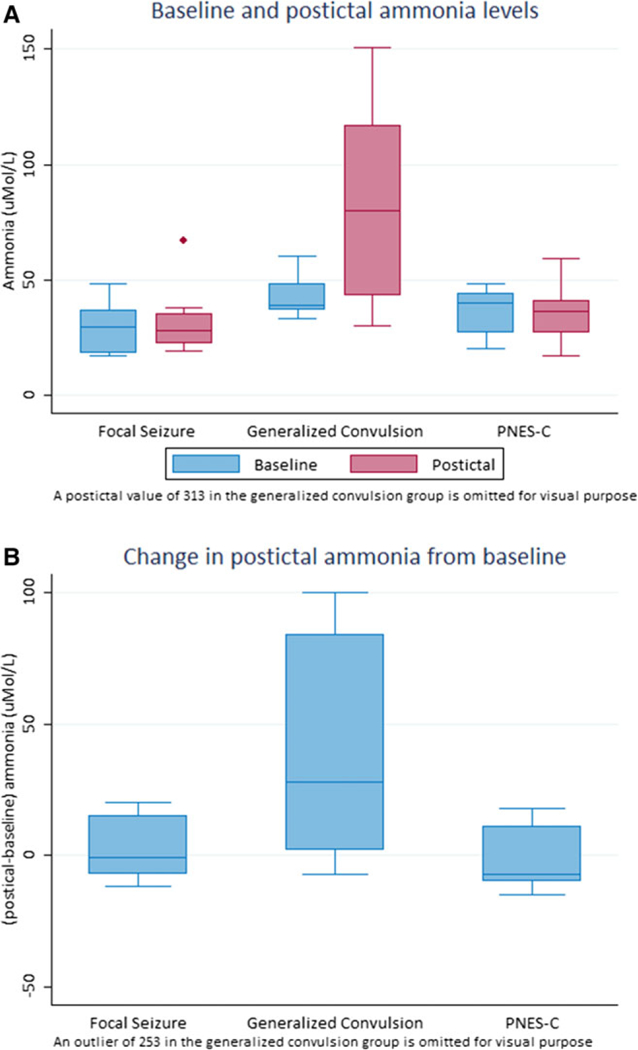
(A) Baseline and postictal ammonia levels. (B) Change in postictal ammonia from baseline.
Table 2.
Baseline and postictal ammonia levels
| Baseline ammonia |
Postictal ammonia |
Baseline-postictal change |
p-Value* | |
|---|---|---|---|---|
| GCS | 39 (11) | 80 (74) | 28 (82) | 0.004 |
| FS | 29.5 (17) | 28 (13) | –1 (22) | 0.67 |
| PNES-C | 40 (17) | 36 (14) | –7 (21) | 0.85 |
Median (IQR), μmol/L.
GCS, generalized convulsive seizure; FS, focal seizure; PNES-C, psychogenic nonepileptic seizures with convulsion.
Test ofwithin-group change byone-sample signed-ranktest.
Kruskal-Wallis test of pre-post change among three groups: p-value = 0.02. Pairwise comparisons using Wilcoxon rank-sum test (significance: p-value <0.0l7).
GCS versus FS: p-value = 0.04.
FS versus PNES-C: p-value = 0.41.
GCS versus PNES-C: p-value = 0.02.
Several post hoc analyses were also conducted to further explore the findings in this study. First, the ammonia levels 24 h after the last event were recorded for some of the patients (6 in FS, 11 in GCS, and 4 in PNES-C), and the elevated postictal ammonia level for patients in the GCS group mostly dropped close to baseline levels [Median (IQR) ammonia levels (imol/L): GCS = 37 (12), PNES-C = 28 (10), FS = 39(19)].
We also explored the possibility of using postictal ammonia level to differentiate the three groups. In clinical practice, this is more useful, since baseline ammonia is usually not available. Two ROC curves were plotted using postictal ammonia, one to assess the ability of postictal serum ammonia level to distinguish GCS from other types of events (FS and PNES-C) (Fig. 3A), and the other differentiating epileptic GCS from PNES-C (Fig. 3B). The area under the first curve was 0.88 (95% confidence interval [CI] 0.69–0.96), suggesting that postictal ammonia measurement may be a good test differentiating epileptic GCS from PNES-C and FS. A cut point of ≥80 μmol/L for ammonia levels (sensitivity of 53.9% and a specificity of 100%) was able to correctly classify 80% of the patients in our cohort. The area under the second ROC curve was 0.84 (0.65–0.97), again suggesting postictal ammonia measurement to be a good test to differentiate epileptic GCS from PNES-C when using a similar cut point of 80 μmol/L. Different sensitivities and specificities at different cut points are provided in Table S2.
Figure 3.
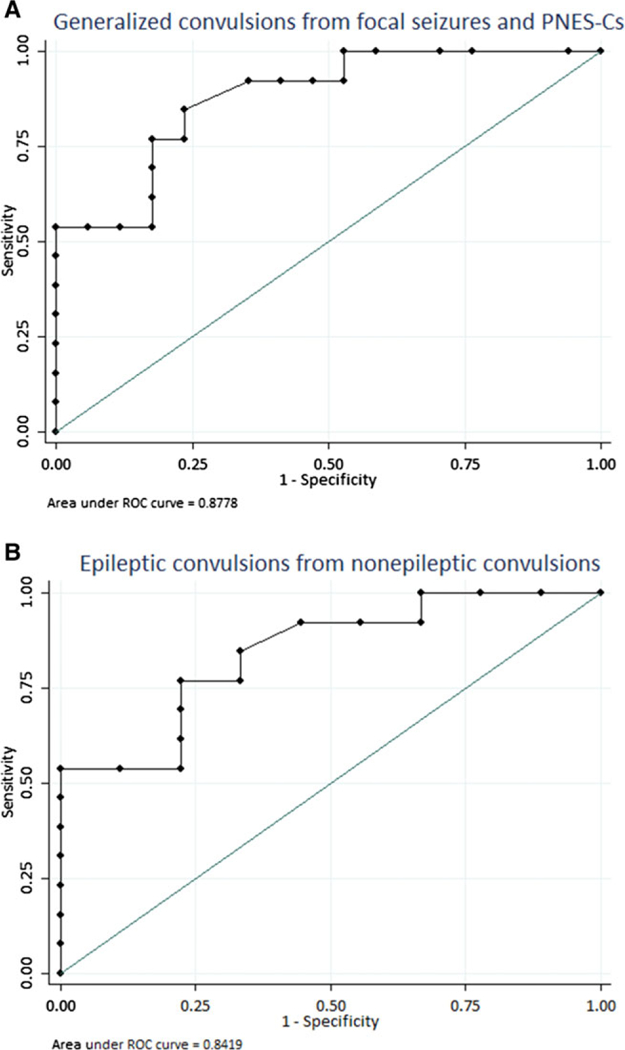
ROC curves differentiating: (A) Generalized convulsive epileptic group from other types (focal seizures and nonepileptic convulsive spells). (B) Epileptic convulsions from nonepileptic convulsions.
Discussion
Despite previous reports of THA following generalized convulsions, our results are the first to provide evidence for the association between THA and ictal electroencephalo-graphic changes on vEEG monitoring during generalized convulsive seizures. A major strength of our study is the utilization of vEEG monitoring to diagnose seizures and PNES-C rather than relying on witness description and/or expert opinion. We also demonstrated that THA as a postictal phenomenon is restricted to epileptic convulsive seizures (either primary or secondary generalized convulsive seizures) rather than PNES-C or FS, pointing to the possibility of using postictal ammonia as a tool to differentiate epileptic convulsions from nonepileptic events. This is supported by an area under the ROC curve of 0.88, which suggests that postictal ammonia may be a good test to differentiate GCS from PNES-C and FS.
THA following generalized convulsions was first reported in a case series byYanagawa et al.4 in 2008, proposing vigorous muscle activity as the mechanism behind this transient elevation. Two larger cohort studies, one retrospective and one prospective, found an association between THA and generalized convulsive rather than nonconvulsive seizures.7,8 Tomita et al.8 reported an OR of 14.8 for this association when 65 μg/dl (46.4 μmol/L) was used as a cutoff value (sensitivity of 53%, specificity of 90%), and suggested ammonia to be a test of “high clinical significance” in diagnosing generalized convulsions. This goes along with the results from our plotted ROC curve when choosing a postictal ammonia level of 80 μmol/L as a cutoff value, which raises the specificity to 100% for differentiating GCS from PNES-C and FS, keeping the sensitivity at 53.9%. However, due to our small sample size, this cutoff value undoubtedly requires validation in a larger study.
Another important finding was the lack of elevation in serum ammonia levels in the PNES-C group. Serum ammonia levels elevate following strenuous exercise,11 so an increase in serum ammonia level after a PNES-C might be expected depending on the degree of muscle activity during the event. However, our study did not reveal such a finding. One possible explanation is the inability ofPNES-C patients to produce agonist and antagonist muscle contractions similar to those noted in epileptic GCS. This finding suggests a possible role of postictal ammonia levels for differentiating GCS from PNES-C, particularly in light of the variable reliability of description in classifying these paroxysmal events accurately.12
There was no increase in serum ammonia levels after FS, an expected finding given the lack of major motor involvement. However, several further observations in this cohort are worth discussing and led us to seek alternative explanations for THA besides vigorous muscle activity. The first observation was related to postictal elevation of ammonia levels (67 μmol/L, 30-point increase from baseline) in a case of an automotor seizure with sensory aphasia associated with electrographic changes, but no abnormal muscle activity other than automatism. The second observation was elevated ammonia levels at baseline in GCS when compared to the other two groups despite 24-h seizure freedom in all groups. Because there was a gender difference between the three groups, a gender effect remains possible. However, our findings raise the possibility of cortical mechanisms contributing to postictal THA.
The role of glutamate in epilepsy is well known as an excitatory neurotransmitter. There is also a close relation between cerebral ammonia level and glutamate/glutamine metabolism.13,14 Cerebral extracellular glutamate levels increase during seizures in human15 and rats,16 with both glutamate and ammonia being released from nervous tissue.17 However, the extent of extracellular ammonia increase needs to be further verified in studies designed to target changes in periictal cerebral extracellular ammonia levels caused by either overproduction or decreased clearance, along with subsequent changes in serum ammonia levels. The proposed increase of cerebral glutamate and ammonia may not be high enough to detect as serum THA in FS unless they generalize and involve sufficient cortical surface area. If the assumption that cortical activity contributes to postictal THA is valid, then the absence of abnormally excessive neuronal activity on EEG could serve as an additional explanation for the lack of THA in PNES-C group. We stress that these speculations are based on observations noted in this cohort and require subsequent investigation in future studies.
Our study has certain limitations. As a pilot study, it was limited by small sample size and being single-centered. Due to small sample size and the exploratory nature of the study, we were unable to conduct more sophisticated analyses to further evaluate the results. For example, the three groups were different at baseline in terms of both gender and baseline ammonia levels. Larger studies that control for possible confounders, such as gender effect on baseline and postictal ammonia levels are needed to confirm the findings in our study, and to provide smoother ROC curves for better sensitivity and specificity assessment. This study was not designed to analyze ammonia degradation curve, and we did not assess the exact time frame in which postictal ammonia can be properly used as a diagnostic test for convulsive seizures. We suggest future studies plan to measure postictal ammonia levels more (immediately after the event then every 10 minutes for the first 60 min) based on the inverse correlation between ammonia levels and blood draw latency in the generalized convulsion group. Finally, our population was only adults, so it is not possible to draw conclusions in a pediatric population.
Despite the limitations, we were able to illustrate a statistically significant difference between the three different groups, a finding that supports the need for a future, larger multicenter study to further define the time frame in which serum ammonia can be used. A larger sample size including pediatric population and different types of epileptic seizures can allow increased understanding of the relationship between TAH and GCS, as well as possible relationships with generalized nonconvulsive epilepsy syndromes (such as absence epilepsy). This may further elucidate the mechanism of increased serum ammonia at a cellular level.
CONCLUSION
By means of utilizing vEEG monitoring, our study provides evidence for the association between THA and GCS seizures. We demonstrated that THA as a postictal phenomenon is restricted to GCS rather than PNES-C, which optimistically can lead to the use of postictal serum ammonia as an inexpensive and readily available diagnostic test to differentiate epileptic seizures from nonepileptic events.
Supplementary Material
Key Points.
Using vEEG monitoring, our study provides evidence for the association between THA and GCS that is lacking in PNES-C and FS
This pilot study serves as the basis for future studies to determine the role of postictal ammonia to differentiate GCS from PNES-C with increased precision
The generators and mechanism of transient postictal hyperammonemia—central versus peripheral—needs to be further verified
ACKNOWLEDGMENTS
Dr. Richard Barohn for his help in obtaining financial support through Ziegler Award, Dr. Sharon Lynch for her guidance on protocol writing, Lauren Aaronson for her guidance in grant writing, Dr. Firas Al Badarin for his manuscript review and insightful comments, and Dr. William Nowack and MaryAnn Kavalir for their help in patient recruitment.
FUNDING
This study was supported by a Zeigler Investigator Grant at the University of Kansas Medical Center and Clinical and Translational Science Award grant from National Center for Advancing Translational Sciences awarded to the University of Kansas Medical Center for Frontiers: The Heartland Institute for Clinical and Translational Research #UL1TR000001 (formerly #UL1RR033179). The contents are solely the responsibility of the authors and do not necessarily represent the official views of the National Institutes of Health (NIH) or NCATS.
Biography

Rawan Albadareen is a vascular neurologist with additional interest in epilepsy and headache.
Footnotes
DISCLOSURE
None of the authors has financial disclosures or conflicts of interest. We confirm that we have read the Journal’s position on issues involved in ethical publication and affirm that this report is consistent with those guidelines.
Supporting Information
Additional Supporting Information may be found in the online version of this article:
REFERENCES
- 1.Chen DK, So YT, Fisher RS. Use of serum prolactin in diagnosing epileptic seizures: report of the Therapeutics and Technology Assessment Subcommittee of the American Academy of Neurology. Neurology 2005;65:668–675. [DOI] [PubMed] [Google Scholar]
- 2.Wyllie E, Lueders H, Pippenger C, et al. Postictal serum creatine kinase in the diagnosis of seizure disorders. Arch Neurol 1985;42:123–126. [DOI] [PubMed] [Google Scholar]
- 3.Brigo F, Igwe SC, Erro R, et al. Postictal serum creatine kinase for the differential diagnosis of epileptic seizures and psychogenic non-epileptic seizures: a systematic review. J Neurol 2015;262:251–257. [DOI] [PubMed] [Google Scholar]
- 4.Yanagawa Y, Nishi K, Sakamoto T. Hyperammonemia is associated with generalized convulsion. Intern Med 2008;47:21–23. [DOI] [PubMed] [Google Scholar]
- 5.Liu KT, Su CS. Postictal transient hyperammonemia. Am J Emerg Med 2008;26:388.e381–388.e382. [DOI] [PubMed] [Google Scholar]
- 6.Liu KT, Lee CW, Yang SC, et al. Postictal transient hyperammonemia as an indicator of seizure disorder. Eur Neurol 2010;64:46–50. [DOI] [PubMed] [Google Scholar]
- 7.Hung TY, Chen CC, Wang TL, et al. Transient hyperammonemia in seizures: a prospective study. Epilepsia 2011;52:2043–2049. [DOI] [PubMed] [Google Scholar]
- 8.Tomita K, Otani N, Omata F, et al. Clinical significance of plasma ammonia in patients with generalized convulsion. Intern Med 2011;50:2297–2301. [DOI] [PubMed] [Google Scholar]
- 9.Berg AT, Berkovic SF, Brodie MJ, et al. Revised terminology and concepts for organization of seizures and epilepsies: report of the ILAE Commission on Classification and Terminology, 2005–2009. Epilepsia 2010;51:676–685. [DOI] [PubMed] [Google Scholar]
- 10.Dhiman V, Sinha S, Rawat VS, et al. Semiological characteristics of adults with psychogenic nonepileptic seizures (PNESs): an attempt towards a new classification. Epilepsy Behav 2013;27:427–432. [DOI] [PubMed] [Google Scholar]
- 11.Banister EW, Cameron BJ. Exercise-induced hyperammonemia: peripheral and central effects. Int J Sports Med 1990;11(Suppl. 2): S129–S142. [DOI] [PubMed] [Google Scholar]
- 12.Ristic AJ, Draskovic M, Bukumiric Z, et al. Reliability of the witness descriptions of epileptic seizures and psychogenic non-epileptic attacks: a comparative analysis. Neurol Res 2015;37:560–562. [DOI] [PubMed] [Google Scholar]
- 13.Cooper AJ. The role of glutamine synthetase and glutamate dehydrogenase in cerebral ammonia homeostasis. Neurochem Res 2012;37:2439–2455. [DOI] [PMC free article] [PubMed] [Google Scholar]
- 14.Albrecht J, Norenberg MD. Glutamine: a Trojan horse in ammonia neurotoxicity. Hepatology 2006;44:788–794. [DOI] [PubMed] [Google Scholar]
- 15.During MJ, Spencer DD. Extracellular hippocampal glutamate and spontaneous seizure in the conscious human brain. Lancet 1993;341:1607–1610. [DOI] [PubMed] [Google Scholar]
- 16.Medina-Ceja L, Pardo-Pena K, Morales-Villagran A, et al. Increase in the extracellular glutamate level during seizures and electrical stimulation determined using a high temporal resolution technique. BMC Neurosci 2015;16:11. [DOI] [PMC free article] [PubMed] [Google Scholar]
- 17.Tsacopoulos M, Poitry-Yamate CL, Poitry S. Ammonium and glutamate released by neurons are signals regulating the nutritive function of a glial cell. J Neurosci 1997;17:2383–2390. [DOI] [PMC free article] [PubMed] [Google Scholar]
Associated Data
This section collects any data citations, data availability statements, or supplementary materials included in this article.