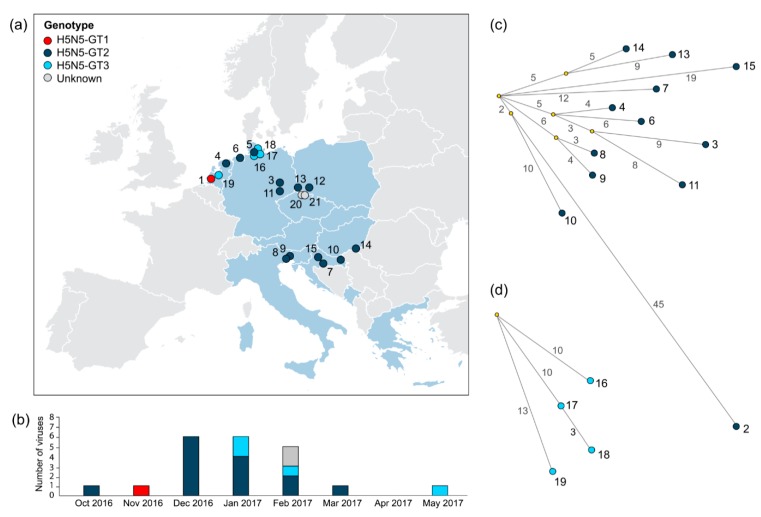
Figure 2.
Spatiotemporal distribution and phylogenetic network analysis of HPAI H5N5 genotypes. (a) Map of Europe showing the geographical distribution of highly pathogenic avian influenza (HPAI) H5N5 viruses isolated during the HPAI H5 2016–2017 epidemic, with countries reporting HPAI H5N5 virus infection (blue) and the collection locations of HPAI H5N5 viruses, colored by genotype. (b) Number of HPAI H5N5 viruses isolated during the HPAI H5 2016–2017 epidemic per month, colored per genotype. (c) Median-joining network analysis of viruses belonging to genotypes H5N5-GT2. (d) Median-joining network analysis of viruses belonging to genotype H5N5-GT3. The number of nucleotide substitutions between strains are shown as values near branches. Detailed information on the virus sequences is provided in Table S2.

